The longstanding claim is CO2 (greenhouse gas) top-of-atmosphere (TOA) forcing drives climate change. But it is too cold at the TOA for CO2 (or any greenhouse gas) to exist.
TOA greenhouse gas forcing is a fundamental tenet of the CO2-drives-climate-change belief system. And yet the “global-mean longwave radiative forcing of CO2 at TOA” (Schneider et al., 2020) may not even exist.
It is easily recognized that water vapor (greenhouse gas) forcing cannot occur above a certain temperature threshold because water freezes out the farther away from the surface’s warmth H2O goes.
According to NASA, the TOA is recognized as approximately 100 km above the surface. The temperature near that atmospheric height is about -90°C.
Case focuses on how much authority state legislatures have on elections and whether courts can intervene.
The U.S. Supreme Court is set to hear oral arguments in a North Carolina redistricting case on Wednesday that could have broad implications for both the state and the nation.
Justices will hear Moore v. Harper on Wednesday to determine whether state courts can override lawmakers in the redistricting process.
North Carolina Republicans argue in a brief “the text of the Elections Clause provides the answer: it assigns state legislatures the federal function of regulating congressional elections.”
Justices on the Democrat-controlled state Supreme Court cited state constitutional provisions for blocking congressional districts created by the General Assembly last year to impose a different map devised by a court-appointed “special master.”
But Republicans argue that because the Constitution’s Election Clause “is supreme over state law, the States may not limit the legislature’s discretion.”
The outcome of the case will impact redistricting efforts in states across the country, and in the process could shift the balance of political power. But critics contend the case could also reverberate into other decisions, as well.
A brief submitted by the League of Women Voters argues a ruling in support of North Carolina Republicans’ independent state legislature theory “would not be confined to redistricting plans, applicable to only particular offices or legislative bodies.”
“Adopting the petitioners’ theory would open the door to the retroactive abrogation of all state court rulings that have invoked state constitutional grounds to strike down state statutes – but only as to federal elections,” the brief read.
In North Carolina, the 2022 congressional map adopted by the state Supreme Court resulted in a congressional delegation split 7-7 between Republicans and Democrats in the November election. Critics of the 2022 map approved by the General Assembly contend it would have produced 10 Republican seats in Congress. Republicans in the General Assembly plan to redraw the map in 2023, and the case will weigh on that process.
Republicans argue state courts have no role in policing federal elections.
“The Framers (of the U.S. Constitution) could have assigned the power over federal elections in the first instance to states, without specifying which entity of state government would have primary responsibility,” the brief argues. “But recognizing that prescribing the times, places, and manner of federal elections is fundamentally a legislative role, the Framers specified that this delegated power would be exercised by ‘the Legislature thereof.'”
The November election shifted control of the North Carolina Supreme Court from a 4-3 Democrat majority to a 5-2 Republican majority, suggesting that regardless of the outcome of Moore v. Harper, the state’s high court may be more likely to uphold a map from the Republican-controlled General Assembly.
The case will have an impact on the General Assembly’s ability to impose rules for free and fair federal elections, such as voter identification laws opposed by Democrats, mail voting and voter registration rules, among others.
Common Cause North Carolina contends a positive outcome for Republicans would “overturn our historic victory against gerrymandering from earlier this year and unleash voter suppression against the people of North Carolina.”
“It would make it harder to turn public demands into public policy that reflects the needs and values of our communities,” according to an announcement urging followers to “stop the North Carolina’s most brazen power grab yet.”
If you only read the New York Times editorials, you’d believe that political violence in America is a “right-wing” problem. The Times has been warning of violence from the right for years, but on Nov. 19 and 26, they wrote two long editorials making these claims. The violence stems from the lies “enthusiastically spread” by Republican politicians. Democrats’ only complicity was their $53 million in spending on “far-right fringe candidates in the primaries.” The fringe candidates, it was hoped, would be easier to beat in the general election.
Both editorials mention the mass murderer in Buffalo, New York, as a political right-winger. But they have been doing that all year. In May, the Times claimed he was of the right because he was racist and listened to a video on a “site known for hosting right-wing extremism.”
The headline in the Times announced:
“Replacement theory, espoused by the suspect in the Buffalo massacre, has been embraced by some right-wing politicians and commentators.”
You wouldn’t know it from reading the Times, but the Buffalo killer was yet another mass murderer motivated by environmentalism.
In his manifesto, the Buffalo mass murderer self-identifies as an “eco-fascist national socialist” and a member of the “mild-moderate authoritarian left.” He expresses concern that minority immigrants have too many children and will damage the environment. “The invaders are the ones overpopulating the world,” he writes. “Kill the invaders, kill the overpopulation and by doing so save the environment.”
The murderer argues that capitalists are destroying the environment, and are at the root of much of the problem.
“The trade of goods is to be discouraged at all costs,” he insists.
Overpopulation and the environment are hardly signature conservative issues.
It’s certainly not something you’ll hear Donald Trump talk about at his rallies. And while some Republicans believe in limiting international trade, it’s certainly not for environmental reasons.
The Buffalo murderer’s manifesto has word-for-word similarities to those of the mass shooters in 2019 at a New Zealand mosque and at an El Paso Walmart.
But the New York Times has consistently referred to the New Zealand mosque attacker as “far-right,” and tried to link the murderer to President Donald Trump’s supposedly racist language. The Times describes the El Paso murderer as having “echoed the incendiary words of conservative media stars” who have spoken out against illegal immigration.
But conservatives don’t usually declare that “conservatism is dead” and that “global capitalist markets are the enemy of racial autonomists.” Nor do they call themselves “eco-fascist” and profess that, “The nation with the closest political and social values to my own is the People’s Republic of China.”
“The decimation of the environment is creating a massive burden for future generations … The next logical step is to decrease the number of people in America using resources. If we can get rid of enough people, then our way of life can become more sustainable.”
All three of these deranged killers made minorities their principal target. But they’ve done so out of a crazy environmentalist determination to reduce the human population by whatever means necessary.
The news media and politicians who constantly warn about the world’s imminent end can’t bring themselves to acknowledge the environmentalist connection, even though climate activists time and again agree that overpopulation is part of the problem. “It does lead, I think, young people to have a legitimate question: Is it okay to still have children?” said Rep. Alexandria Ocasio-Cortez in 2019. She also warned that the “‘world will end in 12 years if we don’t address climate change.”
Similarly, President Biden fans the flames of alarmism when he claims that “climate change poses an existential threat to our lives … this is code red.”
Of the 82 mass public shootings from January 1998 to May 2021, 9% have known or alleged ties to white supremacists, neo-Nazis, or anti-immigrant views.
But many of those, such as the Buffalo murderer, are environmentalist authoritarians.
Another 9% of mass public shootings are carried out by people of middle eastern origin, despite them making up only 0.4% of the US population. Whites and Hispanics are underrepresented as a share of the population. Blacks, Asians, and American Indians commit these attacks at a slightly higher rate than their share of the population.
Even violence against pro-life people and organizations this year has been over 22 times more frequent that violence against pro-choice groups.
The New York Times, like the Washington Post and other news outlets, is intent on construing any racist as a conservative, right-winger. But they aren’t. And if there’s any ideological cause that really is sparking violence, it’s environmental extremism.
Today, we learned more about the FBI’s influence operation during the 2020 election election. Yesterday, as part of a civil rights suit against the Biden Administration, Missouri Attorney General (and Senator-elect) Eric Schmitt released the deposition transcript of Dr. Anthony Fauci.
And just now, he just posted the transcript of FBI Supervisory Special Agent Elvis Chan. Read it here.
The importance of SSA Chan shouldn’t be understated. He was at the front-lines of the FBI’s efforts to curb speech on social media during the 2020 election. It was Chan who has been reported to have had “weekly meetings with major social media companies to warn against Russian disinformation attempts ahead of the 2020 election.”
Chan’s testimony provides insight into these efforts. Here are the highlights.
Chan and the 2016 DNC “Hack”
For starters, just so you get an idea of who you’re dealing with, Chan is a firm believer in the still-unproven theory that Russia hacked the DNC/DCCC and then leaked those materials “over the course of the 2016 election.” It gets better: Chan was the supervisor of a squad that helped investigate the 2016 DNC hack.
One can’t help but ask whether Chan, a “supervisor”, could have obtained the DNC server. Or if he even though to request it. As observed by our friend Stephen McIntyre, Chan was in contact with DNC/Hillary campaign lawyer Michael Sussmann about that hack.
In fact, Chan believes Russia could have influenced the 2016 presidential election:
The 2020 Election – Security Meetings between the US Government and Social Media Companies.
Leading up to the 2020 election, Chan was present during meetings between social media and tech companies, such as Facebook, Microsoft, Google, Twitter, Yahoo, and Reddit, and the U.S. Government, which was represented by CISA (Cybersecurity and Infrastructure Security Agency), Office of the Director of National Intelligence (ODNI), Department of Homeland Security, and the FBI.
The FBI and other agencies would provide the social media/tech companies with “strategic information” regarding foreign – and specifically Russian – “influence campaigns.” One example of this information sharing had to do with the Russian company “Internet Research Agency” (a troll farm that was indicted by Mueller before those charges were ultimately dismissed by Barr), which had moved their operations to Ghana and Nigeria. Chan and the FBI believe the Internet Research Agency “is trying to make inroads in western Africa.” A warning to the West: your memes are from Russians in Western Africa.
Chan testified that once the social media companies get this information they take down the accounts. The FBI doesn’t “control” what the companies do; they just provide “information” so the social media companies can take whatever steps they deem appropriate. One of those appropriate steps – one of those ways to “protect their platforms” – is to take down those accounts. In fact, Chan concluded in his thesis that the US government essentially assisted with “account takedowns.” It was a joint effort.
In other words, the social media companies don’t need directions from the US government to remove content because there’s an understanding between the parties. This would include content that the US government deemed to be foreign (Russian) “social media influence campaigns” that focus on current events or “amplify existing content.” This is all for the Russian government’s purpose to “sow discord”:
Chan also explained how the FBI would share the “disinformation” or “misinformation” with social media companies. It would take place around the time of quarterly meetings, if not more frequently through secure e-mails if the FBI field offices thought necessary. For example, the FBI might notify Facebook that a certain IP address is associated with the Internet Research Agency. The accounts flagged by the FBI are always removed by the social media companies, in large part because of pressure from Congressional Committees. As explained by Chan:
Around this same time, there were visits from Congressional staffers to pressure social media companies. Senior-level staffers have even visited Facebook, Google, and Twitter as part of these influence – or censorship – campaigns.
Chan continued:
Information about the 2020 Election and the suppression of American content.
During the 2020 election, the FBI’s San Francisco field office had an election “command post,” which flagged “disinformation” regarding “the time, place or manner of elections in various states.” The flagged content would be referred to the applicable social media platform where it was posted. It didn’t matter whether the content was from Americans or from a foreign actor. Chan explained that the FBI was conducting these actions upon instructions from the DOJ, which had informed them “that this type of information was criminal in nature.”
The social media companies sometimes disagreed. In fact, half the time the social media companies wouldn’t remove the content. Chan estimated a 50% success rate.
The Purported 2020 Russian “hack and leak” operation.
There’s a lot to cover here, and hopefully I provided enough background to get to the juicier stuff. Or at least the content that applies, in some ways, to the more concerning suppression of information during the 2020 election and after, such as the Hunter Biden laptop and COVID-19 information.
The Reactionary is a reader-supported publication. To receive new posts and support my work, consider becoming a free or paid subscriber.
Here’s Chan discussing FBI warnings about a “2016-style DNC hack-and-dump operation” and gave instructions to “stay vigilant” about similar operations that may take place “before the [2020] election”:
Chan didn’t warn the companies based on actionable intelligence. Instead, the FBI gave this warning multiple times out of “an abundance of caution” and based on what allegedly transpired in 2016 with the DNC/DCCC hack.
At around that time, Chan wasn’t aware that the FBI had in its possession the Hunter Biden laptop. He only became aware when this information was published by news outlets. Hunter Biden, according to Chan, was never mentioned in the FBI meetings with the social media companies. Facebook, however, asked about the Hunter Biden information. The FBI’s response? “No comment.” Chan explains
Chan was presented with a declaration from Yoel Roth, the then-Twitter Head of Trust and Safety, in which Roth stated he was informed by people in the intelligence community to “expect” attacks on individuals linked to political campaigns. Chan’s recollection differed, stating that there was only the potential for such attacks.
Roth also stated in his sworn declaration there were rumors “that a hack-and-leak operation would involve Hunter Biden.” Chan couldn’t recall Hunter Biden ever being mentioned in those meetings.
Q: How would you interpret what he said when he says he learned that there were rumors that a hack-and-leak operation would involve Hunter Biden? What do you think he’s referring to?
A: Yeah, in my estimation, we never discussed Hunter Biden specifically with Twitter.
Chan also claimed ignorance to Roth’s contention that Twitter’s belief the Hunter Biden materials could have been hacked was based on “the information security community’s initial reactions.” Chan wasn’t sure if this included the FBI, or if Twitter reached out to the FBI about the Hunter Biden information.
But – if the material were “hacked” – the social media companies were put on notice that they needed policies to address that situation. A harmless question? More of a hint to get social media companies to agree to remove the content. Especially because the FBI had plans to ask the social media companies themselves to remove hacked content.
I hope it’s clear what happened. There’s not a smoking gun – there’s no direct e-mail from Chan or from the FBI to Twitter of Facebook, from what we’ve seen, to remove the Hunter Biden story. That’s by design: there didn’t need to be. The instructions from the US government about “hack and leak” operations were quite clear, and the agency did nothing to dissuade social media companies from “believing” the Hunter Biden materials where hacked. The beauty of this plan, if you can call it that, was that the FBI and Twitter (and Facebook) all gave themselves cover by pointing the finger to the other.
In a close election, that’s what we call tipping the scales.
In related news… Twitter General Counsel James Baker has been “exited.” The story is still developing, but part of the reason appears to be because he was “vetting” the Twitter Files which show FBI/Twitter communications and which inform the decision to ban the Hunter Biden story. More to come as that story develops…
Mac Timred21 hr agoThere is a red hot smoking gun right here, that the DOJ advised that disinformation would be criminal in nature. That right there is the smoking gun. THIS IS NOT LISA MONACO, THIS IS (IN THEORY) BILL BARR’S DOJ. Exactly who at the DOJ communicated this, and pursuant to orders from what chain of command?
The media has ceased to exist, and the public plods on by assuming as true whatever the media suppresses and as false whatever the media covers.
The current “media”—loosely defined as the old major newspapers like the New York Times and Washington Post, the network news channels, MSNBC and CNN, PBS and NPR, the online news aggregators like Google, Apple, and Yahoo, and the social media giants like the old Twitter and Facebook—are corrupt.
They have adopted in their news coverage a utilitarian view that noble progressive ends justify almost any unethical means to obtain them. The media is unapologetically fused with the Democratic Party, the bicoastal liberal elite, and the progressive agenda.
The result is that the public cannot trust that the news it hears or reads is either accurate or true. The news as presented by these outlets has been carefully filtered to suppress narratives deemed inconvenient or antithetical to the political objectives of these entities, while inflating themes deemed useful.
This bias now accompanies increasing (and increasingly obvious) journalistic incompetence. Lax standards reflect weaponized journalism schools and woke ideology that short prior basic requisites of writing and ethical protocols of quoting and sourcing. In sum, a corrupt media that is ignorant, arrogant, and ideological explains why few now trust what it delivers.
Suppression
Once a story is deemed antithetical to left-wing agendas, there arises a collective effort to smother it. Suppression is achieved both by neglect, and by demonizing others who report an inconvenient truth as racists, conspiracist “right-wingers,” and otherwise irredeemable.
The Hunter Biden laptop story is the locus classicus. Social media branded the authentic laptop as Russian disinformation. That was a lie. But the deception did not stop them from censoring and squashing those who reported the truth.
Instead of carefully examining the contents of the laptop or interrogating Biden-company players such as Tony Bobulinksi, the media hyped the ridiculous disinformation hoax as a mechanism for suppressing the damaging pre-election story altogether.
Joe Biden’s cognitive state was another suppression story. The media simply stifled the truth that 2020 candidate Biden was unable to conduct a normal campaign due to his frailty and non-compos-mentis status. Few fully reported his often cruel and racist outbursts of the “lying-dog-faced-pony-soldier” and “you ain’t black”/“terrorist” sort.
The #MeToo media predictably quashed the Tara Reade disclosure. In fact, journalists turned on her in the manner that they previously had insisted was sexist and defamatory “blame-the-victim” smearing.
Joe Biden has long suffered from a sick tic of creepily intruding into the private space of young women and preteen girls: blowing their hair, talking into their ears, squeezing their necks, hugging in full body embraces—all for far too long. In other words, Biden should have expected the Charlie Rose or the Donald Trump Access Hollywood media treatment. Instead, he was de facto exonerated by collective media silence. To this day, despite staffers’ efforts to corral his wandering hands and head, he occasionally reverts to form with his creepy fixations with younger women.
Ask the media today which administration surveilled journalists and they will likely cry “Trump!” Yet their own sensationalist reporting that the IRS was weaponized by Trump was proven a lie when the inspector general notedTrump never went after either James Comey or Andrew McCabe. And it was an untruth comparable to the smear that “nuclear secrets” and “nuclear codes” were hidden away at Mar-a-Lago or that Donald Trump sought to profit from the trove. Nor does anyone remember that Barack Obama went after the Associated Press reporters and Fox News Channel’s James Rosen. Nor do they care that Biden sought to birth an Orwellian Ministry of Truth censorship bureau.
Fantasy
The media does not just suppress, but concocts. The entire Russian-collusion hoax—Robert Mueller’s vain 22-month and $40 million investigation—was a complete waste of time on the one hand, but on the other an effective effort to destroy the effectiveness of an elected president.
How many print and television celebrity journalists declared that Trump would shortly resign, be jailed, or impeached over the pee-pee tape or Christopher Steele’s other mishmash of lies? The problem for the media in promoting the fallacious dossier was not just that it was untrue, but that it was so awfully written, so obviously poorly sourced, and so Drudge Report-like amateurishly sensational that it could not be appear factual to any sane person—other than an agenda-driven and addled journalist who found it useful.
Do we remember the Hillary Clinton-approved Alfa Bank/Trump Tower fable that is now resurfacing for a second try?
Or the Jussie Smollett caper that trumped even the Brett Kavanaugh-as-teenage-assaulter and rapist lie? Or the Covington kids fabrications that trumped the Duke lacrosse hoax that trumped the “Hands Up, Don’t Shoot” myth that trumped the “white Hispanic,” doctored photo/edited 911 call smear about George Zimmerman?
Recall Trump’s supposed “immigration jails” and “kids in cages” at the border—in truth both not cages and in fact birthed by Obama.
Then there was Trump’s supposedly impeachable offense of purportedly canceling military aid to Ukraine so that he could allegedly hound the innocent Biden family—rather than delaying, but not canceling, offensive arms vetoed by the Obama Administration for the prescient worry that the Biden family had left a trail of corruption in Ukraine.
Who ran with the “voter suppression” untruth that Stacey Abrams was the “real” governor of Georgia or the yarn that Donald Trump was illegitimately elected? How exactly did Jeffery Epstein and Harvey Weinstein operate as sexual perverts and high-profile, liberal-benefacting deviants for years without media scrutiny? Who created the cable news myth of now-felon Michael Avenatti as presidential timber?
Chronological Manipulation
Why, after the midterms, did we suddenly learn that Donald Trump did not, as in the case of Barack Obama’s Lois Lerner skullduggery, manipulate the IRS for political purposes to go after James Comey and Andrew McCabe? Why suddenly post-election did we read that his presidential papers at Mar-a-Lago really did not contain “nuclear codes” and “nuclear secrets” or stuff intended for sale? Why did we learn after November 8 that a special counsel was suddenly appointed? Why did we discover the Ponzi scheme of Sam Bankman-Fried only after the midterms and why is he treated as an aw-shucks teen in bum drag rather than a calculating and conniving crook?
The answer is the same as why, just days before the 2016 election, we were assured suddenly by the media that the DNC’s planted stories about Christopher Steele’s dossier “proved” that Trump was a Russian stooge.
Asymmetry
When did the media finally dribble out that Obama’s memoir Dreams From My Father was chock full of lies and thus was intended all along to be read as “impressionistic” rather than factual?
We only learned belatedly that Hillary Clinton did not brave the front lines in virtual combat in Bosnia. We were assured that she was completely out of the loop on the Uranium One deal and thus knew nothing about the cash that poured into the Clinton Foundation and Bill Clinton’s honoraria from Russian sources?
Did the media ever fully report that Hillary Clinton: 1) broke the law by using a personal server to communicate while Secretary of State; 2) lied about the missing emails by claiming they were all personal about “yoga” and “weddings” and such; 3) destroyed subpoenaed evidence by smashing her devices; 4) had her husband accidently bump into Attorney General Loretta Lynch on a Phoenix tarmac who was supposedly investigating Clinton at the time; and 5) became our first major election denialist by declaring “Russian collusion” to be true, Donald Trump to be illegitimately elected, and the 2016 balloting to be “rigged”?
Unethical Behavior
Our once lions of network news were long ago revealed to have feet of clay. Dan Rather insisted that “fake but true” memos “proved” George W. Bush got special exemptions from military service. Brian Williams fabricated an entire Walter-Mitty fantasy existence with ease. The Wiki Leaks Podesta trove revealed blue-chip reporters checking in with the Clinton campaign and the DNC to “fact check” and brainstorm their pre-publication puff pieces.
Throughout the Obama years, Ben Rhodes, the failed novelist and deputy national security advisor distorted U.S. foreign policy, as CBS News, overseen by his brother, warped its coverage of him.
Do we remember the commentary on MSNBC of the brilliant Vanderbilt professor and MSNBC “analyst,” presidential historian Jon Meacham? He periodically praised Joe Biden’s eloquence and moving addresses without informing his audience that he contributed to or indeed helped write what he gushed about. No problem. Even after finally being fired, Meacham is still at it, offering his input on Biden’s September 1, Phantom-of-the-Opera “un-American” rant.
CNN Sums It Up
The long, slow death of Jeffery Zucker’s CNN is emblematic of all the mortal sins listed above of our present-day corrupt media.
It is ancient history now and thus forgotten that the self-righteous MSNBC anchorman Lawrence O’Donnell falsely claimed that Deutsche Bank documents would prove that Russian oligarchs co-signed a loan application for Donald Trump.
Over a decade ago, CNN’s Candy Crowley—remember this impartial “moderator” of the second 2012 presidential debate?—infamously transformed before our very television eyes into an active and shameless partisan by attacking candidate Mitt Romney. CNN commentator Donna Brazile topped Crowley when she unethically leaked primary-debate questions to candidate Hillary Clinton. When pressed, Brazile serially denied her role.
CNN’s former Obamaite Jim Sciutto is known as a serial offender of journalistic ethics and was recently the subject of an internal investigation. Sciutto has also alleged, falsely, that the CIA had yanked a high-level spy out of Moscow because of President Trump’s supposedly dangerously reckless handling of classified information. Sciutto joined CNN’s Carl Bernstein and Marshall Cohen to falsely report that Lanny Davis’ client Michael Cohen would soon assert that Trump had prior knowledge of an upcoming meeting between his son and Russian interests.
Another CNN trio of Thomas Frank, Eric Lichtblau, and Lex Harris were forced out from CNN for their mythologies that the Trump-hating Anthony Scaramucci was directly involved in a $10 billion Russian fund.
CNN’s Julian Zelizer fabricated his own tall tale that Donald Trump never reiterated America’s commitment to honor NATO’s critical Article 5 guarantee. The quartet of CNN’s Gloria Borger, Eric Lichtblau, Jake Tapper, and Brian Rokus all were exposed wrongly assuring that former FBI director James Comey would unequivocally contradict President Trump’s prior assertion that Comey had told him he was not under investigation.
CNN reporter Manu Raju in December 2017 trafficked in lots of fake news stories that Donald Trump, Jr. supposedly had prior access to the hacked WikiLeaks documents. And he offered another fable that Trump, Jr. would be indicted by Mueller’s special-counsel investigation. But then, who at CNN did not blast out such “bombshells” and “walls are closing in” lies?
The once supposedly great Chris Cuomo—finally fired for softball incestuous interviews with his brother Andrew while serving as confidant to his sibling’s sexual-harassment dilemmas—had been caught on tape screaming obscenities. He also lied on the air when he assured a CNN audience in 2016 that it was illegal for citizens to examine the just-released WikiLeaks emails.
Julia Ioffe was eagerly hired by CNN after Politico fired her for tweeting that the president and his daughter Ivanka might have had an incestuous sexual relationship. CNN Anderson Cooper was every bit as creepy. He harangued a pro-Trump panelist with “If he [Trump] took a dump on his desk, you would defend it!”
Erstwhile CNN religious “expert” Reza Aslan was not so subtle. He trashed Trump as “this piece of sh**.” The late CNN cooking show guru Anthony Bourdain openly joked about poisoning Trump with hemlock. Recall CNN New Year’s Eve host Kathy Griffin posing with a bloody facsimile of Trump’s severed head. Was there something in the CNN contract that stipulated CNN journalists had to be obscene, vulgar, and threatening?
But for that matter, former CIA director Michael Hayden preposterously alleged that Trump’s immigration policies resembled those in the death camps of Nazi Germany. Was it any wonder either that CNN host Sally Kohn and her roundtable panelists raised their hands to reverberate the “hands up, don’t shoot” lie of the Ferguson shooting?
Do the bias, invective, and lack of ethics of the media even matter anymore?
In truth, media corruption has changed the course of recent history.
Had the true nature of the contents of the Hunter Biden laptop been reported, the 2020 voters have polled that the revelation may well have made a difference because they would not have voted for a candidate so clearly compromised by foreign interests.
Tell the full story of death, destruction, arson, looting, and injured police of the post-George Floyd rioting and what emerges is not the MSNBC denial of violence or the August 2020 CNN lie of a “fiery but mostly peaceful” sort of idealistic protestors.
The Kavanaugh and Smollett fake news accounts helped further to tear apart the country and greenlighted the new assaults on the Supreme Court, from Senator Chuck Schumer’s (D-N.Y.) rants and threats to the would-be assassin who turned up near the Kavanaugh residence.
The Russian collusion hoax and the first impeachment media hysteria virtually ruined a presidency and have had grave foreign-policy consequences vis à vis Russia.
The media, moreover, matter-of-factly assumed Twitter was an arm of the Democratic Party. Mark Zuckerberg and the FBI worked together to suppress any news embarrassing to the Biden campaign. Do not expect much media coverage of Elon Musk’s serial disclosures of Twitter’s efforts to suppress free communications.
No thanks to the media, after nearly three years we are finally learning that the Wuhan Lab proved the likely source of the COVID pandemic and that the media-sainted Dr. Anthony Fauci subsidized gain-of-function viral research in Wuhan.
Despite the lies, Americans assumed that Officer Brian Sicknick was not killed by Trump supporters as reported. The public shrugged “of course” when the media did its best to suppress the name of the Capitol policeman who lethally shot Ashli Babbitt for attempting to go through a broken window inside the Capitol. And on and on.
In sum, there is no media. It has ceased to exist, and the public plods on by assuming as true whatever the Pravda-like news outlets suppress and as false whatever they cover.
“…With no feedback effects at all, the change would be just 1 degree Celsius, climate scientists agree…” So, for ECS there is no positive feedback and global warming is just made from models, not reality. So, what did this article find the ECS to be? 0.7, or less than 1 degree celsius
2022 / November / 24 / Study Finds The CO2 Greenhouse Effect Is Real…But Dangerous Global Warming From Rising CO2 Is Not
German physicists claim to have experimentally demonstrated the greenhouse effect from greenhouse gases like CO2 and CH4 is a real phenomenon, but assess the climate sensitivity to a doubling of CO2 with feedbacks is “only ECS = 0.7°C … 5.4x lower than the mean value of CMIP6 with ECS = 3.78°C.”
“The derived forcing for CO2 is in quite good agreement with some theoretical studies in the literature, which to some degree is the result of calibrating the set-up to the spectral calculations, but independently it determines and also reproduces the whole progression as a function of the gas concentration. From this we deduce a basic equilibrium climate sensitivity (without feedbacks) of ECSB = 1.05°C. When additionally assuming a reduced wing absorption of the spectral lines due to a finite collision time of the molecules this further reduces the ECSB by 10% and, thus, is 20% smaller than recommended by CMIP6 with 1.22°C.”
“Detailed own investigations also show that in contrast to the assumptions of the IPCC water vapor only contributes to a marginal positive feedback and evaporation at the earth’s surface even leads to a significant further reduction of the climate sensitivity to only ECS = 0.7°C (Harde 2017 [15]). This is less than a quarter of the IPCC’s last specification with 3°C (see AR6 [1]) and even 5.4x lower than the mean value of CMIP6 with ECS = 3.78°C.”
“The presented measurements and calculations clearly confirm the existence of an atmospheric GHE, but they also demonstrate the only small impact on global warming, which apparently is much more dominated by natural impacts like solar radiative forcing (see, e.g., Connolly et al. 2021 [16]; Harde 2022 [17]). Therefore, it is high time to stop a further indoctrination of our society with one-sided information, fake experiments, videos or reports, only to generate panic.”
Key to me is “…Why is albedo change important? Because the IPCC theory of CO2 effect on GW assumes that the earth’s albedo has been constant (or not changed much) and CO2 (and other greenhouse gases) thru Radiative Forcing effect GW. The resent satellite data says this is not true...”
**From web sources: “,… in 1697 the Dutch explorer Willem de Vlamingh discovered black swans in Australia, upending the belief” (that all swans were white) “and transforming how we understand the natural world. …the phrase “black swan event” came to refer to an event that suddenly proves something that was previously thought to be impossible.”
(This paper is a continuation of my previous paper (1) with new data that reaches the conclusion that “CO2 is innocent but Clouds are Guilty” )
Part I: CO2 is Innocent but Clouds are Guilty.
Our tax dollars have been at work with NASA for the last 20+ years putting satellites in orbit to detect and measure the “CO2 effect” on Global Warming, GW. After 20 years, the CERES satellite (and others) has discovered that cloud reduction is the major effect on GW for those 20 years. Two papers published in 2021 reach this conclusion, Dübal and Vahrenholt, (2) and. Loeb, Gregory et al (3)
These new papers do claim some sign of CO2 effect (and other greenhouse gases) on GW; but the papers show the dominate effect on GW for those 20 years was the cloud reduction effect (albedo reduction- warming). This paper will show that the observed cloud reduction will account for all the GW in those 20 years and back to 1975, leaving no GW left over for the CO2 effect on GW. Cloud reduction is albedo reduction, (albedo: color of the earth, black, 0.0, is hot and white, 1.0, is cool). Another recently published paper (2021) by Goode et al (4) measuring earth’s albedo from moon shine also reports the same reduction in albedo as the CERES data of both Dübal and Loeb: one can only conclude that for 20 years of data the albedo change is real.
Why is albedo change important? Because the IPCC theory of CO2 effect on GW assumes that the earth’s albedo has been constant (or not changed much) and CO2 (and other greenhouse gases) thru Radiative Forcing effect GW. The resent satellite data says this is not true. Cloud cover changes are best documented at “Climate and Clouds”(5) with links to the data source at “Climate Explorer” (6). “Climate and Clouds” conclude that cloud change only accounts for 25% of the GW. This paper will show an improved analysis of “Climate and Clouds” data agrees with the CERES data of Dübal and Loeb that cloud reduction is accounting for most if not all of the warming over CERES’s 20 years. Figures 1 and 2 show a graphic representation of what Dübal and Loeb observed in the CERES data and what was expected from IPCC Radiative Forcing, RF, theory. The shape (slopes) of the observed and expected are entirely different but the increase in the missing energy (Earths Energy Imbalance, EEI) is the same. The missing energy, EEI, is used to warm the earth though the energy balance equation:
Energy In = Energy out + Accumulation (EEI) Eq 1.
If the accumulation (EEI) is positive the earth warms if negative the earth cools.
Cloud reduction effects GW by reducing the amount of highly reflective clouds covering the earth and letting in more sun light to warm the earth, Cloud Reduction Global Warming, CRGW.
Is Cloud Cover Changing?
Yes, Cloud cover changes with seasons, hemisphere, altitude, and over time. Figure 3 shows the satellite data for cloud cover for the whole earth vs time (about 36 years). The sine-al nature of the graph is a seasonal variation shown in Figure 4. Figure 5 shows the hemispherical differences in cloud cover. The hemispherical and seasonal variation in cloud cover is related to the tilt of the axis (23.5’ north) of the rotating earth favoring the northern hemisphere with more sun light and the larger land mass of the northern hemisphere (Total land mass of the earth is 39% of that 68% is in the northern hemisphere and 32% in the southern hemisphere). It will be later shown that, these variables change the relative humidity which are responsible for the sine-al nature of the cloud cover.
For global warming the change in cloud cover over years is the variable of interest. The whole earth’s cloud cover (least squares fit from “climate Explorer” data) vs time in Figure 5 show a 0.075 % cloud change/year. Note the high degree of variability in Figure 5, some of this variability is theorized by Dübal and Vahrenholt, (2) to be due to the AMO (Atlantic Multi-decadal Oscillation) in the northern hemisphere which is a natural oscillation in ocean temperature with a period of 60-80 year and an amplitude of +/-0.2’C. (a period up swing of the AMO occurred in the 1985 to 2020 range and could be related to the peak in 1997 and flatting after 2000 in Figure 5). There is also a periodic swing in ocean temperature in the Pacific, PDO (Pacific Decadal Oscillation) in the southern hemisphere (commonly known as El Nino) with a period similar to the AMO of 60-80 years and a smaller amplitude of about +/- 0.1’C. The amplitude of each of these oscillations is smaller than the overall change in temperature and are not increasing over time. The periods of AMO and PDO seem to be opposite and may have some canceling effect on a global basis. Further explanation of these oscillations are best left up to the experts, in this paper, they are just potential noise makers to the cloud reduction data and emphasize the importance of long term data (the 36 years of cloud data may not be enough). The 36 year cloud cover decrease of 0.75% per decade will be used in calculations of cloud effected energy changes.
One more variable that needs to be considered in temperature vs cloud cover: Time delay, when clouds decrease part of the sun light fall on land and the rest on water. Land gives its energy back to the atmosphere quickly (over days), over water the energy is stored for years. Some have calculated up to 80 years for a step change in energy into the ocean to come the full equilibrium (20) and (21). This time delay is another reason to use long term slope date to analyze cloud change data. Our current 36 years of cloud data is probably not enough to complete our understanding of cloud cover and GW. It should be noted that surface sea temperature, SST, follows air temperature closely, questioning the significance of the time delay.
Cloud Cover Change vs Temperature Change
An empirical way to relating cloud cover to temperature is to divide the least squares fits of the temperature change by cloud reduction change over the 36 years of data. Figure 6 shows both least squares fits with the result of the ratio being -0.27 ‘C/% cloud change. “Climate and Clouds”(5) scatter plot of monthly temperature and cloud cover of the same data showed a least squares fit of -0.066 ‘C/% cloud cover; further emphasizing the need to use long term data to better understand cloud and temperature relationships. [“Climate4You” (5) web site is a product of ISCCP: (“Since July 1983, ongoing variations in the global cloud cover have been monitored by The International Sattelite Cloud Climatology Project (ISCCP). This project was established as part of the World Climate Research Program (WCRP) to collect weather satellite radiance measurements …”.) ] The “Climate4You” ratio only accounts for 25% of the observed ( 0.4 ‘C) 20 years of CERES data. Figure 6’s -0.27 ‘C/% cloud cover accounts for all of the observed temperature change.
Although significant, this ratio of temperature and cloud cover change is not the best way to prove the significance of cloud cover change. The CERES data is energy data, cloud cover change must be related to CERES energy observations. Table 1 converts the observed albedo from Dübal (2) to energy change (Short Wave, SW, in – SW out at Top Of the Atmosphere, TOA) and is shown in Figure 7. Table 2 uses the cloud cover from “Climate Explorer” least squares fit in Figure 5 and the Dübal “cloudy area” and “clear sky” albedo data to calculate the energy to the earth, the results are shown in Figure 7. The comparison of the two calculation is close enough to claim: the cloud cover change can account for all the temperate change and energy change observed in the 20 years of CERES data.
(Note: in Table 2 Dübal observed a small (but significant) change in the “Clear sky” albedo (decreasing). The “clear sky” albedo is the ground (land + ocean) color of the earth. Holding the cloud change constant shows this small albedo “clear sky” albedo change can account for 15% of the observed energy in the 20 years of CERES data. Cloud change is the major effect on GW)
Why a 1975 Zero for the CERES data?
Many researchers have noticed that the temperature vs time curve since 1880 is not linear, the data better fits an exponential or 2ed degree polynomial. One can also use two linear equations to fit the data, as shown in Figure 8. The intersection of the two lines is about 1975. The lower line has a poor R^2 and accounts for about 25% of the temperature rise. The second line has a much higher R^2 and account for about 75% of the rise. We have a lot more data in the 1975 to 2020 range so we should have a better chance of explaining GW in that range.
The extrapolated data and 20 years of CERES data in Figure 7 are overlayed on Figure 8 – a good fit. Table 1 and 2 show that albedo change and cloud cover change from 2001 to 2020 and from 1975 to 2020 can account for all the temperature change in each period. CRGW is a valid theory and should be considered by the IPCC.
How did this significant change in scientific understanding occur?
The 2021 papers by Dübal, Loeb, and Goode (and some others) verifying a 20-year change in the earth’s albedo is like a scientific “Black Swan Event” **. The earth’s albedo and cloud cover changing over time was totally unexpected (“all swans are white”). Albedo change being caused by cloud cover reduction was also unexpected prior to 2021. All previous methods of measuring albedo and cloud cover showed no change. There were modelers like Walcek (7) who predicted that if cloud cover changed it could be as significant as the predicted greenhouse gas GW. The effect of greenhouse gases could be measured in the lower atmosphere and was known to be saturated (all ready enough, more would not change GW). The IPCC needed a theory that could account for the observed GW with constant albedo and cloud cover – That theory was Radiative Forcing, RF. RF is a plausible theory but needed to be measured in the upper atmosphere. NASA sent up satellites to measure the RF (along with many other thing). NASA’s satellites changed the method of measurement and the accuracy and with 20 years of data could see the small differences in big numbers needed. And here we are today trying to get the IPCC to look at the “Black Swan”.
Models are also a contributing factor. There are climate models that use scientific laws and math (like IPCC’s Global Circulation Models, GMC’s) to calculate GW and like the simple models in Tables 1 and 2. Other models use statistical multi variable analysis, SMVA, to predict GW. The use of SMVAs can lead to some inaccurate conclusions. Good multi variable analysis design an experimental grid to avoid confounded variables, it is difficult to do this with natural data. In the case of GW, Cloud cover, relative humidity, albedo, specific humidity, CO2, and other GHGs are all confounded with the earth’s temperature change. Variables with high accuracy in measurement and definite trends, like CO2, will dominate in SMVAs, even if they have nothing to do with GW. Variables with poor measurement but good trends (but are the real effect on GW), like cloud cover, will show significance in SMVA’s but not eliminate variables like CO2. Results from a SMVA are not a proof. The IPCC’s SMVA model has a “dog’s breakfast” of variables in its AR6 model of GW, in AR6 cloud cover is not listed, but cloud density is, as a global cooling variable. In all fairness, AR6 was issued in 2021 the same time at the Dübal and Loeb papers – they may be looking at them now.
What is causing the reduction in Cloud Cover?
Cloud cover is part of the earth’s water cycle: the sun’s energy evaporates water, the water vapor makes clouds, and clouds make rain. We are looking for a disturbance in this natural cycle
The water cycle variables that are a signature of cloud cover change:
Long term Signature of Cloud Cover Reduction
1. Temperature increasing (less cloud cover – more sun’s energy to the earth, see Figure 8)
2. Specific Humidity increasing (a result of higher temperature and more evaporation the atmosphere can holding more water, see Figure 9)
3. Rain fall increasing (more energy in evaporates more water, (if not used for specific humidity increase) the water got to come back down. A statistical increase has been observed but very low R^2 – graph not shown)
4. Relative humidity decreasing (main effect on less clouds which leads to the other atmospheric variables, see Figure 10 and Figure 12)
This is a unique set of atmospheric variables only associated with cloud reduction.
Relative Humidity and Cloud Reduction
Relative Humidity, RH, has for a long time been associated with clouds. Figure 11 show a page from Walcek (7) 1995 report which show the decline in cloud cover vs RH observed by him and other researchers. The trend is there but the noise level is high. Satellites have improved the observation. “Climate and Clouds”(5) shows that different types of clouds form at different levels and that their formation may be triggered by things other than RH. Particulates (aerosols) and cosmic rays have been documented as sources of cloud formation. Even at 100% RH air can become super saturated and not form clouds. All the variables are probably responsible for the noise in Figure 11; but the general trend is RH. Of the three categories of clouds mentioned in “Climate and Clouds”(5) The only one that showed a significant reduction over time was the “Low Level” clouds, cumulus clouds. Cumulus clouds are about 28% of the total 63% cloud cover of the earth. The other clouds only create noise in the total cloud cover data. In “International Satellite Cloud Climatology Project” (8) Cumulus clouds were the only cloud types of nine types of clouds that showed reduction over time, see Figure 13.
Cumulus clouds are the ones most affected by changes in RH from the earth surface in that they are the ones in contact with low RH air first. The data in Figures 4, 5, and 6 contain all cloud types, but the yearly oscillations are related to similar changes in “low level” clouds and RH with time. These oscillations can be used to make a plot of RH vs cloud cover for all the monthly data in Figure 3 to produce the scatter plot in Figure 14. The data points used in the model in Table 2 are in red. Note that these points are within the range of the natural variation of the data.
The data in Figure 14 can be broken down into more detail to show the difference in monthly profiles between Northern Hemisphere (NH), Sothern Hemisphere and Time shift, see Figure 15. Note the expected difference in shape of the NH and SH plots, in some months they cancel each other and in other complement each other giving the overall results in Figure 4. In Figure 15 the cloud change in the Southern Hemisphere is greater than in the NH and the Sothern Hemisphere somewhat dominates the overall cloud change. All the plots shift with time as the relativity humidity decreases.
The Missing Energy in the Earth’s EEI, Eq 1
The missing energy in Figure 1 can go to the following paces see Table 7 for details:
· Warm the dry air in the atmosphere. (Small but significant)
· increase the moisture in the atmosphere and is the major use of EEI energy (specific humidity, Figure 9 and Table 7)
· increase precipitation (small)
· warm the land (small)
· warm the oceans (small, with a time delay)
The bulk of the energy goes into water increase in the atmosphere.
The Dübal and Loeb data can be used to estimate a degrees Celsius / W/m^2 energy change from short wave energy change of 0.3 ‘C per W/m^2.
Conclusion So Far
There is no doubt that albedo of the earth has changed over the last 20 years (and longer) and that this albedo change is due to cloud cover reduction (and a little “clear sky” albedo change). The cloud cover reduction is related to relative humidity reduction. Relative humidity reduction has been going since 1948 (possible longer). The cloud reduction data (starting in 1984) has been extrapolated back to 1975. Cloud reduction has been around for a while. CO2 is innocent but cloud cover reduction is guilty. Leaving the question:
Part II. Cloud reduction effects GW but ‘Man” is still Guilty.
What is affecting the Relative Humidity reduction?
The observation of relative humidity decreasing (see Figure 10 and 12) has long puzzled climate scientist. Most climate models show specific humidity increasing (which it does) and relative humidity staying the same. Papers by J. Taylor (9) and K. Willett (10) both express that increasing SH and decreasing RH is inconsistent with CO2 (and other GHGs) effect on GW with no explanation as to why. This paper gives an explanation.
The theory Cloud Reduction Global Warming, CRGW, has been proposed (1): “Man’s changes to land use effects the production of low relative humidity, RH, hot air rising to where clouds could be prevented (or destroyed) thus reducing the albedo of the earth”. This reduction in RH is triggered by a localized reduction (not an increase) in Specific Humidity, SH. This reduction in SH is occurring only on land and is over whelmed by the increase in SH from evaporation (from oceans) due to the lower Cloud Cover, CC. The relationship between SH, RH, and CC has a very large natural amplification factor.
The key to CRGW is water evaporation, transpiration, or run off on land. When water (rain or snow) falls on the land it can soak into the ground or run off. On land when ground water is not available the relative humidity drops. In any man-made structure that covers the virgin land prevents water from soaking in and increases the Run Off, RO. When water is not available for Evaporation or Transpiration, ET, the relative humidity drops. (ET is sometimes called Evapotranspiration.) Some man-made effects (anthropological global warming, AGW) sources of relative humidity reduction are:
· Cities
· Any man-made structure that covers the natural ground
· Forest to farm land or pasture land
· Pumping water from aquifers
· Forest fire land change.
· Flood water prevention like dams and levees.
· I am sure there are others
Figure 13 shows a very good depiction of the water cycle on earth. Of interest to the CRGW theory is the land part showing rain fall, evaporation, transpiration, and run off, RO. Note that the rain fall is the sum of the evaporation, transpiration, and run off. The evaporation is from water that has soaked in to the ground. Transpiration is water that evaporates through any kind of vegetation, trees have the highest. In the land water balance if any one of these changes it effects the others. An example: if the virgin land is cover with asphalt or concrete that prevents water from soaking in to the ground where vegetation can evaporate the water then the water will run off and the ET will decrease. Another example: If a forest is replaced with farm land or pasture the forest’s ground cover no longer holds water. The crops that replaced the forest are only growing part of the year and do not have the leaf area as the tree’s many leaves and deep roots, all this decrease the ET. A decreasing ET increases the Run Off, RO. This change in ET sets in motion a series of events on land where ET has been restricted:
1. RO increase making ET decrease, this lowers the local specific humidity, SH (SH % change is another measure of ET % change). The land-based change in RH vs SH is shown in Figure 17, showing a 21:1 ratio. Table 6 adjusts this relationship for the whole earth, down to 6.2 : 1.
2. As the ET decrease, this creates low relativity humidity, RH, air with SH change equal to the change in -RO(%) and +ET(%). In this step the RH and SH both decease. Note at this point the local SH decrease is opposite the observed global increase.
3. As the low humidity air rises (to where clouds form) the relative humidity, RH, drops even further. Another amplification occurs, 4.58 : 1, Figure 10 slope ratios, SH 850mb/SH 1000 mb..
4. The low RH air spreads around the world (mainly off shore) and reduces cloud cover, CC, this process has the smallest of amplifications, 1.2 : 1, In Table 3 dif. CC/dif. RH 850mb.
5. Less CC lets more sun’s radiation in. Table 6 shows the product of all these amplifications to be 34:1 change in CC per change in SH through this series steps of RH changes.
6. More radiation warms all earth’s surfaces. On land more radiation makes the relative humidity even lower.
7. On the oceans the radiation increase warms the water and evaporates more water increasing the global specific humidity, SH. This increase is greater than the local land decrease in SH resulting in the observed increase in SH.
8. The result is the rising SH and dropping RH. The localized short term ET effects are not seen on a yearly basis. (Figure 1 in (1) shows city examples)
This list of events is better seen by Figure 18. Figure 18 is a blowup of a small part of a Psychrometric Chart, PC, that best describes the earth’s atmosphere. Table 3 is a list of all the least squares fit data (from Figures in this paper) that are used to show the CRGW theory is valid. Table 4 puts this data in to a “Free on Line PC “, (11) to test the fit of actual 1975 and 2020 data to calculated data from (11). The low difference in Table 4 shows a good fit. The “Free on-Line Psychrometric Chart” is a good calculator for atmospheric changes.
Estimating ET changes
ET is somewhat like cloud cover; It varies a lot from season to season, hemisphere to hemisphere, and with land mass. What we are looking for is small changes over time (smaller than the cloud changes – remember the amplification factor).
The easiest to explain change is ET is Cities or better known as Urban Heat Islands, UHI’s, UHI’s got their reputation as heat island due the higher temperature from lower albedo and lower water, SH. The effect on RH was not appreciated until this paper and the previous paper. UHI’s temperature, SH, and RH behavior is predicted by a PC in (1). The UHI’s change in ET is related to run off, RO, increasing, (if precipitation cannot soak into the ground, it runs off and is not available for ET). The earths land surface is covered by 3% urban development, and about half of the population lives there. The structure that the other half lives in also covers the earth with roof tops and drive ways that do not allow water to soak in and also increasing the RO. That gives 6% of the earths land mass having an effect on the RO and ET. The amount of RO change for UHI’s is hard to find data on but a lab experiment by U of Colorado College of Eng. (16) shows a 20%-30% increase in RO. Table 5 uses 6% of land coverage and 25% change in RO.
RO changes from land use changes are also hard to find. One of the best reports on land change from satellite data is by Winkler K. et al (16) with data claiming 32% of the land has been changed by man. Most changes were virgin land to crop or pasture, some was reclaimed pasture back to forest. Run Off in the Mississippi river basin computer simulations is documented by Tracy E. et al (18) showing a range of RO from +45% to -25% depending on what was being converted to what. McMenemie C. (19) paper singles out damming rivers and putting in levies to prevent flooding to have a significant effect on ET.
Depleting aquifers effects the water table to lower and reduce the water available for ET thus making more low RH air. Most ground water from aquifers is recycled back as recharge yet the earths aquifers are decreasing. According to the web “Typically, 10 to 20 percent of the precipitation that falls to the Earth enters water-bearing strata, which are known as aquifers.” The 10 to 20 percent may not be shown accurately in Figure 16 (it is possible it is part of the RO). No data could be found on the total earth effect of lower ground water on ET or RH – it should not be insignificant.
The study of ET is a relatively new monitoring field. Most paper on the subject at less than 10 years of data and the emphasis of the studies are usually water management or carbon sequestration very little atmospheric specific humidity or relative humidity data is reported. Some satellite data is just started (< 5 yrs). The results of current papers are not consistent. Some examples: BaolinXue et al (23) shows no change in 20 years from rural land-based stations in the FLUXNET dataset (as expected on non-land change areas and not urban data). Samuel Zipper et al (24) have a short (4 year) but very good study of Madison Wi USA UHI showing a 5%/year drop in ET in a 20 km^2 radius of Madison central (not a statistically significant time). Qingzhou Zheng et al (25) study of a whole water shed (110 km^2) in China that included forest, crop-land, baron land, rivers, wetlands, and cities showed a 7% reduction in ET in 13 years, with the main factor being urban expansion.
This paper will use estimates of land change RO that is in the range of the publish data as shown in Table 5, 30% land coverage and 10% RO change. The man-made structure RO (% of global) added to the RO (% of global) totals 1.3% (% of global) (or -ET% change). It is not the intension of this paper to be an expert on ET change only to show this change can account for all the GW at 1.3% (% of global) from 1975 to 2020.
Explanation of Figure 18 model of the Path taken by the 1975 to 2020 climate change.
Figure 18 is a very blown-up Psychrometric Chart showing the chain of effects (the path) to the final 1975 to 2020 observed climate change. The parallel energy (all atmospheric changes occur at constant energy or a shift in energy) lines are established from the observed 1975 and 2020 data of 33.54 kJ/kg(da) for 1975 and 35.72 kJ/kg(da) 2020. The starting point is the 1975 SH at 7.7 g/kg(da) on the 33.54 kj/kg(da) energy line. The ET change of -1.3% (above) is about -0.1 SH change shown at 7.6 g/kg(da) in the Figure 18 model. The 34:1 natural amplification of this SH change (through RH changes) results in the CC reduction (see Table 6) and the energy shift to the 2020 parallel energy line of 35.72 kJ/kg(da). The hot low RH air evaporates water (increase SH), cools the air and increases the RH to the 2020 end point. This technique of tracing an energy, temp, SH, and RH path is standard in engineering heating cooling design.
Conclusions on the Effects of Relative Humidity Reduction Over Time.
The high sensitivity of SH to RH to CC is a natural phenomenon. The CC variation in Figure 3 is natural (effected by tilt of the earth and larger land mass in the NH) tracked by RH and SH. These natural CC variations are greater than the CC reduction observed. The natural laws used in the Psychrometric Chart show the high sensitivity of RH to SH. Using an estimate of RO in the range of publish data shows a good fit to observed data. This explains the rising SH and decreasing RH.
The modelers of the 1990’s where on the right track – if clouds change the results would be as strong as the that expected from CO2. The IPCC should evaluate CRGW theory.
Figures and Tables
Figure 1, Graph of what Dübal and Loeb both observed (all energy is TOA).
Figure 2, Graph of what was expected in the 20 years of CERES data based on IPCC Radiative Forcing theory of greenhouse gases.
Figure 3, Cloud Cover over 45 years from “Climate and Clouds”(5) shows the seasonal and time reduction in global cloud cover.
Figure 4, Breaking down Figure 3 data by average/month shows a low in cloud cover in the summer month (NH) and a high in the winter months (NH) due to larger land mass and axis tilt in NH vs SH. Later Figures shows the hemispherical contribution to this Figure. Relative Humidity from “NOAA Physical Science Laboratory” was added to show the good fit.
Figure 5, From “Climate Explorer” (6). Showing the difference in hemispherical cloud cover due to northern hemisphere getting more sun than the southern hemisphere. All data is 3 year smoothed.
Figure 6, Combine satellite data for cloud cover and temperature on graph to get a -0.27 ‘C/% cloud cover ratio. All data is 3 year smoothed.
Figure 7, Observed from Albedo change and Calculated from Cloud Cover Change in the 20 years of CERES data. A very good match.
Table 1, Albedo Change Model from Dubal (2) data. Extrapolation to 1975.
Table 2, Calculated energy change using Cloud change data from “Climate Explorer” and Dübal data for “cloudy area” albedo and “clear sky” albedo.
Figure 8, Dividing Temperature vs Time into two parts and overlaying SW energy change from albedo and clouds. Good fit to 1975 to 2020 data. All data is 3 year smoothed.
Figure 8a, 1975 to 2020 part of Figure 8 with actual data, least squares fit used for calculation. All data is 3 year smoothed
Figure 9, Specific Humidity vs time, note the break point at 1975. All data is 3 year smoothed
Figure 10, Relative Humidity vs year for ground level and cloud level. Cloud level RH much more sensitive than ground level RH. Cloud level RH will be used.
Figure 11 Copy of page from Walcek (7) showing the 1995 correlation of clouds and RH.
Figure 12, Relative Humidity at 850 mb (cloud level) vs time. Note difference between NH and SH. Good correlation, RH has been changing for a long time.
Figure 13, “International Satellite Cloud Climatology Project” (8) of just Cumulus cloud cover over 27 years. Cumulus clouds were the only ones changing of 9 cloud types studied.
Figure 14, Scatter plot of all the monthly data in Figure 3 and 12 to obtain a correlation between RH and Cloud Cover. Red dots are data used in the Model in Table 2.
Figure 15, Monthly plot of cloud cover in both northern hemisphere and southern hemisphere.
Figure 16. A good diagram of the water cycle on earth from Trenberth et al (13).
Figure 17. Relative Humidity vs Specific Humidity the average slopes, 21, will be used in Table 6 to show the natural change in RH/SH.
Figure 18, Path of energy and Specific Humidity, SH, change that accounts for the observed 1975 to 2020 change.
6. Climate Explorer web site Climate Explorer: Select a monthly field (knmi.nl) go to “Cloud Cover” click “EUMETSAT CM-SAF 0.25° cloud fraction” click “select field” at top of page on next page enter latitude (-90 to 90) and longitude (-180 to 180) for whole earth.
20.“How to Heat a Planet? Impact of Anthropogenic Landscapes on Earth’s Albedo and Temperature Mark Healey Lindfield”, Web file: www.scirp.org/pdf/ijg_2020062914563820.pdf
The article has links to both his presentation and to the slides. It has hard to see the slides in the presentation.
By Andy May
Dr. Willie Soon gave a great presentation at the Federalist Society Chapter at the University of Chicago Law School on November 18, 2022. The title of his talk is:
“The Corruption of Environmental Rulemakings at the US EPA: Climate Change, Mercury Emissions, and Air Quality”Willie Soon, 2022
Dr. Soon’s slide deck is excellent reading and he has kindly sent it to me, you can download it here. If you prefer to watch his presentation, you can do so on YouTube here. Soon’s presentation starts about 22:46 minutes into the video.
Soon’s key points:
Given the daily, seasonal, and annual range of temperatures around the Earth, the warming of the past 125 years is trivial.
Except for ENSO variations, the global average surface temperature has hardly changed in over 20 years.
Willie humorously dismantles the article on him in Wikipedia and Gavin Schmidt’s criticisms, these slides are worth the download!
Willie plugs the article he wrote with 23 co-authors entitled: “How much has the Sun influenced Northern Hemisphere Temperature trends? An ongoing debate.” Seriously, this is probably the best climate change article written in the last thirty years in my humble opinion, I refer to it all the time. The bibliography alone is worth it. If you never read another climate article in your life, you should read this one. Download it here.
He destroys the Mercury pollution nonsense that is permeating the media. Possible spoiler, don’t drink Coca Cola!
Is it air pollution or weather?
Finally, President Dwight Eisenhower’s warning about “public policy [becoming] the captive of a scientific-technological elite” was correct:
“It is time to face a hard truth: the seventy-year experiment to federalize the sciences has been a failure. The task now is to prevent the Big Science cartel from further dehumanizing society and delegitimizing science. There is a second hard truth: the necessary reforms will not come from within. Rather, it will be the people and their representatives that will have to impose them. To restore science to its rightful and valuable place, break up the Big Science cartel.”(J. Scott Turner, Professor of Biology (emeritus), SUNY College of Environmental Science and Forestry, December 10, 2021)
Are you ready for the government to monitor what you buy and sell on a daily basis? Because that is what could happen if you start using the new “digital dollar” that they are now testing. Of course using the new “digital dollar” would be voluntary at first, but what if it eventually becomes mandatory? The use of physical currency continues to decline year after year, and some governments in Europe have already taken radical measures to phase out the use of cash. Many among the elite consider digital currencies to be the key to a whole new era of strict governmental control over the way that we live our lives, and there would be so much potential for abuse.
On Tuesday, an extremely ambitious 12 week test of the “digital dollar” was publicly announced. As you can see, some of the biggest companies in the financial world are participating…
Global banking giants are starting a 12-week digital dollar pilot with the Federal Reserve Bank of New York, the participants announced on Tuesday.
Citigroup Inc, HSBC Holdings Plc, Mastercard Inc and Wells Fargo & Co are among the financial companies participating in the experiment alongside the New York Fed’s innovation center, they said in a statement. The project, which is called the regulated liability network, will be conducted in a test environment and use simulated data, the New York Fed said.
When asked about his firm’s participation in the project, a Citigroup executive sounded very enthusiastic…
“Programmable US dollars may be necessary to support new business models and provide a foundation to much-needed innovations in financial settlements and infrastructure,” Tony McLaughlin, managing director for emerging payments and business development at Citigroup’s treasury and trade solutions division, said in a statement. “Projects like this, that focus on the digitization of central bank money and individual bank deposits, could be expanded to take a broader view of the opportunity.”
This is something that the Federal Reserve has been working on for a long time.
Don’t eat crickets when food shortages really start hitting in America. Eat organic, freeze-dried, sous vide chicken that you can store for a decade or two if necessary. FLASH SALE happening now at Prepper Organics, $50 off with promo code “survive2030“.
Back in January, the Fed released a “much-anticipated discussion paper” on the possibility of a “digital dollar”, and they invited the public to comment on the paper for four months…
In January, the Fed took a first step toward weighing the use of a central bank digital currency when it released its much-anticipated discussion paper and opened a four-month public comment period to receive input.
The paper said that a CBDC could streamline cross-border payments and could further enshrine and preserve the dominance of the dollar’s international role, including as the world’s reserve currency.
Obviously the Fed did not meet with too much resistance during that stage, and so now they are moving on to fully testing the “digital dollar” that they have come up with.
The fact that they are going to spend an enormous amount of time, money and energy testing this new “digital dollar” strongly indicates that they already have plans to introduce it.
The “digital dollar” would be very similar to Bitcoin and other popular cryptocurrencies.
But instead of a decentralized system, the government would control the currency and would have the ability to track every single transaction.
And as Michael Maharrey of Schiff Gold has noted, there would even be the potential for the government to “turn off” the ability of certain individuals to make purchases…
Imagine if there was no cash. It would be impossible to hide even the smallest transaction from government eyes. Something as simple as your morning trip to Starbucks wouldn’t be a secret from government officials. As Bloomberg put it in an article published when China launched its digital yuan pilot program, digital currency “offers China’s authorities a degree of control never possible with physical money.”
The government could even “turn off” an individual’s ability to make purchases.
We don’t want the government to have that much power over our lives.
Thankfully, some members of Congress are sounding the alarm. In fact, Senator James Lankford has actually introduced a bill “which would require the U.S. Treasury to keep printing and coining money if the government issues an official digital currency”…
On September 29, Republican Senator James Lankford introduced the No Digital Dollar Act, which would require the U.S. Treasury to keep printing and coining money if the government issues an official digital currency.
Lankford said in a news release: “While some Oklahomans are open to digital currencies, many still prefer hard currency or at least the option of hard currency. There are still questions, cyber concerns, and security risks for digital money. There is no reason we can’t continue to have paper and digital money in our nation and allow the American people to decide how to carry and spend their own money. As technology advances, Americans should not have to worry about every transaction in their financial life being tracked or their money being deleted.”
Unfortunately, that sort of a bill is extremely unlikely to get through Congress.
Most of our leaders seem quite eager to explore the “possibilities” of implementing such a system.
And as we have seen over the past few years, those with authoritarian tendencies are not afraid to push the envelope to frightening extremes.
In an article for MaineWire, Steve Robinson listed several hypothetical scenarios that we could potentially see if a “digital dollar” starts being used on a widespread basis…
1.) To protest governmental limits on personal freedom, liberty activists stage a peaceful protest around the nation’s capital. That nation’s leader, wanting to quell the protest and protect his power, instructs his Minister of Economic Control to reduce the protesters’ CBDC balances by 50 percent everyday until the protest ends. The protest ends shortly after the message pings on the CBDC smartphone app.
2.) Economic growth is lagging, and the economists in the federal government suspect it is because consumer spending isn’t strong enough. People are saving their money, rather than spending it. To fix this problem, the Ministry of Economic Control announces a new year-long negative interest rate for all CBDC accounts. Unspent balances of CBDC will be reduced by 10 percent every month. As a result, no one saves, every one spends, and the economists have saved the economy.
3.) You’re at the grocery store picking up some ribeye steaks because some friends are coming over for a barbecue. When you get up to the counter, there’s a problem. The cashier says the payment isn’t going through. You check the CBDC app on your smartphone. There is an alert: “You have exceeded your monthly carbon credit usage; please remove the following items from your grocery cart in order to proceed…”
4.) You want to pick up a new firearm for hunting season, so you swing by the local sporting goods store. But when you go to transfer CBDC credits for the purchase, you’re denied. The trusty CBDC app explains: “We’ve detected activity on your social media accounts that suggests you are at risk of causing harm to yourself or others. You are prohibited from purchasing a firearm for one year.”
I have published thousands of articles on The Economic Collapse Blog, End Of The American Dream and The Most Important News, and the articles that I publish on those sites are republished on dozens of other prominent websites all over the globe. I always freely and happily allow others to republish my articles on their own websites, but I also ask that they include this “About the Author” section with each article. The material contained in this article is for general information purposes only, and readers should consult licensed professionals before making any legal, business, financial or health decisions.
I encourage you to follow me on social media on Facebook and Twitter, and any way that you can share these articles with others is definitely a great help. These are such troubled times, and people need hope. John 3:16 tells us about the hope that God has given us through Jesus Christ: “For God so loved the world, that he gave his only begotten Son, that whosoever believeth in him should not perish, but have everlasting life.” If you have not already done so, I strongly urge you to invite Jesus Christ to be your Lord and Savior today.
We Can See The Phantoms! Get Them Off The Voter Rolls!
Guest post by Jay Valentine
Republicans, always late to how their voters are marginalized, now exclaim “we get it!”
“Let’s place mail-in ballot boxes at gun shows, churches and Kiwanis breakfasts.”
This is electioneering theater.
Our Leftist pals respond with two strategies: they monitor the election apparatus in every district – knowing how many ballots they need. They use their phantom ballot inventory for the votes to cover any Republican votes gathered at that gun show.
Republicans don’t monitor the election apparatus. They are too honest to do it. Where Democrats are happy to do it.
We are left with the Republicans’ new strategy encouraging voters to vote early via mail-in ballots. The Democrats vote early too, they also have a slush bucket of around 4% – 6% of the ballots, ready when needed.
With 4% to 6%, perhaps as high as 15% of voter rolls with fake names, 1900-year-old voters, undeliverable addresses, people who moved out of state yet still vote, apartment buildings under construction housing scores of registered voters, jails and hotels with registered voters, Air B&Bs, U.P.S. boxes crowded with phantoms – it comes in pretty handy in a tight race.
Here’s how it’s done.
Go to a homeless shelter, the Salvation Army or the Lefty church soup kitchen. Register less fortunate neighbors, perhaps with a gift card. Fill in their form, they just need to sign. 100 fellow citizens now get mail-in ballots – every election!
Need more? Hit those colleges.
Register students.
When submitting registrations, leave out their box number.
You created an inventory of floating ballots which, when shipped to the university dorm are undeliverable. The kids may not vote but, who cares, vote them yourself. You have ballots, who cares about voters?
Wait you say! Those ballots are returned to the Post Office!
Perhaps. But if you are a clever entrepreneur, knowing someone will pay you $25 for every ballot, you hang around the mail room. What do you think happens to those ballots?
Do you think the Republican Kiwanis guy in Dockers is there with gift cards for every floating ballot? Probably not. Who gets them? Guess!
With almost no effort, bad guys create thousands of floating ballots – which will never be voted by their applicant. And this is only part of one county! These “identities” are around to vote every year – in every election.
It gets much easier.
Run a report against the state voter roll: “show all registered, active voters who never voted before 2022!” We explain this at www.Omega4America.com.
These are real people, usually. They just aren’t into civics. Track them via the state’s voter registration system during early voting. They probably won’t vote, so start slowly adding a few votes from your ballot inventory as you need them.
If they show up at the polls, no problem.
Advertisement – story continues below
Tell them “sorry there Jimbo you already voted!” They may complain.
Give them a provisional ballot, then toss it in Bin 16. When the cameras are turned off – do you notice they always seem to get turned off? – those ballots get recycled. Not counted!
Never be greedy. Win by a fraction of a percentage – enough so Fox News won’t let Tucker Carlson question obvious voter fraud.
It’s important to control the clock – like in a football game. Sometimes things get out of whack as when that Trump guy ran. He flooded the system with ballots beyond expectation.
Stop the clock!
Tell everyone to chill! Shut the place down and don’t be rushed by citizens demanding to know who won. Who cares? They don’t count. You count! Or one should say – “you are counting, thus you count.”
Take your time, like a week, maybe two, bring in extra ballots if needed. Tie them to that guy who did not vote. Remember that batch from the shelter – they’re good for 50 or more votes. Add them as you need them, always tying them to a person somewhere on the voter list – a phantom.
Hapless Republicans set up mail ballot boxes at gun shows but the bad guys have an inventory of ballots they control – it makes electioneering so much simpler. 4% – 6%. Every state!
See, anyone can do it! And they do. For 40 years.
This is electioneering, and the Leftists own it. Putting mail in boxes at the Kiwanis breakfast is theater, not strategy. It’s RNC-speak for “fighting back.”
Republicans may not control that ballot inventory, but now they can see the phantoms that are tied to every one of those ballots – with technology.
If you can identify them, you can force them to be removed. Here’s how:
Take every voter registration roll from every state and ingest the property tax database for every county – they’re on-line already.
You instantly know with 100% fidelity, every address that is a business, vacant land, a multi-family unit, rental property, single family home.
You know the number of square feet and number of baths. Who cares?
When you do “density analysis” showing an 870 square foot house, with 18 voters claiming to live in it in Harris County, Texas, with one bath, you challenge the certificate of occupancy. Wow, Republicans would never think of that!
You can ID that apartment building in Georgia, under construction with 25 registered voters in it – and doesn’t have a roof yet!
When the local judge tosses your affidavits, as he did, with the photo of the unbuilt building with live voters registered in it, grab a crowd and a bullhorn, stand near the cement mixers and make a scene.
Think what happens when 10,000 Americans do this at scale in 8 swing states on the same day!
Fractal technology, operating 1,000 to a million times faster than any current technology means you can tie every address to every voter from a phone – instantly. When your Lefty pals question you, it’s their county tax records and county voter registration records showing 120 people living at a convenience store.
Total visibility to voter rolls means you can take action.
People, we are in a political streetfight to save America.
Our Fractal Programming team is delivering disruptive technology in 15 – 20 states and voter integrity teams find phantoms by the cargo vessel load.
People file affidavits, judges toss them, Kari Lake gets screwed.
We know who they are! We can show phantoms on your phone!
The question for the Republicans is – do you want to have a drop box at the church or do you want to measure every voter against every property tax record and when you find clearly fake people living in a construction site – you show up with a bullhorn?
If you choose the former, you choose to lose.
Perhaps it’s time for the bullhorn!
Jay Valentine can be reached at Jay@ContingencySales.com. The Fractal Election website is www.Omega4America.com. The Fractal team runs the voter registration data for 15-20 states for voter integrity teams.
Joe Hoft is the twin brother of TGP’s founder, Jim Hoft, and a contributing editor at TGP. Joe’s reporting is often months ahead of the Mainstream media as was observed in his reporting on the Mueller sham investigation, the origins of COVID-19, and 2020 Election fraud. Joe was a corporate executive in Hong Kong for a decade and has years of experience in finance, IT, operations, and auditing around the world. The knowledge gained in his career gives him a unique perspective of current events in the US and globally. Joe is the author of five books. His new bestseller, ‘The Steal: Volume II – The Impossible Occurs’ is out now. It addresses the stolen 2020 Election and provides an inventory of activities that prove the 2020 Election never should have been certified for Joe Biden. It’s available at major retailers now – Please take a look and buy a copy.
I have created this site to help people have fun in the kitchen. I write about enjoying life both in and out of my kitchen. Life is short! Make the most of it and enjoy!
This is a library of News Events not reported by the Main Stream Media documenting & connecting the dots on How the Obama Marxist Liberal agenda is destroying America

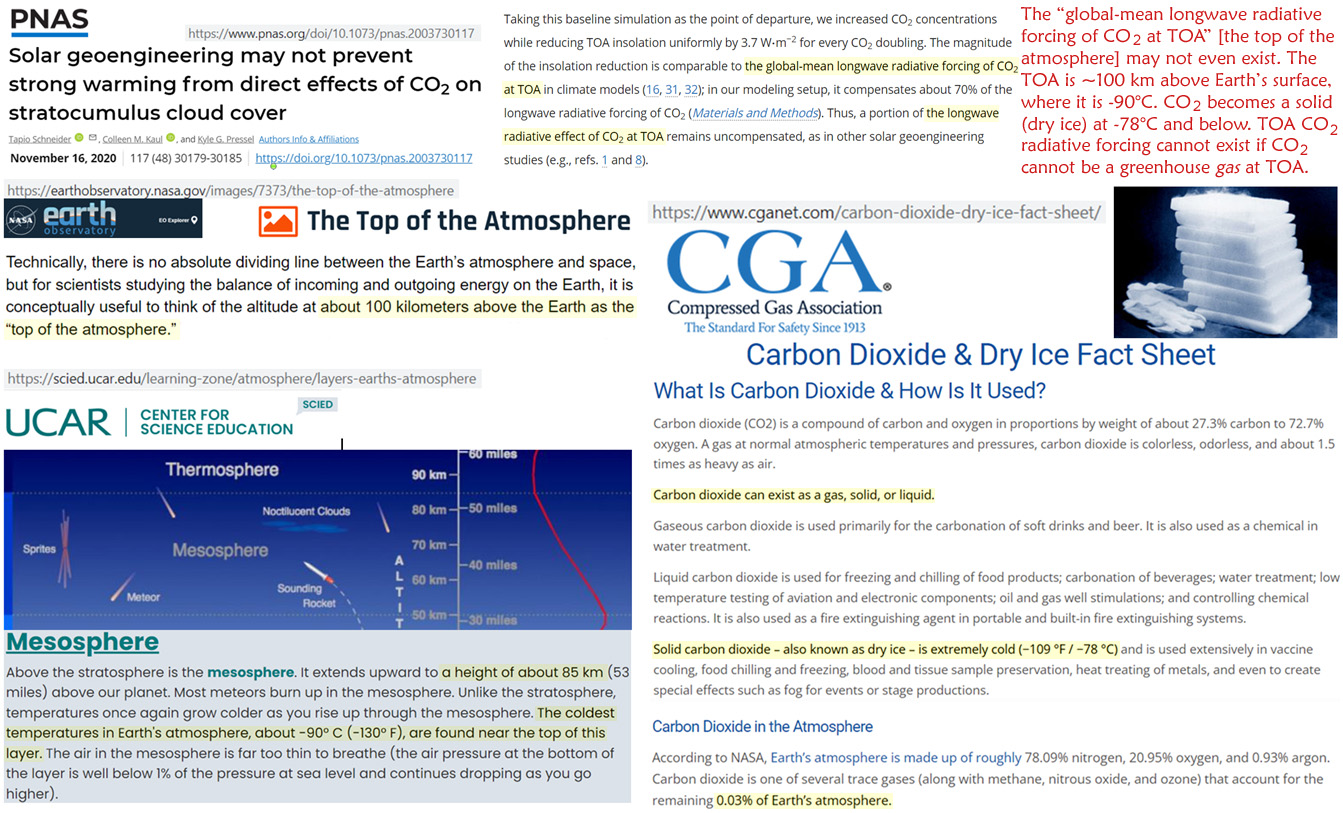


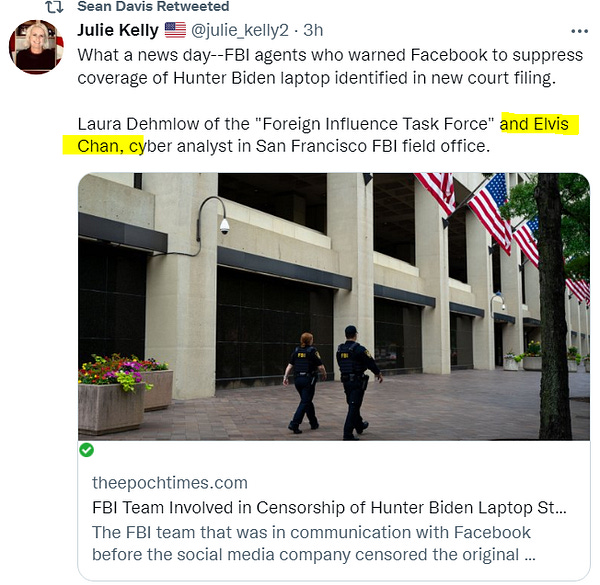
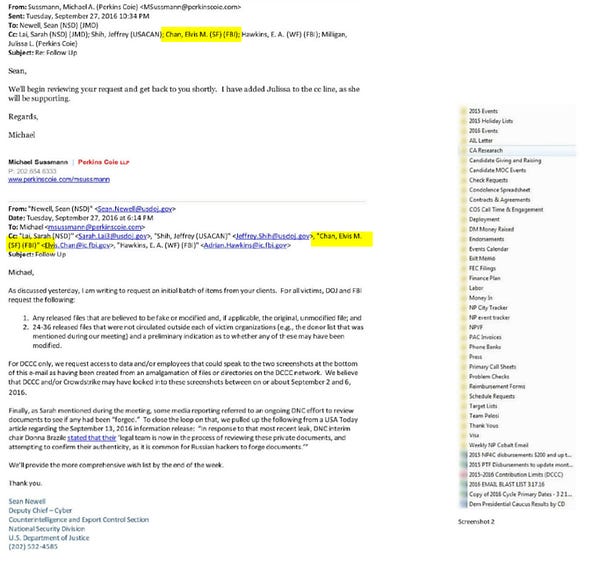

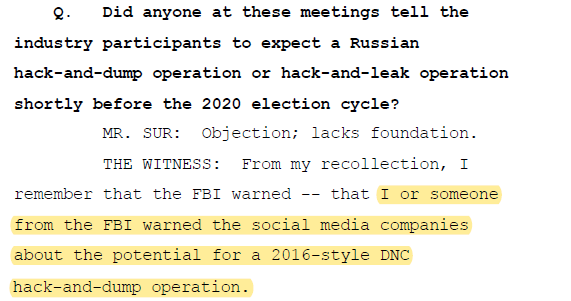
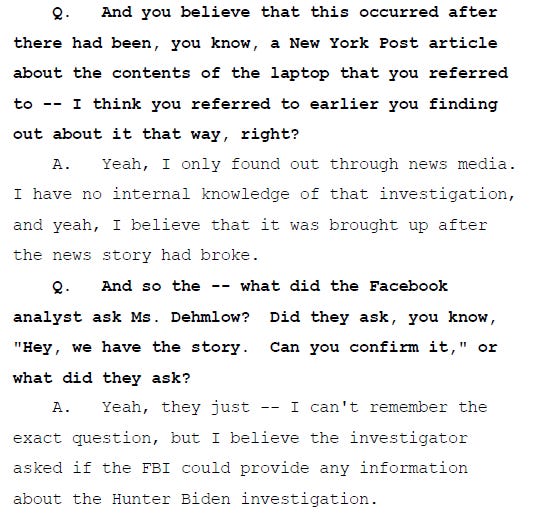
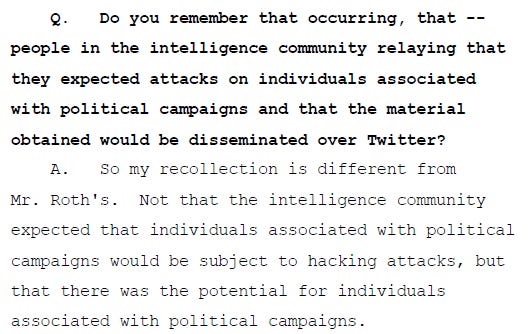


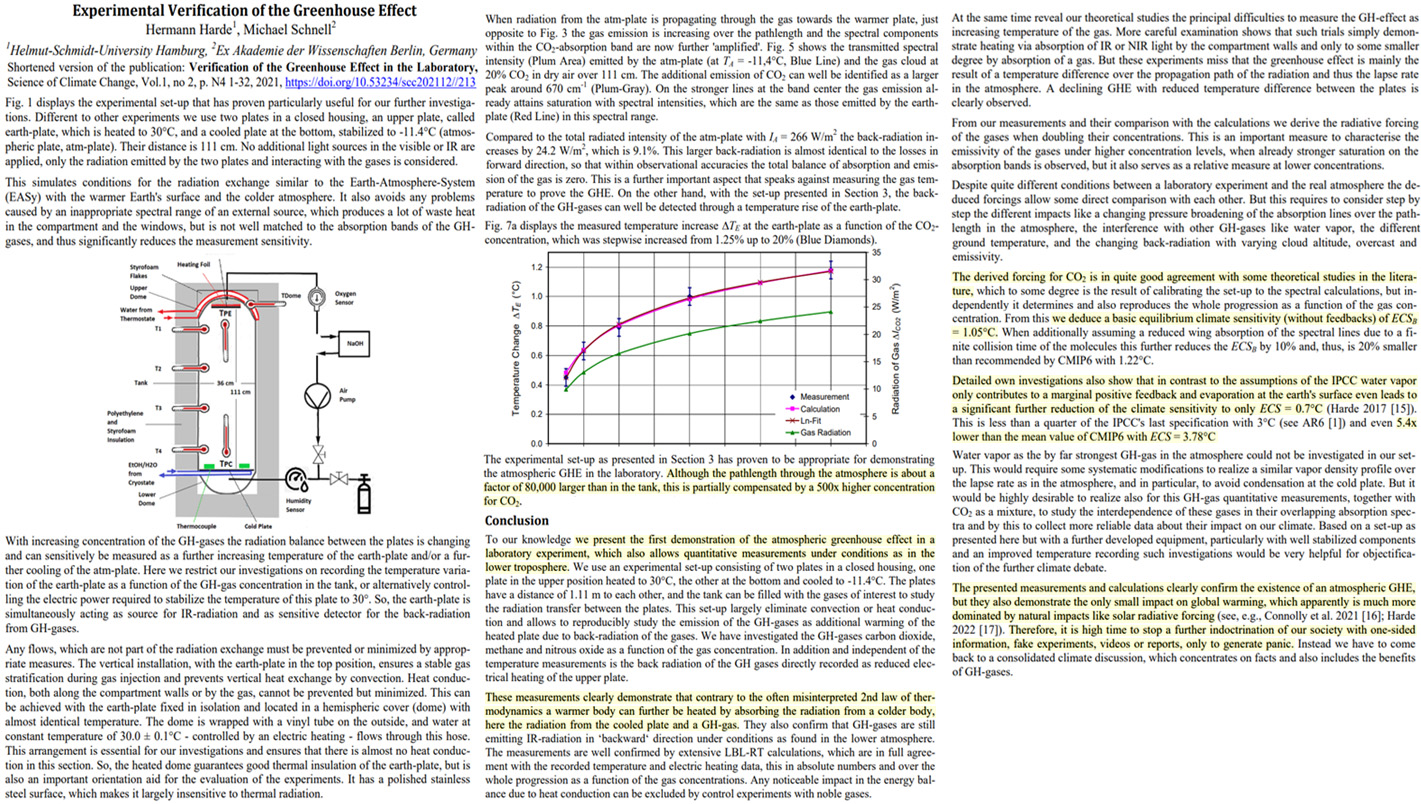


