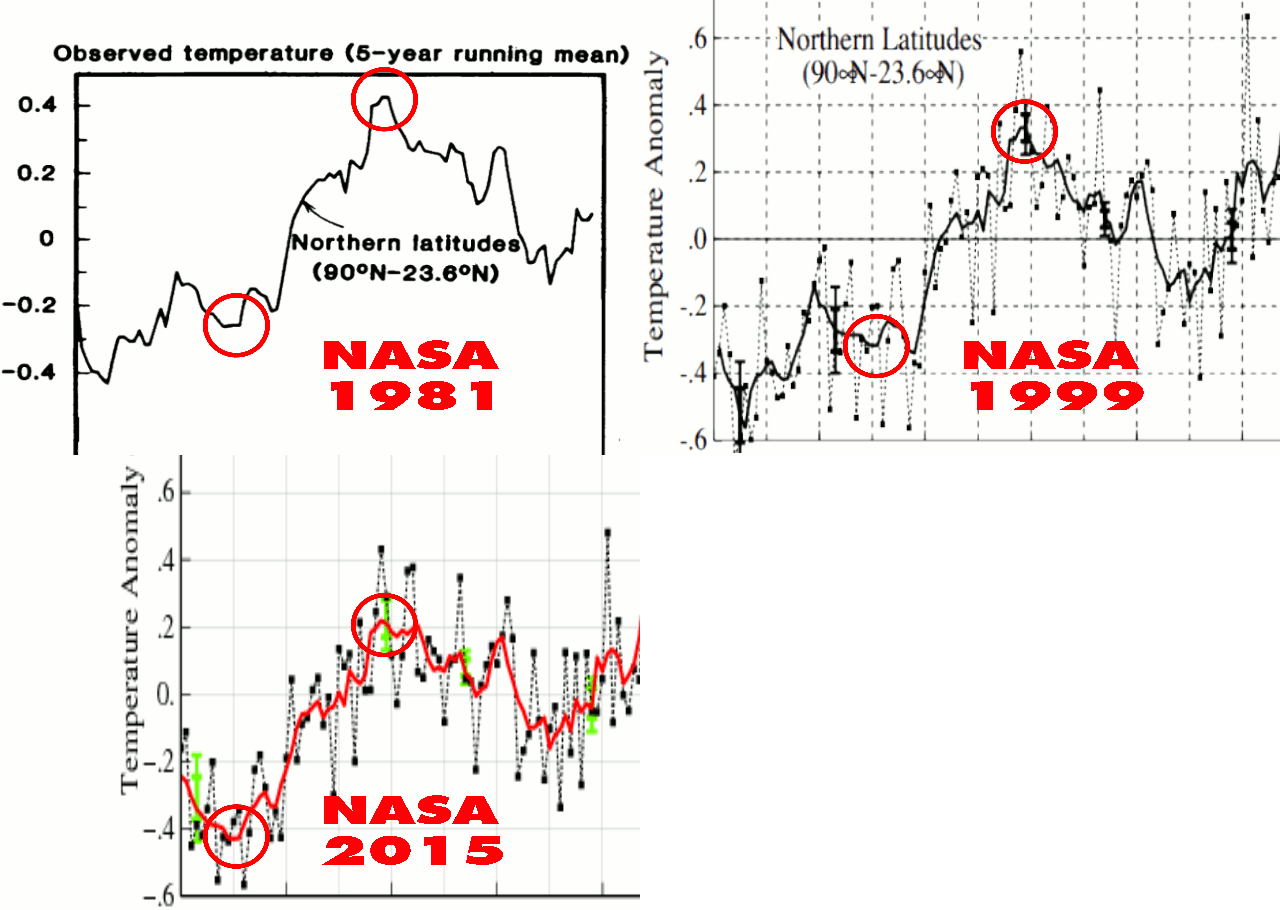
Earlier today I showed Gavin’s spectacular data tampering before 1980, to create the lower half of the hockey stick.
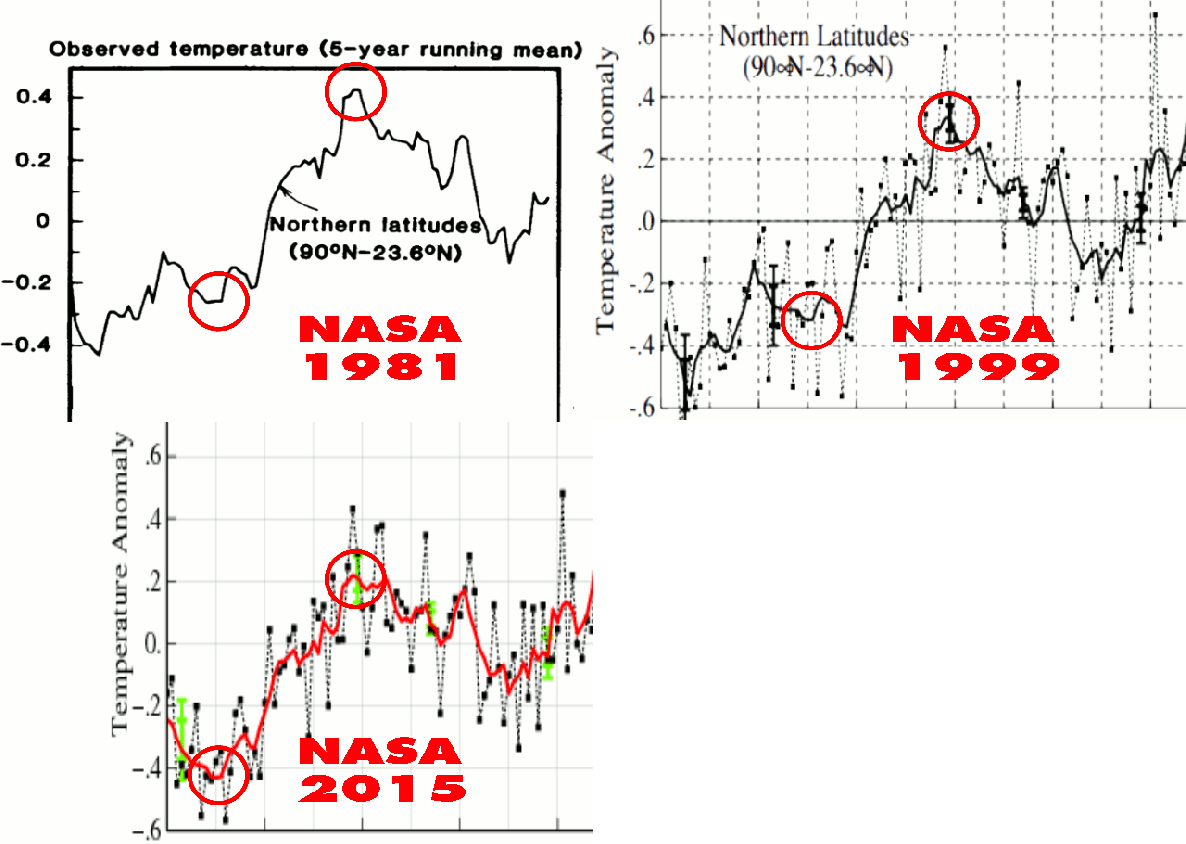
1981 version : 1981_Hansen_etal_1.pdf
1999 version : 1999_Hansen_etal_1.pdf
Current version : Fig.B.gif (407×678)
But that is only half of the hockey stick. Some of Gavin’s finest tampering is done in the 1990’s data.
Hansen 1999 showed no net warming during the 1990’s
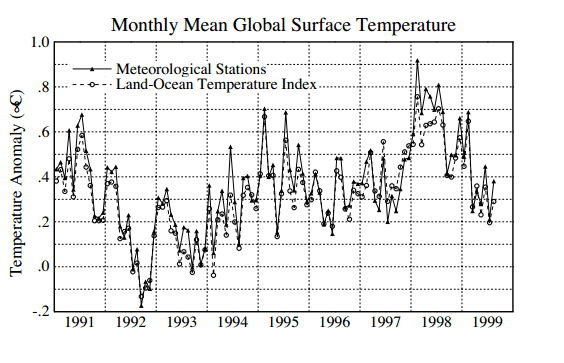 pubs.giss.nasa.gov/docs/1999/1999_Hansen_etal_1.pdf
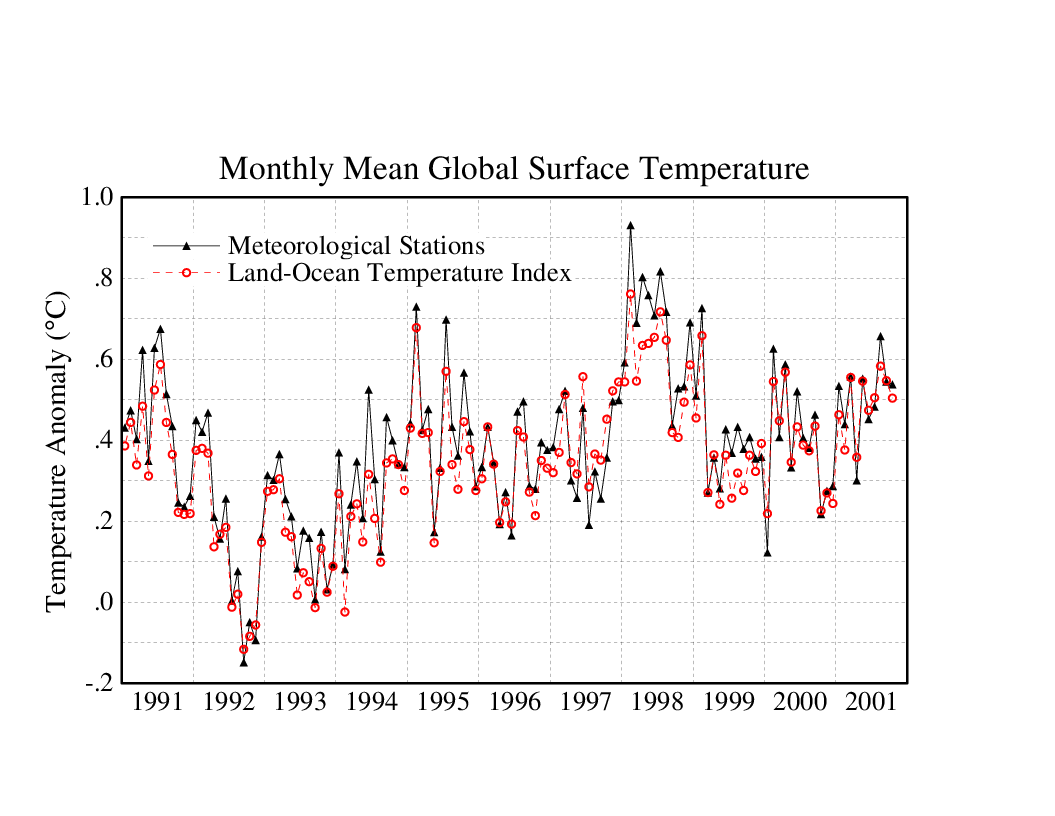
In 2001, the GISS website also showed no net warming during the 1990’s
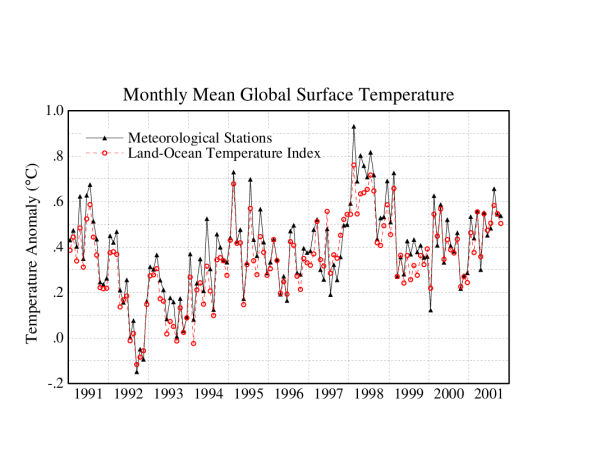
NASA Goddard Institute: Surface Temperature: Graphs
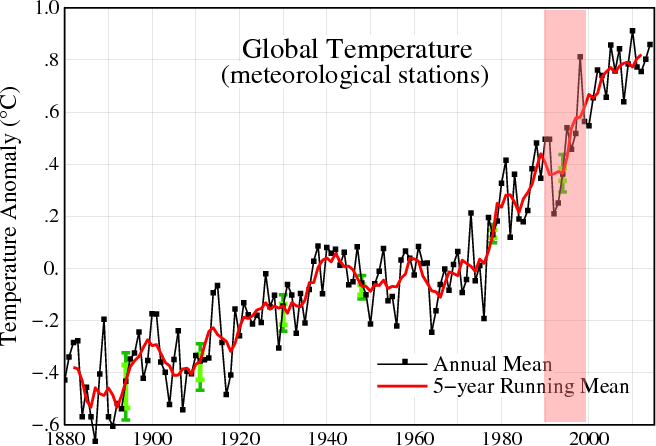
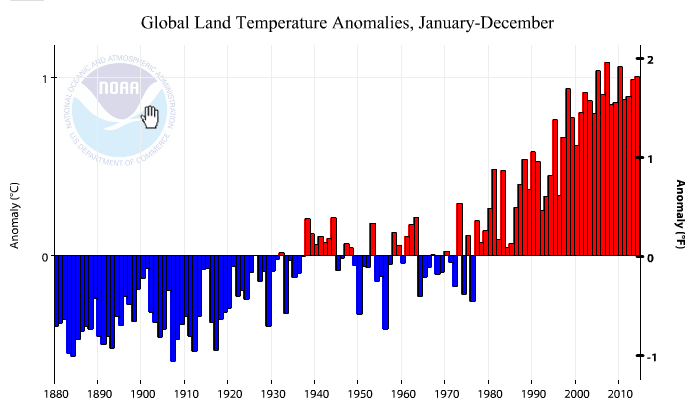
But GISS now shows the 1990’s as the fastest warming decade.
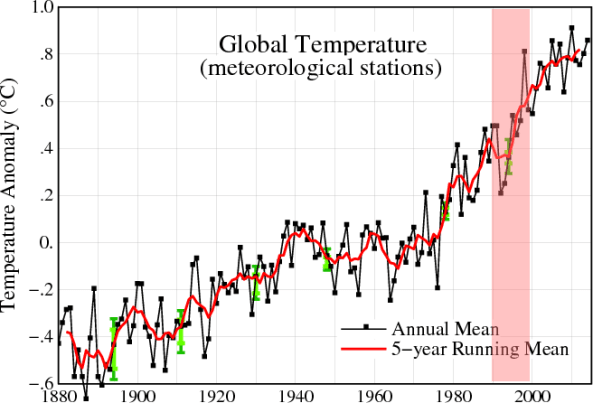
They built the rest of the hockey stick by simply making up data.
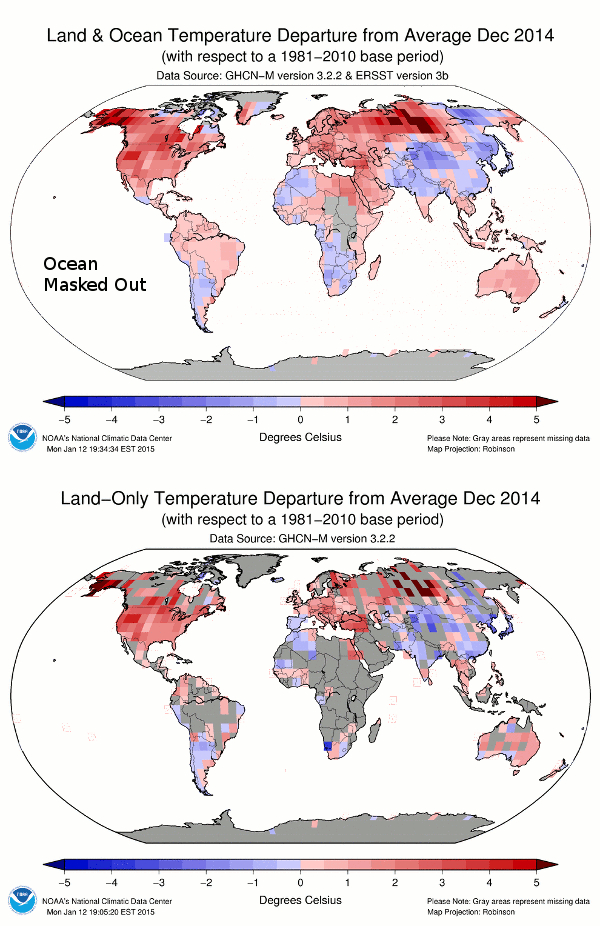
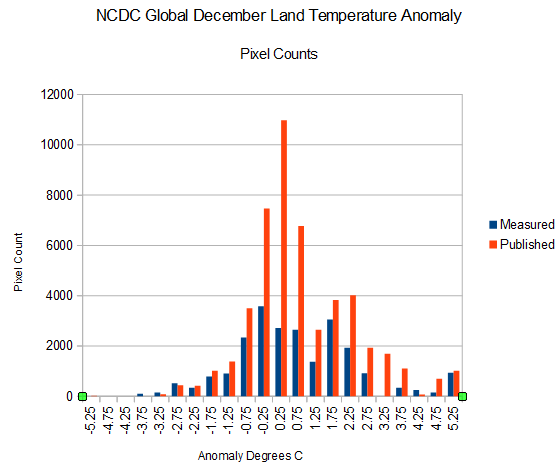
This image shows how the 1990’s station data has been altered since Hansen 1999.
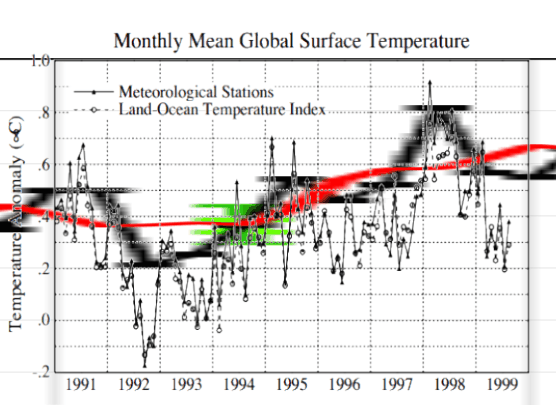
The animation below shows the spectacular alterations to GISS 1990’s surface between 2001 and 2015, tripling the warming during the decade.
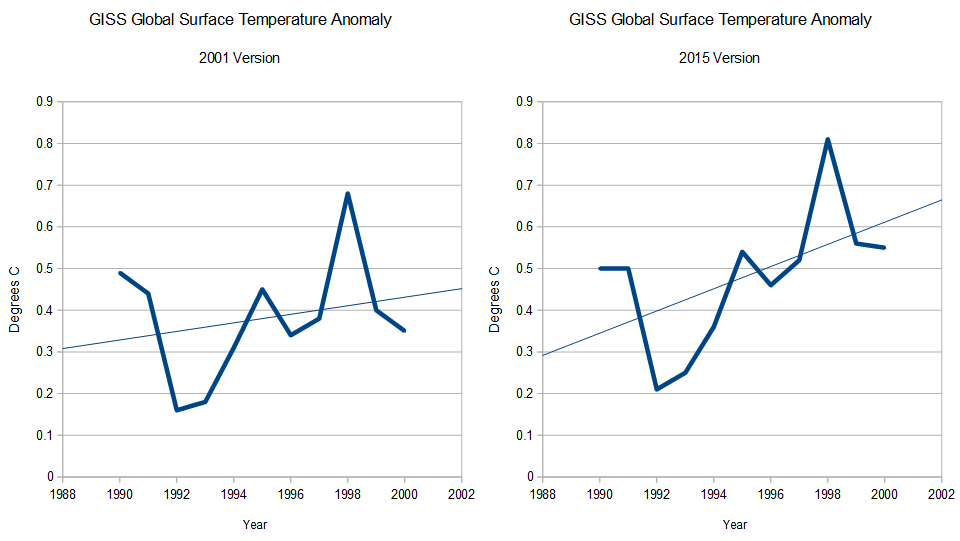
2001 : FigA.txt
Current : Fig.A.txt
We also know that the post 2000 warming is fake, because none…







 By Larry Bell ~
 An internal 2009 email to top officials recognized that, “The number of Americans who say the global warming threat has been exaggerated is at an all-time high,” and that outreach pitches directed to polar ice cap and polar bear “mascots” were losing effectiveness. [Note: the poll at left is from 2010. Source: BBC.]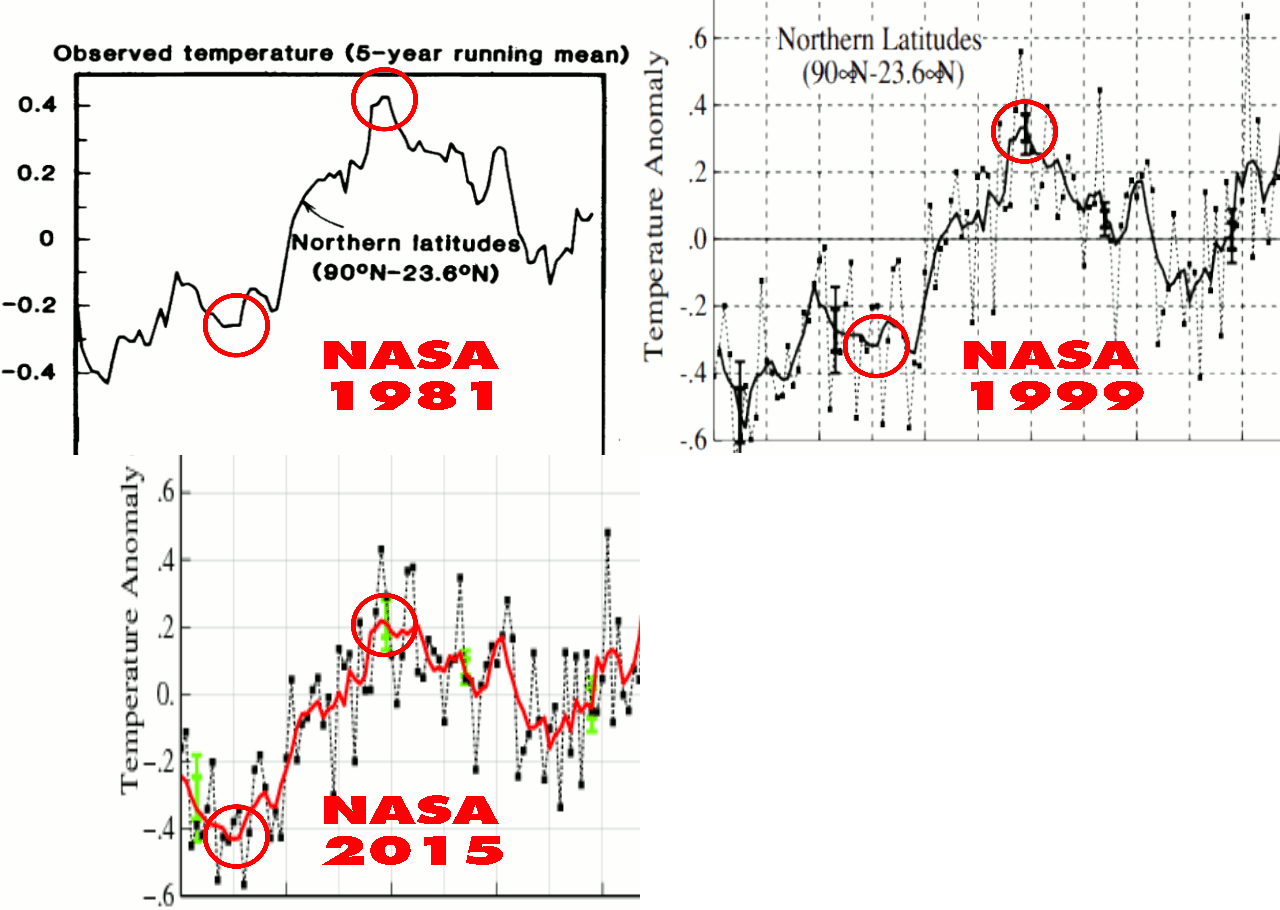


 Centinel2012