Michael Mann Explains Why NCDC/GISS Data Tampering Is Fraudulent


Its easy to make cool pictures to show what you want, but that is not science. It would seen the these guys have come from Dream Works not MIT or Cal Tech

Tony Heller's avatarReal Climate Science

ScreenHunter_7071 Feb. 11 22.19

Mikey is severely math challenged, but shows off an important point.

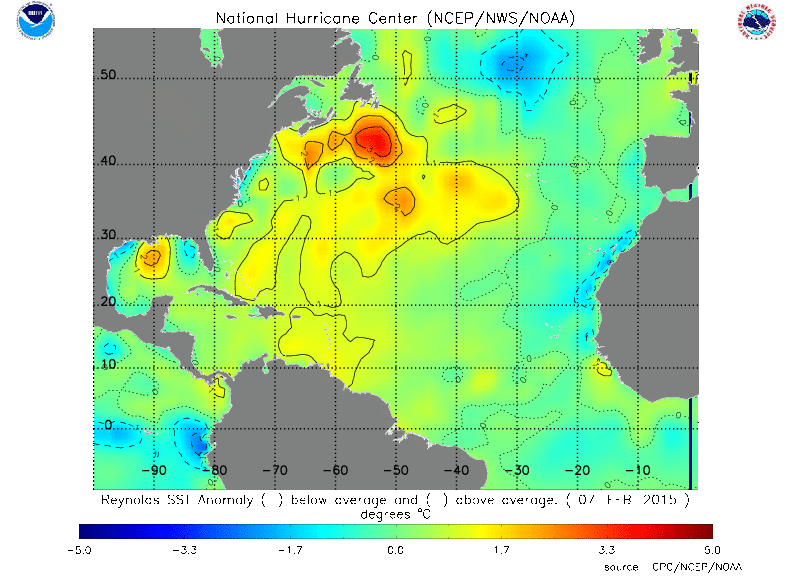
You can’t extrapolate temperatures across ocean/land boundaries like NCDC does. The Gulf Stream is warm off of Massachusetts, but Massachusetts itself is frozen. There is a sharp dividing line at the coast.

ScreenHunter_7074 Feb. 11 22.30

YearTDeptNRCC (2)

ScreenHunter_7080 Feb. 12 05.18

GISS extrapolates 1200 km, which is like making the Liverpool weather forecast based on the weather in Nice, France.

View original post

US Temperatures Are Being Adjusted Upwards To Increase Warming By Almost Two Degrees


NASA-GISS is the biggest manipulator of data that every existed.

Tony Heller's avatarReal Climate Science

The climate fraudsters are all over the Internet today claiming that they are adjusting raw temperatures in a way which reduces warming. Let’s check that claim out.

The US has the only decent long term temperature record covering a large area of this planet. Temperatures here are being massively adjusted to increase warming, the exact opposite of what the fraudsters claim. Older temperatures are being adjusted down, and newer temperatures are being adjusted up.

ScreenHunter_7078 Feb. 12 00.34

ScreenHunter_7077 Feb. 12 00.22

The data tampering accounts for almost the entire claimed warming trend in the US.

View original post

Michael Mann Takes Climate Stupid To Dizzying New Heights


Since the real world doesn’t agree with their narrative they have resorted to fiction.

Tony Heller's avatarReal Climate Science

ScreenHunter_7071 Feb. 11 22.19

21 degrees above normal? The water is 39 degrees. Apparently  Mikey believes that the normal temperature of the water is 18 degrees F, 10 degrees below the freezing point of seawater.

ScreenHunter_7073 Feb. 11 22.28

The highest anomaly in the region is about 3C.  The man is a genius.

ScreenHunter_7074 Feb. 11 22.30

unnamed (3)

Mikey’s link shows the water just south of Cape Cod slightly below normal.

ScreenHunter_7075 Feb. 11 23.12

View original post

Paul Driessen on sugar daddys buying phony environment science from anxious whores


Since their GCM’s have proved to be wrong they are in a panic mode to rewrite history I’ll have more on this later today on my blog.

john1282's avatarJunkScience.com

Paul Driessen sure does a good job on this one on incest in the enviro gov and non gov elements.

Paul, a moral humanist and humanitarian, stands up for good science and against the negative impact of government agency overreach and excess regulation on the little people.

View original post 3,088 more words

Adjusting the temperature to fit the narrative


This problem with manipulating data is destroying science!

Bob Greene's avatarJunkScience.com

People delving into GHCN’s temperature homogenization keep coming up with evidence that the adjustments provided biased results. 

View original post 240 more words

Hockey Stick Update


Great Chart 🙂

Tony Heller's avatarReal Climate Science

On January 20, President Obama took credit for a drop in gas prices which he didn’t want to see and did everything he could to prevent.  Since then, gas prices have shot upwards in a hockey stick.

ScreenHunter_6820 Feb. 06 07.19

GasBuddy.com – Find Low Gas Prices in the USA and Canada

View original post

Gavin’s Spectacular Data Tampering In The 1990’s


It’s amazing that they can get away with such blatant data tampering!

Tony Heller's avatarReal Climate Science

Earlier today I showed Gavin’s spectacular data tampering before 1980, to create the lower half of the hockey stick.

NASANorthernLatititudes1981-1999-2015

1981 version : 1981_Hansen_etal_1.pdf
1999 version : 1999_Hansen_etal_1.pdf
Current version : Fig.B.gif (407×678)

But that is only half of the hockey stick. Some of Gavin’s finest tampering is done in the 1990’s data.

Hansen 1999 showed no net warming during the 1990’s

ScreenHunter_6734 Feb. 03 21.33pubs.giss.nasa.gov/docs/1999/1999_Hansen_etal_1.pdf

In 2001, the GISS website also showed no net warming during the 1990’s

FiG.C.2001

NASA Goddard Institute: Surface Temperature: Graphs

But GISS now shows the 1990’s as the fastest warming decade.

PaintImage66

They built the rest of the hockey stick by simply making up data.

This image shows how the 1990’s station data has been altered since Hansen 1999.

ScreenHunter_6746 Feb. 04 05.46

The animation below shows the spectacular alterations to GISS 1990’s surface between 2001 and 2015, tripling the warming during the decade.

GISSFigA2001-2015.gif

2001 : FigA.txt
Current : Fig.A.txt

We also know that the post 2000 warming is fake, because none…

View original post 28 more words

EPA Email Shows Desperate Climate Change Agenda


The Progressive will and have done ANYTHING to advance their cause, they are just like Islamic Jihadists maybe we should call them Environmental Jihadists!

PA Pundits - International's avatarPA Pundits International

The EPA will do ANYTHING, lie about EVERYTHING, to increase its power

Larry-Bell_avatar-80x80By Larry Bell ~

With public concern about climate waning, the EPA turned its anti-fossil messaging campaign to fear-mongering about child health impacts.

20100601_EPALogoAn internal 2009 email to top officials recognized that, “The number of Americans who say the global warming threat has been exaggerated is at an all-time high,” and that outreach pitches directed to polar ice cap and polar bear “mascots” were losing effectiveness.  [Note: the poll at left is from 2010.  Source: BBC.]

Accordingly, it urges the agency to shift its emphasis to respiratory illness justifications which will “make this issue real for many Americans who would otherwise oppose many of our regulatory actions.”

Newly released by Anthony Watts at the popular blog site, “Watts Up With That,” the memo was obtained by attorney and Competitive Enterprise Institute Senior Fellow Chris Horner through…

View original post 785 more words

Hansen and Schmidt Removing The 1940’s Blip


Mother nature presents to the believers at NASA and NOAA, the real climate, which she produces, and which they can not understand, why it doesn’t match what their expensive climate models say should be happening. To them Mother Nature must be wrong not their fancy models! I’d say their is little hope for them and lets hope future “real” scientists use the movement as a sample of what not to do again!

Tony Heller's avatarReal Climate Science

In 1981, Hansen reported high temperatures at the Northern Latitudes (23.6N – 90N) around 1940, followed by a strong cooling. But that didn’t support the theory, so NASA’s finest simply made the 1940’s blip disappear through repeated data tampering.

NASANorthernLatititudes1981-1999-2015

1981 version : 1981_Hansen_etal_1.pdf

1999 version : 1999_Hansen_etal_1.pdf

Current version : Fig.B.gif (407×678)

They climategate team didn’t like the 1940’s blip, so they disappeared it.

From: Tom Wigley <wigley@ucar.edu>
To: Phil Jones <p.jones@uea.ac.uk>
Subject: 1940s
Date: Sun, 27 Sep 2009 23:25:38 -0600
Cc: Ben Santer <santer1@llnl.gov>

It would be good to remove at least part of the 1940s blip, but we are still left with “why the blip”.

di2.nu/foia/1254108338.txt

View original post

More Than Half Of NCDC December Land Temperatures Were Fake


What else would you expect from NASA that have to start supporting to move to a Climate treaty!!

Tony Heller's avatarReal Climate Science

After the announcement of hottest year ever, the reason given to ignore satellite temperatures was because “we don’t live in the troposphere.” Apparently we must be fish, because the land temperatures were not the hottest ever. And I am pretty sure that we do actually live in the troposphere.

ScreenHunter_6719 Feb. 03 07.37 Climate at a Glance: Time Series | National Climatic Data Center (NCDC)

But it is much worse than it seems. 58% of the land temperatures reported by NCDC for December were completely fake – as shown in the animation below which has ocean temperatures masked out.

NCDCLandRealVsPublished

Land-ocean 201412.gif (990×765)

Land 201412.gif (990×765)

The graph below shows the pixel counts of measured and published land temperatures. As you can see, the vast majority of fake pixels have positive anomalies. Their algorithms (which “work as designed”) skew fake data towards high temperatures..

ScreenHunter_6718 Feb. 03 07.26

The reported December land anomaly was 1.36C, but the…

View original post 15 more words