Faking the numbers is the only thing they can do to try and save their failed climate models. History will not treat this scam artists very well.
The hockey stick was created largely by altering historical data.
The graph below shows how Gavin has altered his own global surface temperatures by 0.4 C, just since 2003.
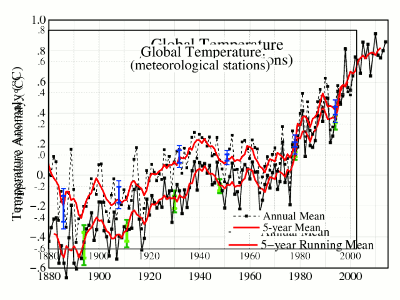
2003 : FigA.txt
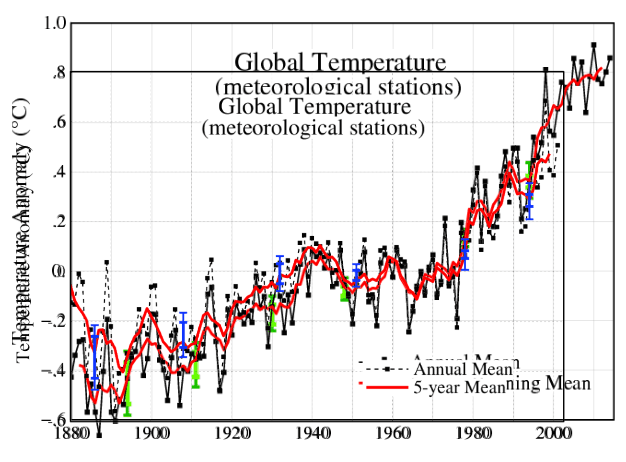
2014 : Fig.A.txt
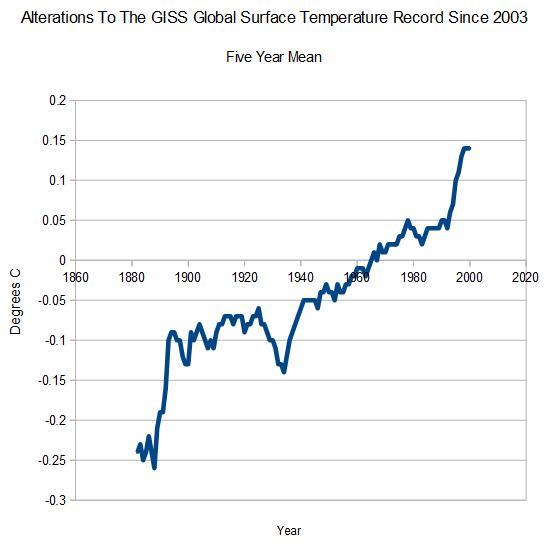
The shape is not accidental. By pushing most of the tampering to the beginning and the end of the interval, it makes the damage harder to detect visually, as seen in the overlay below.
The animation below provides a much better visualization of how much damage the tampering does.