
Great work, even though I knew what was done your time line really lays it out. Any one that was involved with this travesty should have there degrees revoked; what ever there are that are not scientists!
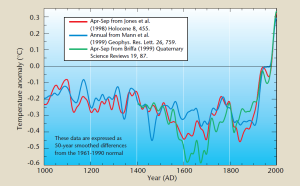
Today I will review the timeline of the above WMO 1999 graph in the light of the ClimateGate (CG) letters. The main events took place on Tuesday, November 16th, 1999.
Things start rolling 9 AM (UK time), when Tim Osborn sends the new Briffa and recalibrated Jones (1998) time series to Phil Jones along with the suggestion to hide the decline.
It is ready calibrated in deg C wrt. 1961-90, against the average Apr-Sep land temperature north of 20N. It goes from 1402 to 1994 – but you really ought to replace the values from 1961 onwards with observed temperatures due to the decline.
Twenty minutes later Jones writes to the MBH crew (cc Briffa and Osborn) explaining exactly what the graph will look like.
WMO want to go with the millennial record on the cover and I said I would produce something and some text. The figure…
View original post 1,664 more words

There was much more to the science criminal enterprise than the events that took place on Tuesday, November 16th, 1999. E.g.,
On January 7, 1998 a CSPAN news video captured on film the NASA Administrator finally releasing data from the 1995 plunge of the Galileo spacecraft into Jupiter’s atmosphere,
The 1995 data from Jupiter confirmed a 1983 report that analysis of lunar soils from the 1969 Apollo Mission contradict the 1946 Standard Solar Model of a hydrogen-filled Sun.
1983 Paper in Meteoritics: http://tinyurl.com/224kz4
1998 Paper in Meteoritics:
Click to access 5011.pdf
LikeLike