Is 2014 really warmer than 2010?


Actually with the way NASA and NOAA treat the temperature data it’s really hard to say so here is a brief analysis that shows the problem.

The following table contains the average anomaly value taken from NASA-GISS table LOTI which I have been putting into a spreadsheet column each month. The values in the table for the year 2010, which is the top row, represent the average of all the published values for the 12 months that numbers are published i.e. January 2010 would have only one value and December 2010 would have 12 values one for each month. For the entire year there would be 78 values for the first year and all seceding years there would be 144 values 12 each published month (January through December) times twelve months. The rows are for a particular year and the columns are the average value for the indicated year, so 2010 has 5 values with 2014 being the lowest

This method may seem a bit odd, and it is, but it is necessary since the numbers for any given month are not a constant and they can move around a lot, both up and down, over time because of the methods that are used to generate the values. In this table 2010 and 2011 do not contain a full twelve month set as I have missing reports. 2013 has a full 144 values and 2014 is a full listing though November of eleven months or 66 values.

2010 compared to 2014

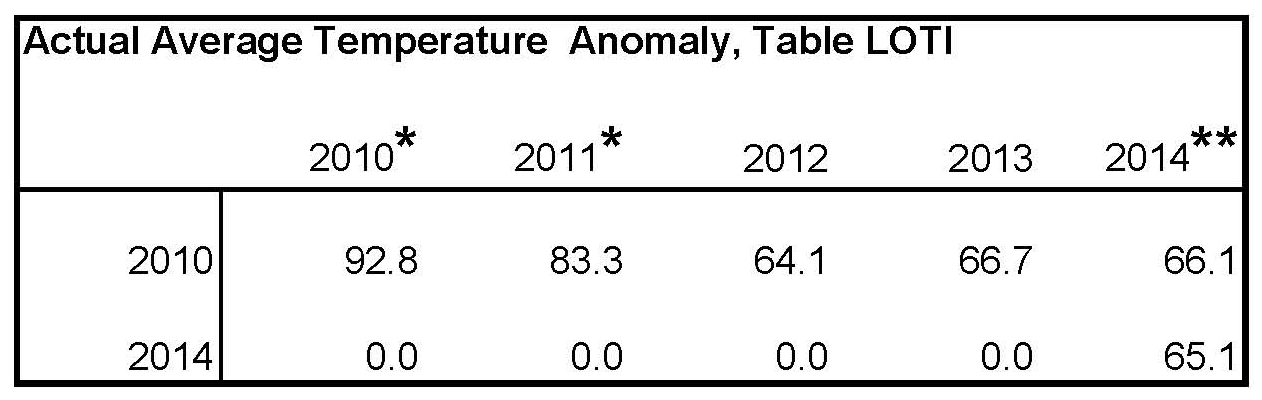
The most interesting aspect of looking at the published values is how the average for 2010 went from in the eighties down to the mid sixties. There was a major revision in the data set in December 2012 which partially shows in the drop in the temperature anomaly from 2010/2011 compared to 2012. 2012 would be higher if a full set of values was available, I only have 8 out of 36. A best guess for those three years would probably be around 80.

A previous study on what happened during that time frame was published here in the section Climate Research on June 13th.

* Only a few values

** Eleven values

Note: If anyone has access to, or knows where I could get, old versions of NASA-GISS table LOTI, I would be interested in talking to you. The following header is on that table.

GLOBAL Land-Ocean Temperature Index in 0.01 degrees Celsius   base period: 1951-1980  sources: GHCN-v3 1880-11/2014 + SST: ERSST 1880-11/2014 using elimination of outliers and homogeneity adjustment Notes: 1950 DJF = Dec 1949 – Feb 1950 ; ***** = missing

Greenland Breaks Record For One Day Ice Mass Gain


More is less , its the new math from common core!

Tony Heller's avatarReal Climate Science

The Greenland ice sheet has gained record amounts of ice this season (300 billion tons) with a record one day accumulation of 12 billion tons in mid-September.

ScreenHunter_5188 Dec. 14 05.36 Greenland Ice Sheet Surface Mass Budget: DMI

Experts say that Greenland is melting down, and is going to drown us all.

View original post

Sea Ice Extent – Day 347 – Global Sea Ice 5th Highest For Day


This has to be wrong, only a few years ago all the settled science stated that there would be no ice by now?

sunshinehours1's avatarsunshine hours

Global_Sea_Ice_Extent_2014_Day_347_1981-2010Global_Sea_Ice_Extent_Zoomed_2014_Day_347_1981-2010Antarctic_Sea_Ice_Extent_2014_Day_347_1981-2010Antarctic_Sea_Ice_Extent_Zoomed_2014_Day_347_1981-2010Arctic_Sea_Ice_Extent_2014_Day_347_1981-2010Arctic_Sea_Ice_Extent_Zoomed_2014_Day_347_1981-2010

View original post

Sea Level Plummeting At Fastest Rising Location On Earth


Down is up, cold is warm and pigs can fly when you are feeling mellow!

Tony Heller's avatarReal Climate Science

According to experts at the University of Colorado, sea level east of the Philippines is rising at about 15 mm/year. However, their own data shows sea level at that location falling 36 mm/year since late 2010.

ScreenHunter_5200 Dec. 14 06.58ScreenHunter_5201 Dec. 14 07.06

ssh_anomaly.nc

View original post

Only 100 Degrees Of Warming Needed To Start The Greenland Meltdown


Only a 100 degrees — not to worry I’m sure they can come up with a way to get there!

Tony Heller's avatarReal Climate Science

Temperature in Greenland now is -67F, and only needs to warm up 100 degrees to get above freezing.

ScreenHunter_5196 Dec. 14 06.21 summit:status:webcam

View original post

Navy Experts Say Arctic Will Be Ice-Free By 2013


The Nonsensical “Just What AGW predicts” and Other Claims By Alarmists about “Record-High” Global Sea Surface Temperatures in 2014


NASA and NOAA have no creditability when it comes to publishing data and studies the data is compromised and so any results that this data shows has no meaning.

USHCN Replacing Rural Temperatures With Urban Ones


Change the way you measure to get the result you want that beats coming up with a better theory!

Tony Heller's avatarReal Climate Science

Earlier I showed that all NCDC US warming is due to fabricated temperatures.

ScreenHunter_5147 Dec. 12 21.27

Now lets look at the stations which were missing data in 2013. Almost all of them are rural stations, which means that they are filling in missing rural temperatures, with interpolated urban temperatures.

ScreenHunter_5178 Dec. 13 12.17

This clever technique allows NCDC to contaminate rural stations with urban temperatures, and create the non-existent warming which politicians demand,

View original post

State Of The Climate Report


By my calculation we are about .5 degrees C below what the GCM’s claim the temperature should be based on the ~400 ppm of CO2 in the atmosphere!

Tony Heller's avatarReal Climate Science

Our most accurate global temperatures are from satellites, and they show little or no warming. Temperatures are far below climate model forecasts

ScreenHunter_5163 Dec. 13 05.39

Climate Analysis | Remote Sensing Systems

Arctic sea ice extent is at a 10 year high.

ScreenHunter_5164 Dec. 13 05.41

COI | Centre for Ocean and Ice | Danmarks Meteorologiske Institut

Global sea ice area is well above the satellite era mean.

iphone.anomaly.global (1)

iphone.anomaly.global.png (512×412)

Snow extent is increasing and at a record high

nhland_season4

Rutgers University Climate Lab :: Global Snow Lab

Tornado activity is at a record low

torgraph

Storm Prediction Center WCM Page

Everything the experts forecast has failed. There is no climate crisis.

View original post

John Kerry’s Global Warming Hoax


Kerry aka Lurch, doesn’t have an original thought in is diminished brain and even has a had time communicating what his handlers tell him to say.