
When I started to study the issue of anthropogenic climate change about 10 years ago, I saw no reason to disbelieve anything that NASA published since as a young army Captain at Ft Campbell Kentucky I had watched the Saturn V launch of Apollo 11 that put Neil Armstrong and Buzz Aldrin on the moon on July 20, 1969. But now 46 years later its obvious that those days are long gone and NASA is run by politicians and nothing they do is based on science or engineering.
The famous saying from W. Edwards Deming, “In God we Trust, all others (must) bring data” use to hang in mission control in Huston but I doubt it’s there anymore and even if it is still there its meaning has been lost. NASA’s new mission is to prove that man is harming the planet and to spread science across the world. To “prove” (not determine if) that man through the burning of fossil fuels is causing the planet to overheat, extremely complex atmospheric models (GCM’s) have been built. Then reports are generated by a UN agency the Intergovernmental Panel on Climate change (IPCC) from the models that predict global temperatures into the future based on the concept that the level of CO2 in the atmosphere correlates to global temperature i.e. that more CO2 means hotter temperatures.
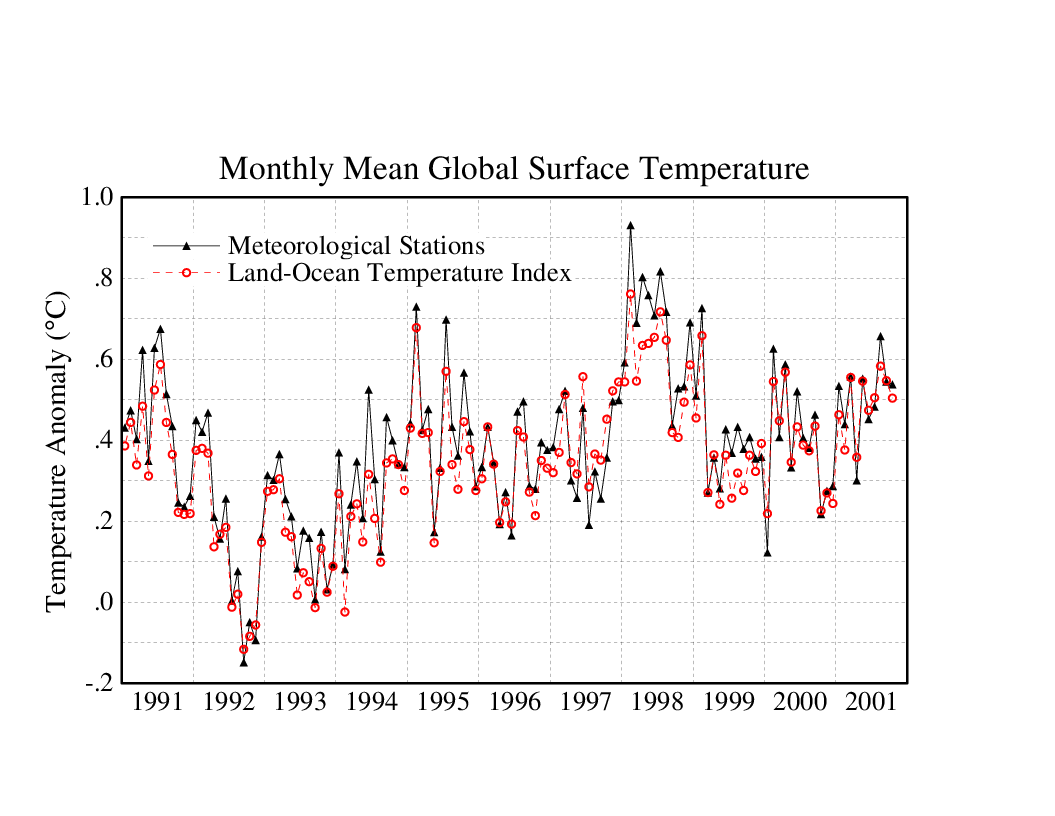
NASA’s role in this endeavor is to take temperature measurements from all over the world and then through software blend them into a global average. Many tables of temperatures are published each month by NASA-GISS (Goddard Institute of Space Studies) and one of them is the Land Ocean Temperature Index or LOTI. This table goes back to January 1880 and by month forward to the present with the most recent being issued on February 14, 2015 for January 2015. Over the last several years I have copied and printed out this LOTI data which is now 1621 values and then keyed them into a column on a spread sheet. This now represents 32 columns of values mostly in the past several years although I do have one from December 1998.
Over the years I have seen movement in the data which I first thought was random but since it movement of numbers seems to change the slope of the data curves that idea was quickly ruled out. But still even though it was obvious that data was being manipulated it was not materially effecting my work in climate modeling so I mostly showed the manipulation to colleagues and posted it on my blog but otherwise since the real scientists, known as flat earthers knew this any way I passed it over, but as of yesterday that has changed.
After copying the data into a word document and printing it out I observed that the numbers didn’t look right. The next step was to open the data file of past values and then start keying in the new data. Since it is in a column format, changes in the value of any month show right up. In the past to take out random changes due to rounding or other factors I have the spreadsheet set up to take the raw NASA data and make of new table of the average of a 10 year block of 120 values. This gives me 14 values with the last one from 2010 to 2019 containing only 61 values at present all the others have 120 values. This process ensures that a plot from this table will show a change only if there is a major change in the data. It was very obvious as I keyed in the January 2015 data from the NASA LOTI table that there had been a major shift.
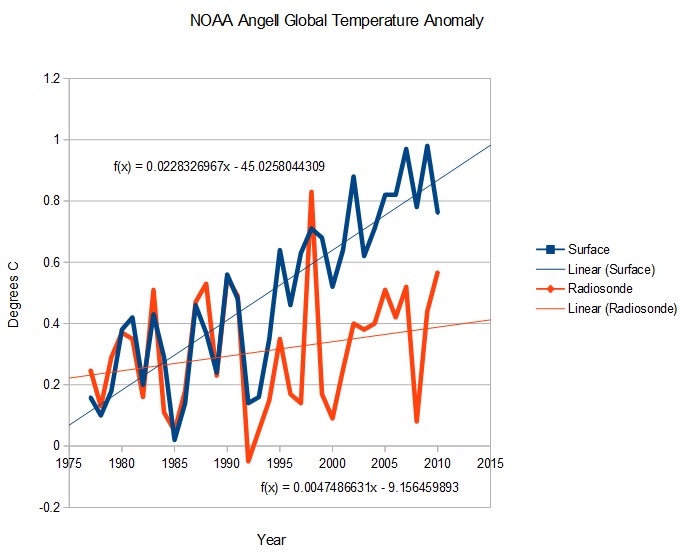
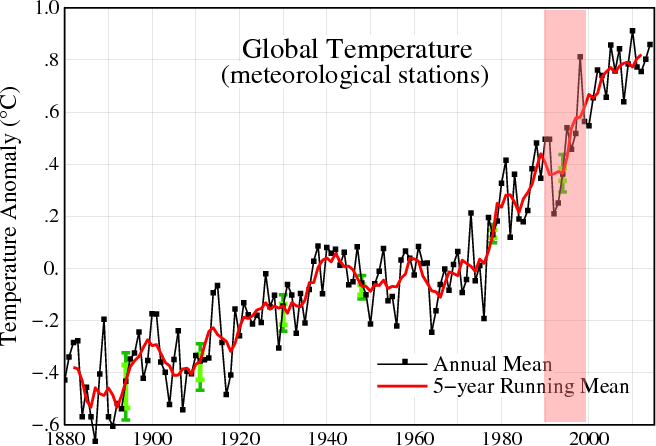
Most of those that will read this understand that NASA does not publish temperatures but publish Anomalies instead. To determine an Anomaly a base period must be set and NASA has set this as 1951 to 1980 and that is set to 14.0 degrees C and then all other values are subtracted from that then multiplied by 100 so that 14.5 degrees C would give an Anomaly of 50 and 13.5 would give an Anomaly of -50. The reasons for doing this do not matter as it doesn’t change anything. The following chart shows the plot from LOTI values from December 2014 and January 2015
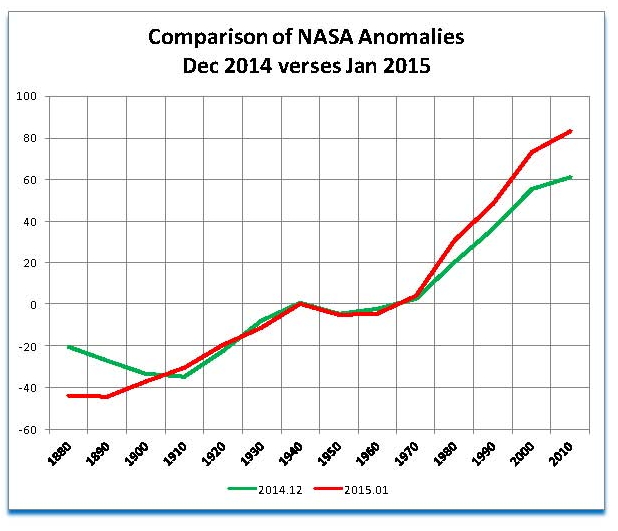
Clearly there has been a major change in how NASA determines global temperatures which is significantly different than any of the past issues over the last 10 or more years that I have been looking at this data. The period from January 1800 to December 1889 dropped by almost a quarter of a degree and the period from January 2010 to January 2015 rose by almost a quarter of a degree; this makes the present almost one half of a degree warming than it was 30 days ago. Also of note is there was little to no change in the data in the period from January 1940 to December 1979, which just happens to include the NASA base period.
I don’t think there is any valid reason for doing this and the only reason was that in the United Nations Climate Change Conference (COP21) will be held in France at the Le Bourget site from 30 November to 11 December 2015 and the conference objective is to achieve a legally binding and universal agreement on climate, from all the nations of the world. To achieve this they have determined that they need to show that the planet is overheating and since it is not (by satellite data) they need to show it in another form, hence the data manipulation at NASA-GISS
I cannot stress this enough there can be no other reason for what was just done. We are going to be shown false data from NASA-GISS for the next 10 months until this conference such that they hope there will be support for the treaty that they want which will be a massive tax on America and Europe so that development can be forced on other areas. This will be in line with the already approved UN Agenda 21 which is already being implemented in the United States.
The real goal here has nothing to do with CO2 or climate those are only the tools to force a change from representative government to one controlled by the powerful elites (business leaders and politicians); such as now exists in the EU where the government body of the EU is not elected by the people yet their ruling are binding on the people. The result of this conference and treaty, if adopted will either give the sovereign power of the countries to the UN or to some other body. What will come of that is unknown but we do know from past history that concentrated power is never good.


 An internal 2009 email to top officials recognized that, “The number of Americans who say the global warming threat has been exaggerated is at an all-time high,” and that outreach pitches directed to polar ice cap and polar bear “mascots” were losing effectiveness. [Note: the poll at left is from 2010. Source: BBC.]