Still no warming and the longer this goes on the worse the IPCC will look. My work indicated a slight downward trend leveling off between 2030 and 2035. I’ll be posting my monthly report this morning.


Still no warming and the longer this goes on the worse the IPCC will look. My work indicated a slight downward trend leveling off between 2030 and 2035. I’ll be posting my monthly report this morning.
This is exactly what they are doing, making the past colder to make the present warmer!
Flashes between GISS 1999, and GISS 2014
NASA GISS: Science Briefs: Whither U.S. Climate?
in the U.S. there has been little temperature change in the past 50 years, the time of rapidly increasing greenhouse gases — in fact, there was a slight cooling throughout much of the country
– James Hansen, 1999
If the present refuses to get warmer, the past must become cooler, and government scientists must ramp up the cheating.
All this event was, was a bunch of nobodies looking for handouts!
Actually with the way NASA and NOAA treat the temperature data it’s really hard to say so here is a brief analysis that shows the problem.
The following table contains the average anomaly value taken from NASA-GISS table LOTI which I have been putting into a spreadsheet column each month. The values in the table for the year 2010, which is the top row, represent the average of all the published values for the 12 months that numbers are published i.e. January 2010 would have only one value and December 2010 would have 12 values one for each month. For the entire year there would be 78 values for the first year and all seceding years there would be 144 values 12 each published month (January through December) times twelve months. The rows are for a particular year and the columns are the average value for the indicated year, so 2010 has 5 values with 2014 being the lowest
This method may seem a bit odd, and it is, but it is necessary since the numbers for any given month are not a constant and they can move around a lot, both up and down, over time because of the methods that are used to generate the values. In this table 2010 and 2011 do not contain a full twelve month set as I have missing reports. 2013 has a full 144 values and 2014 is a full listing though November of eleven months or 66 values.
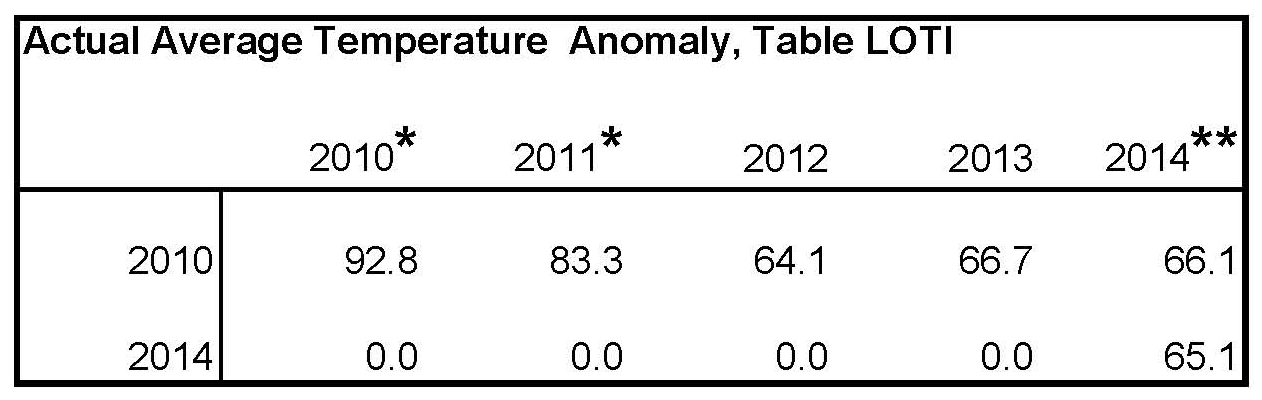
The most interesting aspect of looking at the published values is how the average for 2010 went from in the eighties down to the mid sixties. There was a major revision in the data set in December 2012 which partially shows in the drop in the temperature anomaly from 2010/2011 compared to 2012. 2012 would be higher if a full set of values was available, I only have 8 out of 36. A best guess for those three years would probably be around 80.
A previous study on what happened during that time frame was published here in the section Climate Research on June 13th.
* Only a few values
** Eleven values
Note: If anyone has access to, or knows where I could get, old versions of NASA-GISS table LOTI, I would be interested in talking to you. The following header is on that table.
GLOBAL Land-Ocean Temperature Index in 0.01 degrees Celsius base period: 1951-1980 sources: GHCN-v3 1880-11/2014 + SST: ERSST 1880-11/2014 using elimination of outliers and homogeneity adjustment Notes: 1950 DJF = Dec 1949 – Feb 1950 ; ***** = missing
More is less , its the new math from common core!
The Greenland ice sheet has gained record amounts of ice this season (300 billion tons) with a record one day accumulation of 12 billion tons in mid-September.
 Greenland Ice Sheet Surface Mass Budget: DMI
Experts say that Greenland is melting down, and is going to drown us all.
This has to be wrong, only a few years ago all the settled science stated that there would be no ice by now?
Down is up, cold is warm and pigs can fly when you are feeling mellow!
According to experts at the University of Colorado, sea level east of the Philippines is rising at about 15 mm/year. However, their own data shows sea level at that location falling 36 mm/year since late 2010.

Only a 100 degrees — not to worry I’m sure they can come up with a way to get there!
Temperature in Greenland now is -67F, and only needs to warm up 100 degrees to get above freezing.
Gee I guess they were wrong again , better luck next time!

NASA and NOAA have no creditability when it comes to publishing data and studies the data is compromised and so any results that this data shows has no meaning.
I have created this site to help people have fun in the kitchen. I write about enjoying life both in and out of my kitchen. Life is short! Make the most of it and enjoy!
De Oppresso Liber
A group of Americans united by our commitment to Freedom, Constitutional Governance, and Civic Duty.
Share the truth at whatever cost.
De Oppresso Liber
Uncensored updates on world events, economics, the environment and medicine
De Oppresso Liber
This is a library of News Events not reported by the Main Stream Media documenting & connecting the dots on How the Obama Marxist Liberal agenda is destroying America
Australia's Front Line | Since 2011
See what War is like and how it affects our Warriors
Nwo News, End Time, Deep State, World News, No Fake News
De Oppresso Liber
Politics | Talk | Opinion - Contact Info: stellasplace@wowway.com
Exposition and Encouragement
The Physician Wellness Movement and Illegitimate Authority: The Need for Revolt and Reconstruction
Real Estate Lending


