Armstrong Economics Blog/Nature
Re-Posted Jun 10, 2018 by Martin Armstrong
Categories: Nature


COMMENT: Mr. Armstrong; It is really getting bad here in Hawaii. Thank you for your writings on volcanos. It helped me convince my family to move to another island. There was a very loud explosion. That was simultaneous with a fairly large earthquake here we felt everywhere. It really keeps getting worse.
Thank you
REPLY: Yes, it was a 5.4 quake which is something you will feel in the entire region. The ash reached 10,000 feet high. No, it is not over yet. Because of the type of this volcano sitting on top of a hot spot, it is strikingly different than most. The sudden eruption throwing ash now into the sky is concerning for this has been a volcano that continuously has had activity. It is now in a phase of higher volatility from a cyclical perspective.
Once again, the more volcanic activity that erupts from 2018 onward will cool the climate and set the tone for the commodity rally into 2024 that our model is projecting.
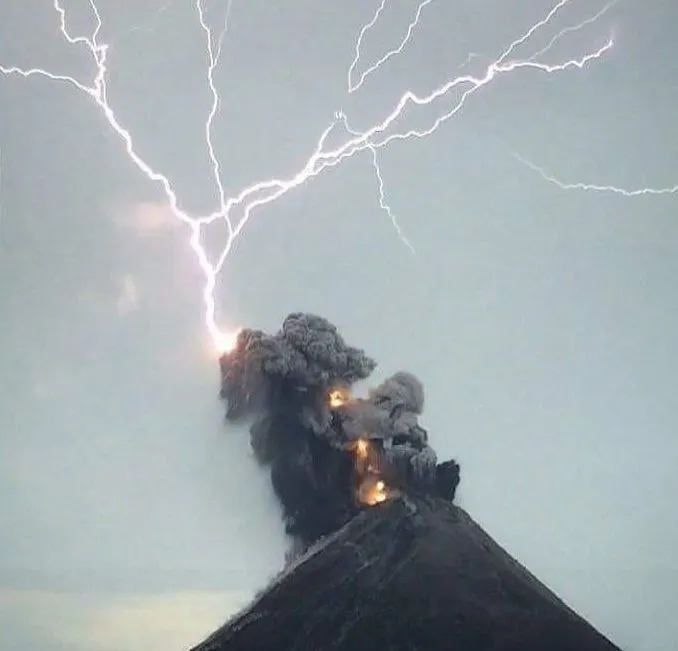
Guatemala’s Fuego volcano erupted with the most violent volcanic eruption in more than a century. People have been buried alive in the ash like Pompey. The eruption so far took place on Sunday and lasted for 16 and a half hours. The eruption reached 14,763 feet of ash thrown into the air. This is one of the more spectacular photos taken with lightning posted by Gloria Garces. You can see a brief video of the eruption captured by satellites at the NOAA.
So far, we have three volcanoes now all erupting here in 2018 around the Pacific Rim of Fire. As previously warned, the more volcanos that erupt now contribute to the decline in temperature and this will help set the stage for the commodity rally coming in the years ahead. Nature is incredibly linked to cyclical behavior.
By weight, human beings are insignificant.
If everyone on the planet were to step on one side of a giant balance scale, and all the bacteria on Earth were to be placed on the other side, we’d shoot violently upward. That’s because all the bacteria on Earth combined are about 1,166 times more massive than all the humans.
Comparisons to other categories of life similarly demonstrate how very, very small we are. As a sweeping new study in the Proceedings of the National Academy of Sciences finds, in a census sorting all the life on Earth by weight (measured in gigatons of carbon, the signature element of life on Earth), we make up less than 1 percent of life.
There are an estimated 550 gigatons of carbon of life in the world. A gigaton is equal to a billion metric tons. A metric ton is 1,000 kilograms, or about 2,200 pounds.
We’re talking in huge, huge, mind-boggling terms here.
So, using the new data in PNAS, we tried to visualize the weight of all life on Earth to get a sense of the scale of it all.
What you’ll see below is a kind of tower of life. Each large block of this tower represents a gigaton of life, and the blocks are grouped into broad kingdoms. There are the protists (think microscopic life like amoebae), archaea (single-celled organisms somewhat similar to bacteria), fungi (mushrooms and other types of fungus), bacteria (you’re familiar with these, right?), plants, and animals.
As you can see, plants dominate our world. If the tower of life were an office building, plants would be the main tenants, taking up dozens of floors. Comparatively, all the animals in the world — seen in gray in the tower — are like a single retail shop (a trendy one, to be sure) on the ground floor.
/cdn.vox-cdn.com/uploads/chorus_asset/file/11418989/slice1.jpg)
/cdn.vox-cdn.com/uploads/chorus_asset/file/11418993/slice2.jpg)
And if we zoom in on all animal life, we again see how insignificant humans are compared to everyone else in the kingdom. Arthropods (insects) outweigh us by a factor of 17. Even the mollusks (think clams) weigh more.
/cdn.vox-cdn.com/uploads/chorus_asset/file/11442561/slice3.jpg)
/cdn.vox-cdn.com/uploads/chorus_asset/file/11442563/slice4.jpg)
Yet despite our small biomass among animals, we’ve had an overwhelmingly huge impact on the planet. The chart above represents a massive amount of life. But it doesn’t show what’s gone missing since the human population took off.
The authors of the PNAS article estimate that the mass of wild land mammals is seven times lower than it was before humans arrived (keep in mind it’s difficult to estimate the exact history of the number of animals on Earth). Similarly, marine mammals, including whales, are a fifth of the weight they used to be because we’ve hunted so many to near extinction.
And though plants are still the dominant form of life on Earth, the scientists suspect there used to be approximately twice as many of them — before humanity started clearing forests to make way for agriculture and our civilization.
The census in the PNAS paper isn’t perfect. Though remote sensing, satellites, and huge efforts to study the distribution of life in the ocean make it easier than ever to come up with estimates, the authors admit there’s still a lot of uncertainty. But we do need a baseline understanding of the distribution of life on Earth. Millions of acres of forests are still lost every year. Animals are going extinct 1,000 to 10,000 faster than you’d expect if no humans lived on Earth. Sixty percent of primate species, our closest relatives on the tree of life, are threatened with extinction.
We have to know how much more we stand to lose.
QUESTION: Mr. Armstrong; Did you run a model on Florida hurricanes before you moved there?
KE
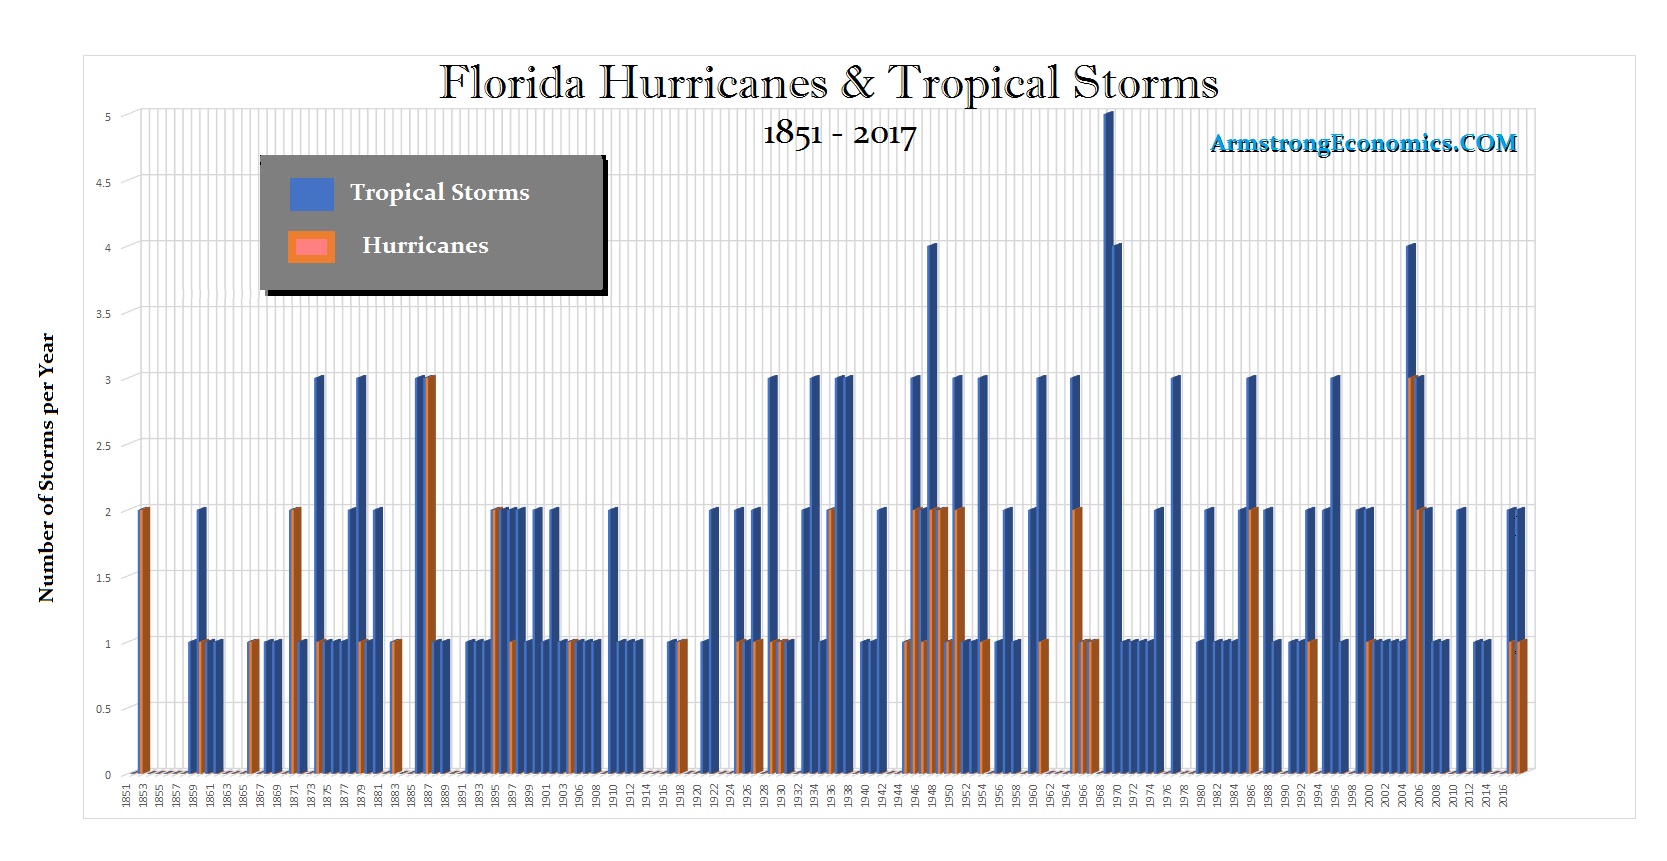
ANSWER: Of course. First of all, I chose Tampa area because it is the least impacted area. The local joke here is that the people say the Indian gods protect the area. This is where the Seminole Indians set up. They apparently also figured out this was the least impacted area. Nevertheless, I also ran models on tropical storms and hurricanes for Florida as a whole. The data I found went back to 1851. There have been 53 hurricanes since then into 2017. Divide that out to see what the average is and you get 3.132. Pretty close to Pi. This is just hurricanes excluding the lesser tropical storms.
If I include the 200 tropical storms since 1851 into 2017, the average comes out to about half Pi – 1.524. Then you filer it all out with volatility and intensity, as we should be going into a period of more storms per year into 2020.
There will always be earthquakes, volcanoes, storms and all sorts of disasters around the world. Most of us will not be personally injured by such events. However, knowing where they take place more commonly allows you to avoid higher probabilities. So Tampa was simply far better than Miami, which is sinking gradually anyway and the traffic is way too much. I figured I would spend 20% of the balance of my life in traffic jams. No thanks! So disclosing the risks enables us to prepare wisely. It also interesting to see nature at its cyclical bes
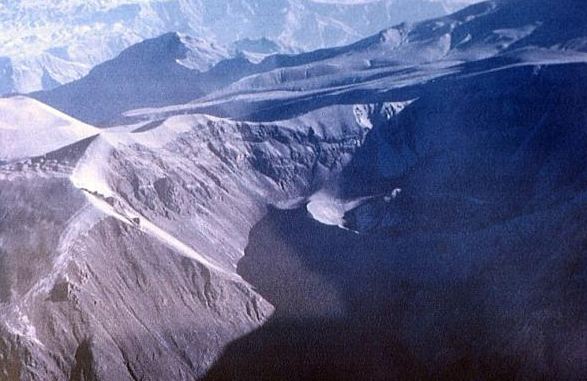
In the upland region of Southern Peru, there is a volcano by the name of Huaynaputina which to this day remains one of the largest ever to erupt in South America. It exploded on February 19th, 1600, and is recorded as the largest volcanic explosion ever in South America. However, studies have shown around the world that this volcano indeed altered the climate and took place during a solar minimum. Scientists now believe that its eruption had a devastating effect around the world both in Europe as well as in China and Korea. This impacted the agriculture and further the contagion cycles from disease. In fact, the Great Famine in Russia was caused by this eruption. The Russian famine of 1601–1603 was Russia’s worst famine in terms of a proportional effect on the population. More than two million people starved to death which was one-third of the Russian people. The famine compounded the Time of Troubles and weakened Russia allowing it to be invaded by the Polish-Lithuanian Commonwealth. This famine was part of worldwide record cold winters and crop disruption, which geologists in 2008 linked to the 1600 volcanic eruption of Huaynaputina in Peru which has been classified as a VEI6 putting some 30 cubic kilometers of earth into the sky more than 8 miles high. Contemporary accounts state that some regions did not see the sun for two months. Without the sun, crops fail.
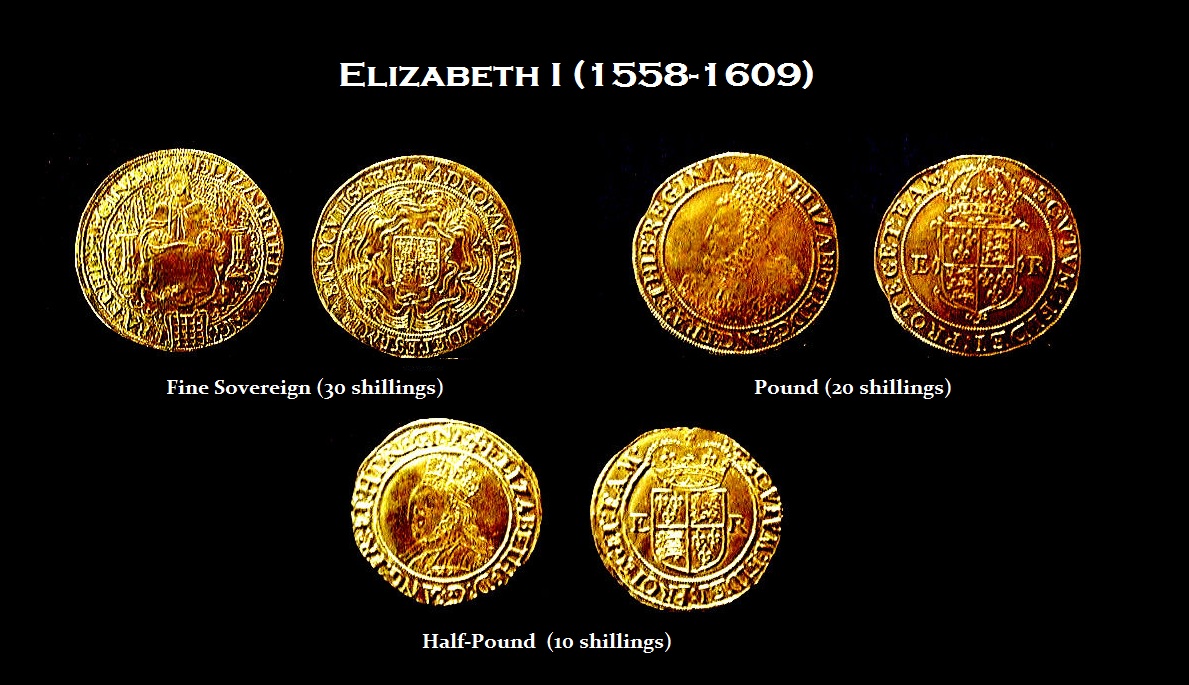
We even see the impact in the English coinage it is impossible to determine the coinage during this crisis for coins were not dated until 1642 under Charles I. The standard of living dropped significantly during the final years of the reign of Elizabeth I (1558-1603). This led to a surge in homeless which had repercussions for the country as a whole. Elizabeth’s government set about trying to tackle this problem by introducing a series of Acts which acknowledged that the care of the poor was now the community’s responsibility and that each citizen had to play his part. In this respect, the Poor Laws were progressive for their time certainly established a framework which lasted for many years to come.
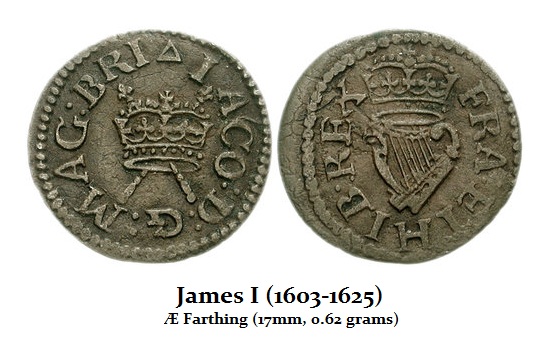 English coins were made in only gold or silver until 1613 when James I granted a patent to Lord Harrington to produce copper royal farthings. Coated with tin to look like silver, the so-called Harrington farthing was not worth the copper used to produce it and was rejected by people in England. The value of cash rose creating deflation. This is the first time we see bronze coins introduced in Britain which also coincide with this major volcanic eruption.
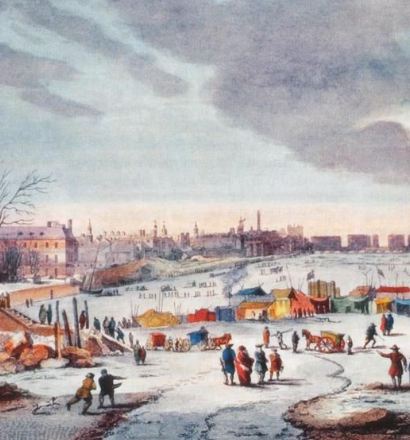
While this eruption was in 1600, it certainly appears that it contributed to the hard times of the period. The weather turned cold into the end of that century. A detail from Frost Fair on the River Thames near the Temple Stairs in 1683–1684 depicts a festival taking place on the frozen river, one of a number of so-called Frost Fairs celebrated in London during exceptionally cold winters during the 17th century known as the Little Ice Age. This engraving, published in 1825, was based on an earlier painting by the seventeenth-century artist Thomas Wyke.
The Chinese have also researched the impact of this event in Peru upon their climate and economy. The weather has drastically affected in China and the Korean Peninsula. The contemporary accounts have been examined revealing that historical evidence points to the conclusion that the eruption was followed by an abrupt cooling period and epidemic outbreaks in 1601 AD within both China and the Korean Peninsula.
Just one major volcanic eruption can send food prices sky-high. According to our computer, we show food prices rising from 2020 into 2024. The computer is calculating everything and correlating eveny type of data we have assembled. Its forecasts are based upon that intense correlation.
COMMENT: Mr. Armstrong; I am a loyal reader from Java. We have a big volcano here which has started to show life. The government has just put out a warning that it may erupt. I really find your work so interesting. You said 2018 would see a rise in volcanic activity along the Pacific rim of fire. Well, it appears after Hawaii, we could be next.
PM
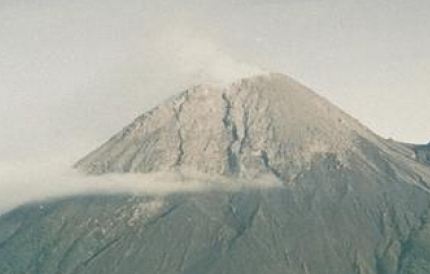
REPLY: Yes. This particular volcano is like that of Hawaii insofar as it is much more active. Pyroclastic flow from a large explosions took place November 22nd, 1994. Another large eruption occurred in 2006, shortly before the Yogyakarta earthquake. There was also a large eruption in 2010 that changed the characteristic of Mount Merapi. Then on March 10th, 2014, Mount Merapi erupted early that Monday causing a thick-pyroclastic surge that shot 1,500 meters up in the air. We are now due for another event so this one is on schedule for 2017/2018.
Normally, small eruptions occur every two to three years, and larger ones every 10–15 years or so. However, the real major eruptions have occurred in 1006, 1786, 1822, 1872, and 1930. The eruption of 1006 is claimed to have covered all of central Java with ash. It was that volcanic eruption that is believed to have caused the collapse of the Hindu Kingdom of Mataram. This is akin to the destruction of the Minoan society when Thera erupted around 1650BC – today Santorini.
According to our model, the next BIG ONE is probably due in 2028, which may be at the 1006 eruption magnitude.
Here is the list of eruptions since we have consistent recorded history:
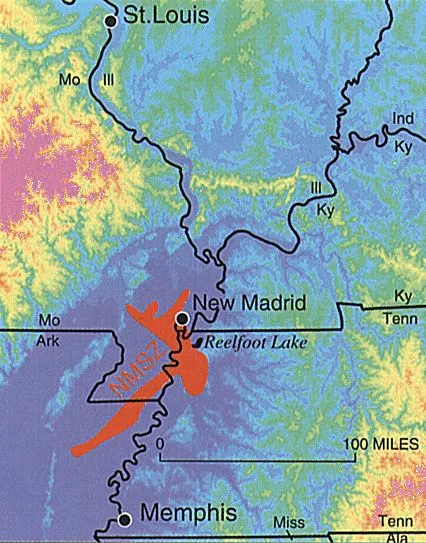
QUESTION: This is the start of more volcanic and earthquake activity. Everyone thinks about the west coast when they think about quakes, but what about the center of the country and the New Madrid fault. What is the timeline for it
GB
ANSWER: The last big one was 1811-1812. There were actually four earthquakes during this period between December to February with the last one sending the Mississippi River reversing its course and flowing North for a brief period. The first struck on December 16th, 1811 at 2:15 am with an epicenter in northeast Arkansas. The second struck the same day December 16th, 18,11 which the sun was rising at 7:15 am still with the epicenter in northeast Arkansas. The third struck on January 23rd, 1812 at 9:15 am with an epicenter around New Madrid, Missouri. The third earthquake to strike was February 7th, 1812 at 3:45 am with an epicenter near New Madrid, Missouri.
This one appears to be due in 2035. However, we have some additional data that was recently given to us with the more minor events post-1811. There was a flurry of small quakes in 2017. We are running this through our models to see what it comes up with. We will report on the results of that correlation when complete to see if that changes the due date
I have created this site to help people have fun in the kitchen. I write about enjoying life both in and out of my kitchen. Life is short! Make the most of it and enjoy!
De Oppresso Liber
A group of Americans united by our commitment to Freedom, Constitutional Governance, and Civic Duty.
Share the truth at whatever cost.
De Oppresso Liber
Uncensored updates on world events, economics, the environment and medicine
De Oppresso Liber
This is a library of News Events not reported by the Main Stream Media documenting & connecting the dots on How the Obama Marxist Liberal agenda is destroying America
Australia's Front Line | Since 2011
See what War is like and how it affects our Warriors
Nwo News, End Time, Deep State, World News, No Fake News
De Oppresso Liber
Politics | Talk | Opinion - Contact Info: stellasplace@wowway.com
Exposition and Encouragement
The Physician Wellness Movement and Illegitimate Authority: The Need for Revolt and Reconstruction
Real Estate Lending
