George Orwell, “Who controls the past controls the future. Who controls the present controls the past.”
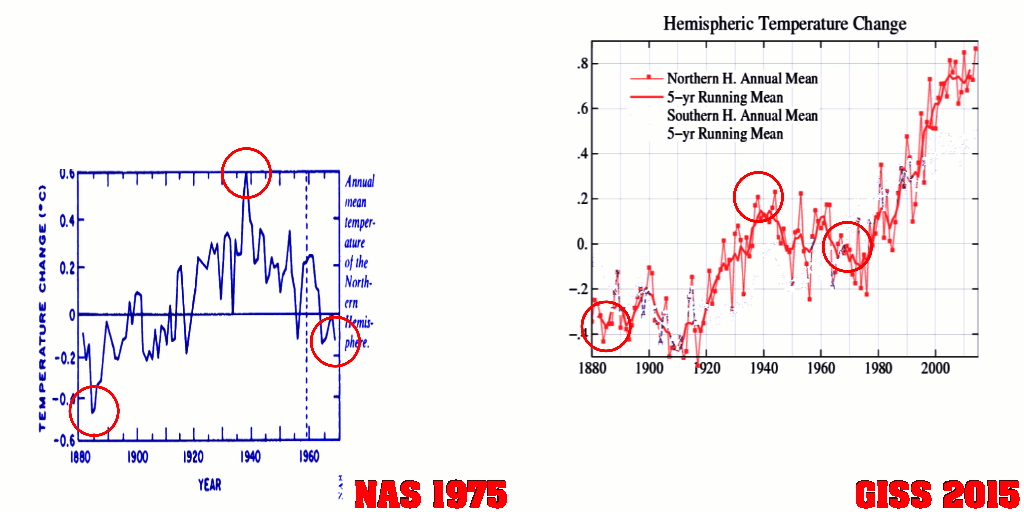
In 1975, the National Academy Of Sciences published this graph, showing about 1°C warming in the Northern Hemisphere from 1885 to 1940, and that all 1900 to 1940 warming was lost by 1970.
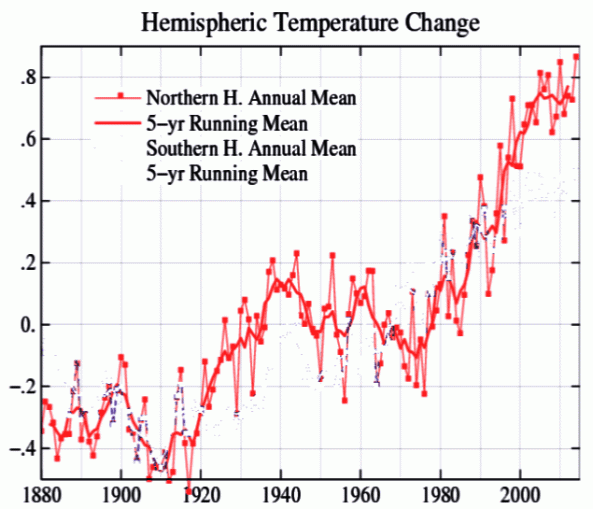
GISS has since reduced the 1885 to 1940 warming by half, and reduced the 1940-1970 cooling by two thirds.
The next graph shows an overlay of the two at the same scale, normalized to 1905-1940
The animation below shows how they reduced both the pre-1940 warming, and the post-1940 cooling. Neither are explainable by global warming theory, so government experts made both largely disappear.
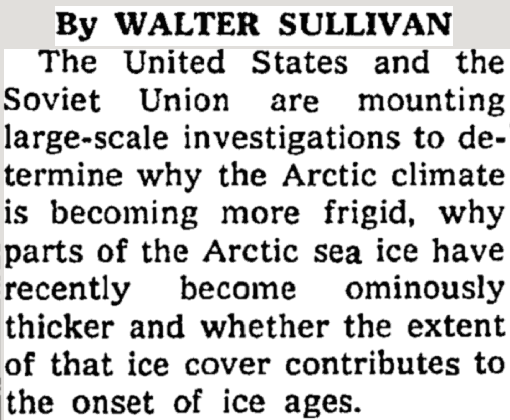
So which one is correct? In 1923, the Arctic was very warm and melting rapidly.
But inn 1970, the Arctic was very cold, and ice was expanding rapidly.
The 1975 NAS graph makes…
View original post 63 more words


