
Part Five Geological Facts
This will be a short section placed here to show what the past was until recently when all this history mysteriously disappeared. The point to these Charts is that climate has NEVER been a constant with global temperatures ranging from a low of around 12 degrees C to a high of around 22 degrees C and CO2 ranging from under 300 ppm to as high as 7,000 ppm. We are presently at 400 ppm CO2 with a global temperature of around 14.6 degrees C which is historically low as can be seen on the following chart going back 600 million years. It would seem that a mean temperature of 17 degrees C, as shown here, and a CO2 level of over 1000 ppm would be more normal then what we have now so why the hysterical political movement to control CO2?

The next chart is more current going back to the last ice age some 11,000 years ago. This chart is particularly interesting as it shows that there have been 4 cycles of cold and warm going back over 4,000 year. Based on those 4 cycles and considering the difficulty of determining exact dates and temperatures it can be said that over the past four thousand years there have been 4 cycles of about one thousand years duration with an amplitude of maybe 1.5 degrees C. And we are what would appear to be a peak of the forth cycle, indicating that we can expect a downward movement to start in the next hundred years or so. Based only on this observation It should be possible to develop a model that would be valid over this period of time and where we have human records to support these temperature changes.

However, there are also some significant temperature variations with shorter durations as shown on the next Chart. This Chart is of the Atlantic Multidecadal Oscillation or AMO where there appears to be a 60 some year cycle of under one degree C there is also a larger cycle in the pacific known as La Nina and El Niño.

The Pacific variations are not as consistent as those in the Atlantic are,but there is a greater variation as can be seen in the next chart where the La Nina and El Nino events are shown as a multivariate index called the ENSO.
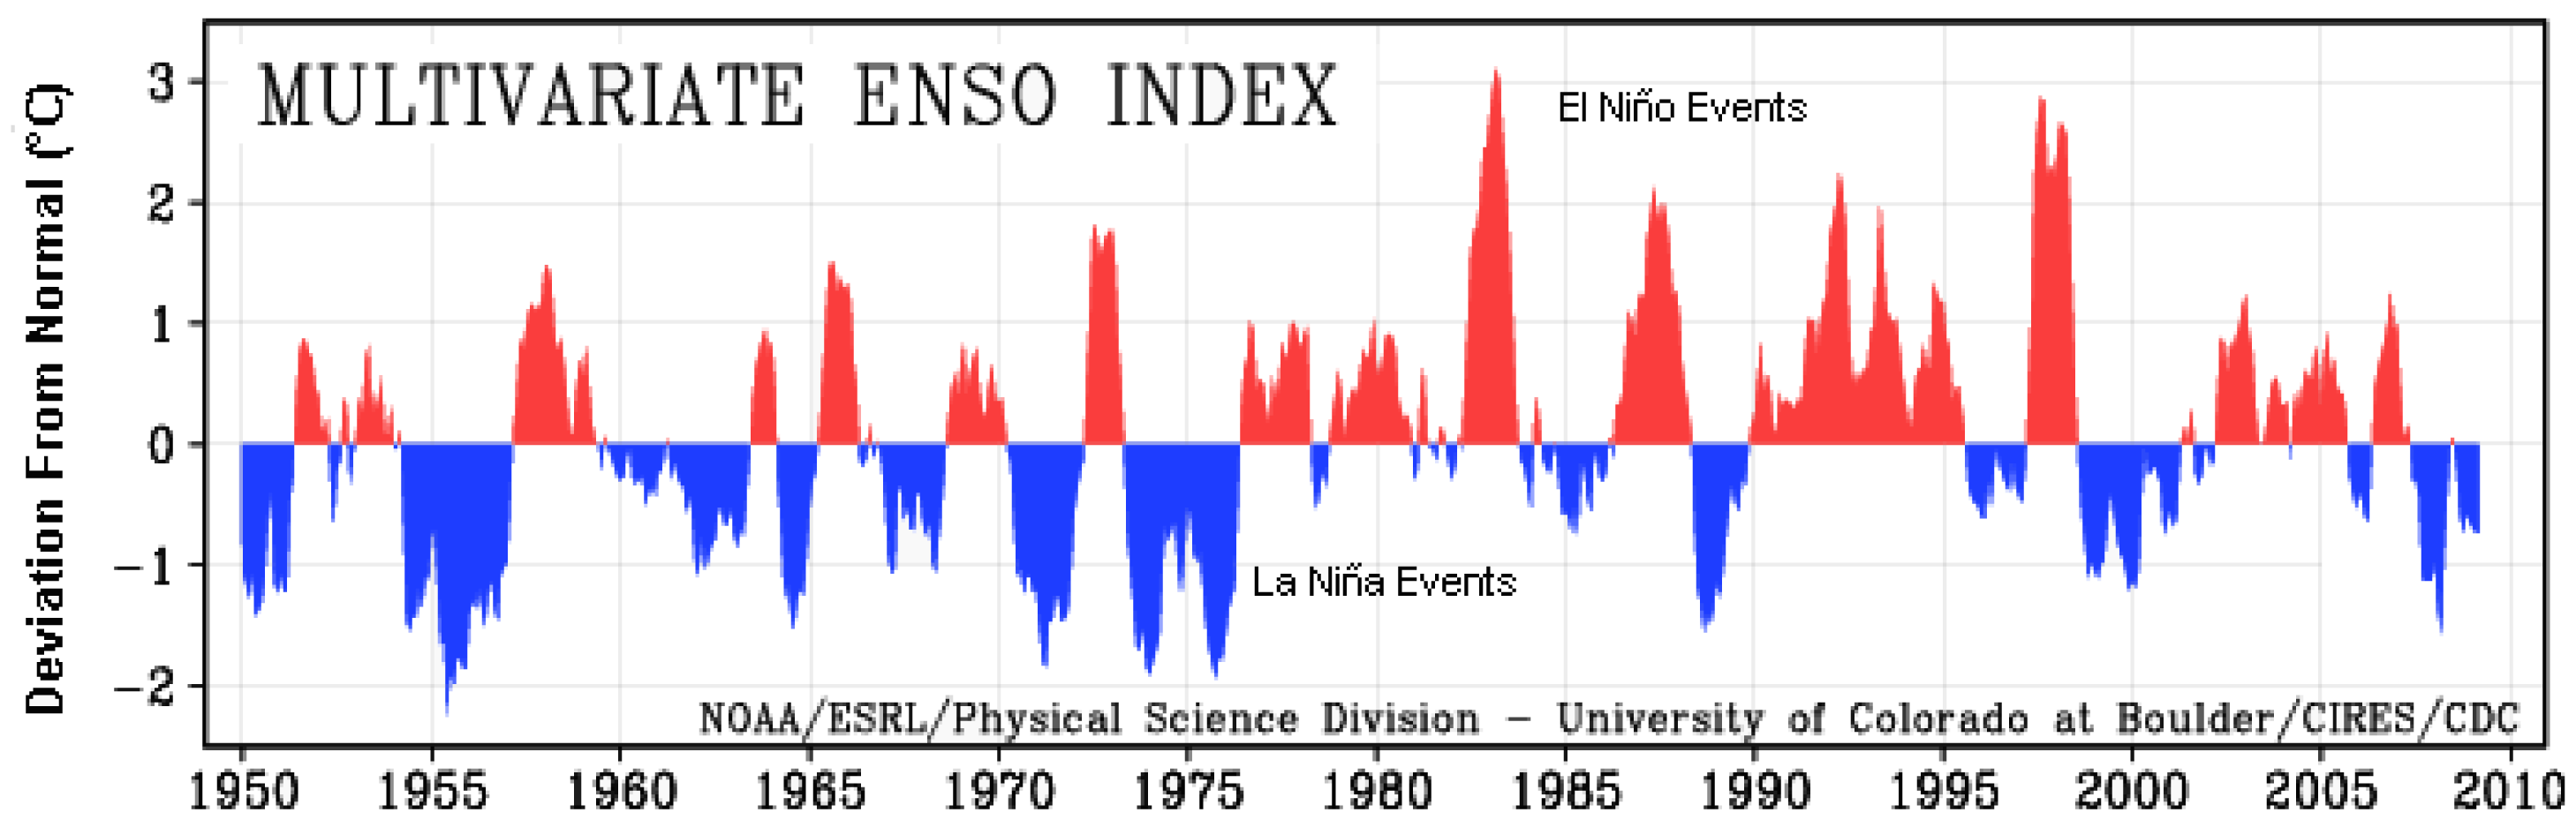
The purpose to showing this four Charts is to establish that there are geological and even decadal variations in climate and none of these have anything to do with mankind or CO2; therefore any proper theory of Climate must consider these variables as a base to work from. Only when that is done can considerations be given to things like Carbon Dioxide, which probably is only a bit player in Climate.
In the next section we’ll put this all together and show what is really happening with Global Climate and also why the Warmists and their obedient media are so wrong.
