Obama Expected to Bind US to CO2 Reduction at Paris Climate Meeting This Year


In his State-of-the-Union address, president Obama again confirmed that “saving the climate” remains one of his top priorities.  Yet an official December 2014 confab in Lima, Peru didn’t really conclude anything — certainly no binding Protocol to limit emissions of carbon dioxide (CO2) — but it “kicked the can down the road” to the next international gabfest in Paris, scheduled for 2015.

The world is looking forward to the 21st annual COP (conference of the parties to the global climate treaty), which will be held in Paris in December of 2015.  It is hoped by many that Paris will end up with a climate protocol that will continue and even surpass the Kyoto Protocol of 1997, which expired in 2012 and achieved practically nothing except to waste hundreds of billions that might have been better spent addressing genuine world problems — without accomplishing its main goal of reducing global emissions of the much-maligned greenhouse gas CO2.  On the contrary, emissions rose — mainly from greatly increased industrial growth in China, which was fueled primarily by coal-fired power plants.  At the same time, of course, global agriculture benefited from these higher levels of CO2, which is a natural plant fertilizer; the starving of the world really owe a vote of thanks to China.

Three “big guns” billionaires –Tom Steyer, Hank Paulson, Mike Bloomberg — have already pledged their support for Paris; various scientific groups have already issued alarming Statements, without even the pretense of agreement from their memberships; even the Vatican’s Pope Francis plans to get into the act.

The Paris pattern

It is not at all difficult to predict what will happen in Paris; in fact, it is a “no-brainer.”  There will be an agreement of sorts, but it will be essentially meaningless.  Yet it will be hailed as a “breakthrough” by the White House and thus form an important part of the “Obama Legacy.”

The basic pattern for Paris has been set already by the US-China agreement of Nov 12, 2014.  China agreed to do nothing until at least 2030 — just continue to emit ever-increasing amounts of carbon dioxide, with a peak at around 2030 (they say).  By that time, it can be safely predicted that energy demand in China will have been saturated.  Population may have stabilized and every household will have accumulated all of the gadgets they need to make life pleasant: Television, refrigerators, air conditioning, and the other baubles common in the wealthy countries.  Has China finally decided to “fight climate change”?  My personal opinion is that China is taking advantage of White House science ignorance and anxiety about future climate change, hoping thereby to gain commercial and strategic advantages against the United States.

Other nations

Following the China example, India may decide to adopt the China pattern and let their emissions peak around 2050, let’s say; other countries will choose their dates accordingly.  In other words, everybody will be doing their own thing, but there will be some kind of “agreement” that they will all be happy to sign — or be bribed into signing.

Significantly, Japan, Canada, and Australia, will no longer follow this pattern and will likely refuse to have anything to do with the Paris accord

At the same time, the US and European Union will undertake to seriously reduce CO2 emissions by another 26-28% in the next 10 years.  For the US, a 40% reduction by 2030; for the EU, at great cost to their economies and to the standard of living of their populations.

President Obama has already signed an Executive Order March 19 directing the federal government to cut its greenhouse-gas emissions by 40 percent from 2008 levels over the next decade, and to increase the share of renewable energy in the government’s electricity supply to 30 percent over the same period. The New York Times reports the federal government’s greenhouse gas emissions are less than one percent of total US emissions, although the federal government is the single biggest user of energy in the U.S.

Obama’s war on coal is indeed making electricity prices “skyrocket” — just as he promised in 2008, when he ran for president.  Voters were beguiled by the vision of “slowing the rise of the oceans” and of “saving the climate.”  Little did they realize that they were being fed nonsensical science and that high energy prices would instead lead to the growth of poverty.  Had they had the good sense to look at the European experience, they might have rejected Obama’s siren song.  Blame, if you will, the mainstream media, TV, Hollywood, Greenpeace, Sierra Club, and the rest of the green lobby.  George W. Bush could have saved the situation but he didn’t.

Meanwhile, many of the States are banding together to fight EPA’s “Clean Power Plan” in the courts.  In addition, Congress is reminding the White House that any US commitment in Paris can be cancelled by a future president.

The question is whether such an agreement is binding on the United States.  The White House will attempt to argue that this is an international agreement and not a Treaty that has to be sent to the Senate for ratification.  However, Congress will argue otherwise and will announce that any Paris agreement is an executive one, not binding on the United States, revocable by future presidents.

The US Senate will recall that in 1997 they voted unanimously for the Byrd-Hagel Resolution against any unilateral US restriction on emissions — if it results in economic damage.  Senator Byrd (D-WV) wanted to protect coal mining; Hagel (R-NE) wanted to protect the US from unfair economic competition.  It is interesting that our Secretary of State, John Kerry, voted for Byrd-Hagel at that time, as well as some other senators, like firebrand Barbara Boxer. Chuck Hagel is no longer a US Senator but we hope he will step up and remind people of his 1997 Resolution.

No significant warming for past 18 years

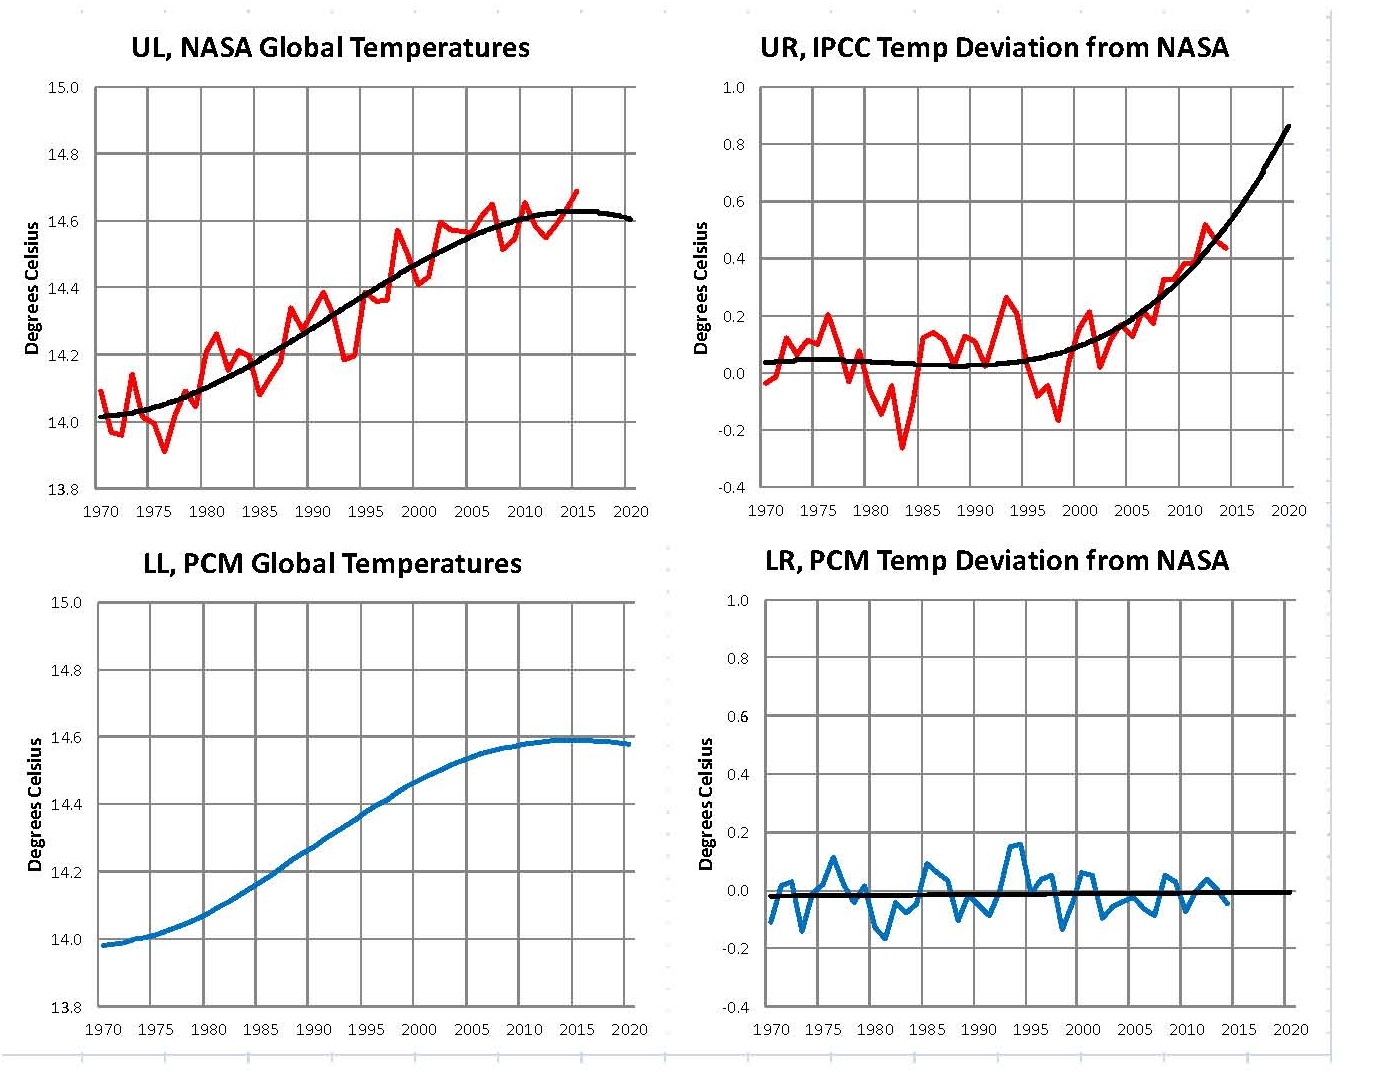
Meanwhile, the climate continues to plateau; no significant warming has occurred in nearly 20 years — in spite of a greater than 10% increase in CO2.

Scientists, both alarmists and skeptics, are still trying to explain this “pause” — as it is sometimes called.  The word Pause denotes an expectation that the climate will again warm — although no one has any acceptable hypothesis as to when the warming might resume, if ever.

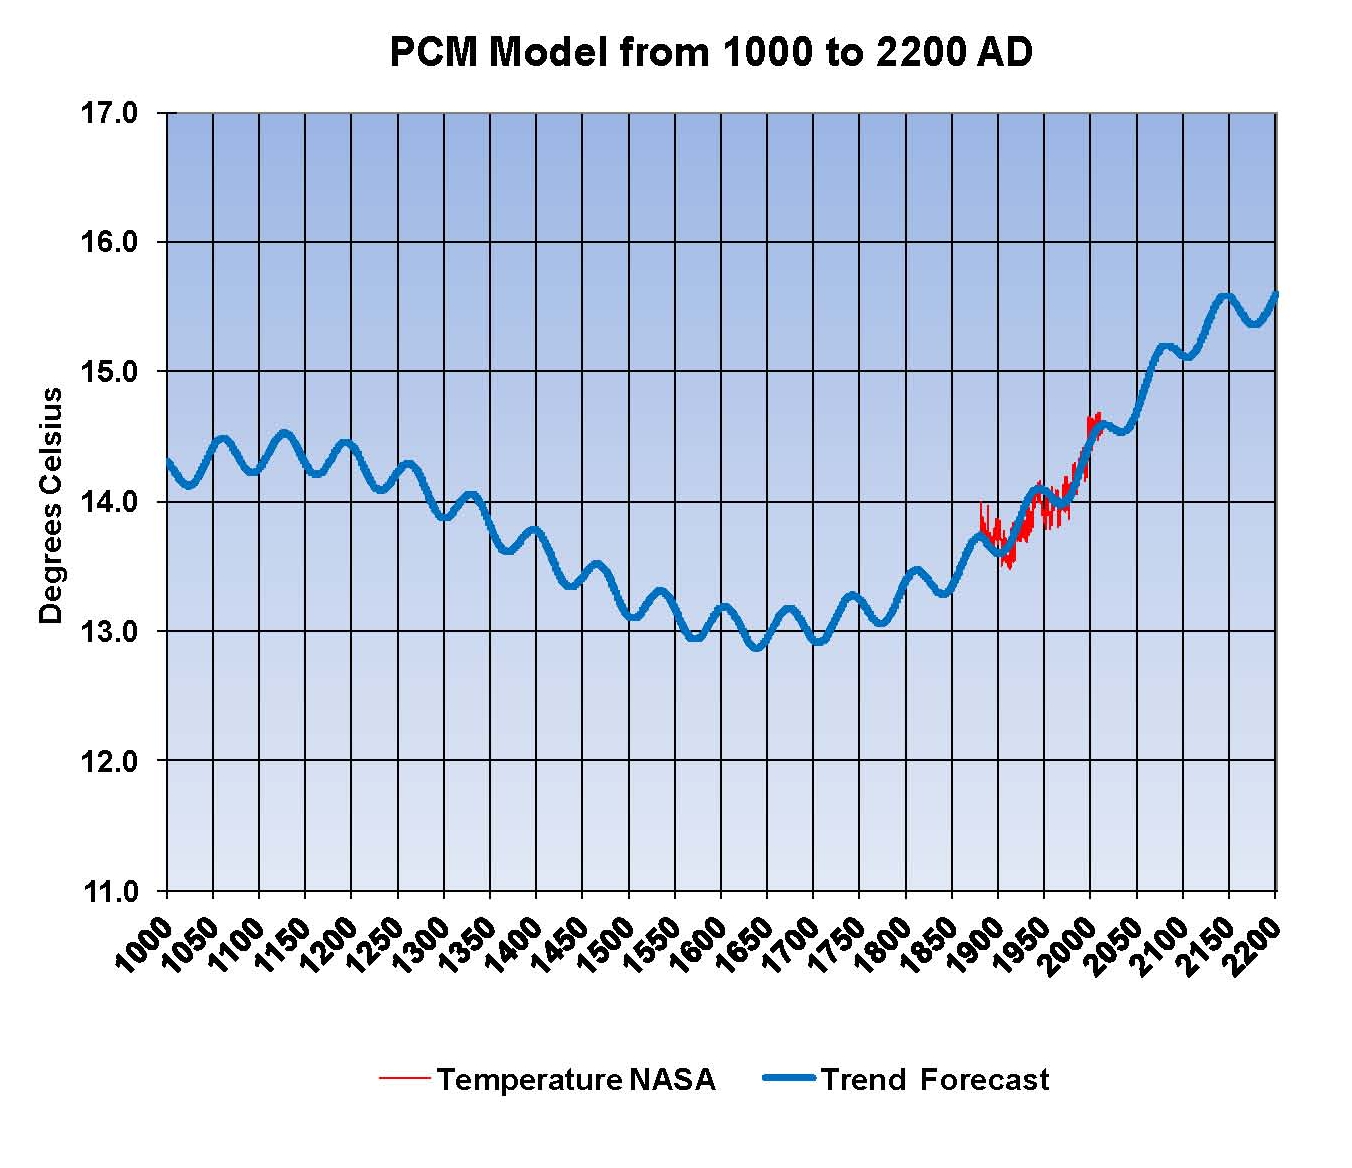
But since climate has historically moved in cycles, and since we expect a recovery from the Little Ice Age of 1400-1850, we expect to see some natural warming in the next hundred to two hundred years.  On the other hand, since the present interglacial (“Holocene”) period has now lasted 12,000 years, longer than the average interglacial within the last million years or so, many predict the onset of another full glaciation.

It would be extremely ironic if another such a glaciation were to start shortly after a Paris agreement that is trying to prevent a global warming.

S. Fred Singer is professor emeritus at the University of Virginia and director of the Science & Environmental Policy Project.  His specialty is atmospheric and space physics.  An expert in remote sensing and satellites, he served as the founding director of the US Weather Satellite Service and, more recently, as vice chair of the US National Advisory Committee on Oceans & Atmosphere.  He is a Senior Fellow of the Heartland Institute and the Independent Institute.  He co-authored NY Times best-seller Unstoppable Global Warming: Every 1500 years.  In 2007, he founded and has chaired the NIPCC (Nongovernmental International Panel on Climate Change), which has released several scientific reports [See NIPCCreport.org].  For recent writings see http://www.americanthinker.com/s_fred_singer/ and also Google Scholar.

Analysis of Global Temperature Trends, March 2015 What’s really going on with the Climate?


The analysis and plots shown here are based on the following: first NASA-GISS temperature anomalies (converted to degrees Celsius so non-scientists will understand the plots) as shown in their table LOTI, second James E. Hansen’s Scenario B data, which is the very core of the IPCC Global Climate models (GCM’s) and which was based on a CO2 sensitivity value of 3.0O Celsius, lastly, a plot based on an alternative climate model designated ‘PCM’ and based on a sensitively value of .65O Celsius.

An explanation of the alternative model designated PCM is in order since many have interpreted this PCM model as a statistical least squares projection of some kind and nothing could be further from the truth. A decade ago when I started this work the first thing I did was look at geological temperature changes since it is well known that the climate is not a constant; I learned that in my undergrad geology and climatology courses in 1964. One quickly finds that there is a clear movement in global temperatures with a 1,000 some year cycle going back at least 3,000 to 4,000 years; probably because of the apsidal precession of about 21,000 years for a complete cycle. However about every 10,000 years the seasons are reversed making the winter colder and the summer warmer (northern hemisphere) 10,000 years from now. There are also 60 to 70 year cycles in the Pacific and the Atlantic oceans that are well documented. We also know that there are greenhouse gases such as Carbon Dioxide and the National Academy of Sciences (NAS) estimated that Carbon Dioxide had a doubling rate of 3.0O Celsius plus or minus 1.5O Celsius in 1979

The IPCC still uses the NAS 3.0O Celsius as the sensitivity value of Carbon Dioxide and a number in that range is required to make the IPCC GCM’s work. The problem with using this value is it leaves no room for other factors and hence the need of the infamous Hockey Stick plots of the IPCC from Mann, Bradley & Hughes in 1999. The PCM model is based on a much lower value for Carbon Dioxide consistent with current research which places the value between 0.65O and 1.5O Celsius per doubling of Carbon Dioxide. If the long and short movement in temperatures and a lower value for Carbon Dioxide are properly analyzed and combined a plot that matched historical and current (non manipulated) NASA temperature estimates very well can be constructed. This is not curve fitting.

The PCM model is such a construct and it is not based on statistical analyses of raw data. It is based on creating curves that match observations (which is real science) and those observations appear to be related to the movement of water in the world’s oceans. The movements of ocean currents is well documented in the literature all that was done here was properly combine the separate variables into one curve which had not been previously done. Since this combined curve is an excellent predictor of global temperatures unlike the IPCC GCM’s it appears to reflect reality a bit better than the convoluted IPCC GCM’s which after the past 19 years of no statistical warming have been shown to be in error.

Now, to smooth out highly erratic monthly variations a 12 month running average is used in all the plots. This information will be shown in four tables and updated each month as the new data comes in about the middle of the month. Since no model or simulation that cannot reasonably predict that which it was design to do is worth anything the information presented here definitively proves that NASA, NOAA and the IPCC just don’t have a clue.

000 2015-03 a

The first plot, UL is a plot of the NASA temperature anomaly converted to degrees Celsius and shown in red with a black trend line added. There has been a very clear reversal in the upward movement of global temperatures since about 2001 and neither the UN IPCC nor anyone else has an explanation for this 13 years later. Since CO2 has continued to increase at what could be argued an increasing rate this raises serious doubts about the logic programmed into all the IPCC global climate models.

The next plot UR, also in red, shows the IPCC estimates of what the Global temperature should be, based on Hansen’s Scenario B, with the NASA actual temperatures’ subtracted from them. Therefore this plot represents a deviation from what the Climate “believers” KNOW what the temperature should be; with a positive value indicating the IPCC values are higher than actual and a negative value indicating the IPCC values are lower than actual, as measured by NASA. A black trend line is added and we can clearly see that the deviation from expected is increasing at an increasing rate. This makes sense since the IPCC models project increased temperatures based primarily on the increasing level of CO2 in the earth’s atmosphere. Unfortunately, for them, the actual temperatures from NASA are trending down (even as they try to hide the down ward movement with data manipulation) since other factors are in play, therefore each year the gap between them widens. Since we have 13 years of observations’ showing this pattern it becomes hard to justify a continuing belief in the IPCC climate models, there is obviously something very wrong here.

The next plot LL shown in blue is based on the equations in the PCM climate model described in previous papers and posts here and since it is generated by “equations” a trend line is not needed. As can be seen the PCM, LL, and the NASA, UL, trend plots are very similar the reason being that in the PCM model there is a 68.2 year cycle that moves the trend line up and then down a total of .30O Celsius (currently negative .0070O Celsius per year); and we are now in the downward portion of that trend which will continue until around 2035. This short cycle is clearly observed in the raw NASA data in the LOTI table going back to 1868. Then there is a long trend, 1052.6 years with an up and down of 1.36O Celsius (currently plus .0029O Celsius per year) also observed in the NASA data. Lastly there is CO2 adding about .005O Celsius per year so they basically wash out which matches the current holding pattern we are experiencing. However within a few years the increasing downward trend of the short cycle will overpower the other two and we will see drop of about .002O Celsius per year and that will be increasing until till around 2025 or so. After about 2035 the short cycle will have bottomed and turn up and all three will be on the upswing again. These are all round numbers shown here as representative values.

The last plot LR in blue uses the same logic as used in the UR plot, here we use the PCM estimates of what the Global temperature should be with the NASA actual temperatures’ subtracted from them. A positive value indicates the PCM values are higher than actual and a negative value indicates the PCM values are lower than expected. A black trend line was added and it clearly shows that the PCM model is tracking the NASA actual values very closely. In, fact since 1970 the PCM model has rarely been off by more than +/- .1 degrees Celsius and has an average trend of almost zero error, while the IPCC models are erratic and are now approaching an error rate of +.5O above expected.

In summary, the IPCC models were designed before a true picture of the world’s climate was understood. During the 1980’s and 1990’s CO2 levels were going up and the world temperature was also going up so there appeared to be correlation and causation. The mistake that was made was looking at only a ~20 year period when the real variations in climate move in much longer cycles. Those other cycles can be observed in the NASA data but they were ignored for some reason. By ignoring those trends and focusing only on CO2 the models will be unable to correctly plot global temperatures until they are fixed.

Lastly the next Chart shows what a plot of the PCM model would look like from the year 1000 to the year 2200. The plot matches reasonably well with history and fits the current NASA-GISS table LOTI date very closely, despite homogenization. I understand that this model is not based on physics but it is also not curve fitting. It’s based on observed reoccurring patterns in the climate. These patterns can be modeled and when they are you get a plot that works better than any of the IPCC’s GCM’s. If the conditions that create these patterns do not change and CO2 continues to increase to 800 ppm or even 1000 ppm than this model will work into the foreseeable future. One hundred fifty years from now global temperatures will peak at around 15.5 to 15.7 degrees C and then will be on the downside of the long cycle for the next 500 years. The overall effect of CO2 reaching levels of 1000 ppm or even higher will be between 1.0 and 1.5 degrees C which is about the same as that of the long cycle.

Carbon Dioxide is not capable of doing what Hansen and Gore claim!

000 2015-03 b

The purpose of this post is to make people aware of the errors inherent in the IPCC models so that they can be corrected.

The Obama administration’s “Need” for a binding UN climate treaty with mandated CO2 reductions in Europe and America means there will be such a resolution presented at the COP12 conference in Paris in December. To support this NASA will be forced to show ever increasing global temperatures for the rest of 2015 that will make less and less sense based on observations and satellite data which will all be dismissed or ignored.

Sir Karl Raimund Popper (28 July 1902 – 17 September 1994) was an Austrian and British philosopher and a professor at the London School of Economics. He is considered one of the most influential philosophers of science of the 20th century, and he also wrote extensively on social and political philosophy. The following quotes of his apply to this subject.

If we are uncritical we shall always find what we want: we shall look for, and find, confirmations, and we shall look away from, and not see, whatever might be dangerous to our pet theories.

Whenever a theory appears to you as the only possible one, take this as a sign that you have neither understood the theory nor the problem which it was intended to solve.

… (S)cience is one of the very few human activities — perhaps the only one — in which errors are systematically criticized and fairly often, in time, corrected

The Death Spiral Flatlines


The problem is no one is interested in the truth any more!

Tony Heller's avatarReal Climate Science

Early this year, government agencies began projecting what their next big Arctic lie was going to be, and one month ago it became official.

ScreenHunter_8583 Apr. 15 05.15Arctic sea ice reaches lowest maximum extent on record | Arctic Sea Ice News and Analysis

A month later, it is clear that not only was that claim extremely suspect, but there has also been no net ice extent loss since early March.

icecover_current (26)

Ocean and Ice Services | Danmarks Meteorologiske Institut

View original post

“You Can’t Have Your Own Set Of Facts”


In today’s world facts do not matter — the only thing that matters is the seriousness of the claim, as Rush constantly tells us.

Tony Heller's avatarReal Climate Science

Barack Obama lives in a world of make believe facts, which he basically pulls out from where the sun never shines. Then he tells others that his lies are the only acceptable facts.

ScreenHunter_8585 Apr. 15 05.30

He promised to lower health care costs by $2,500 for the typical family during his first term in office.

ScreenHunter_8588 Apr. 15 05.41

Health Plan From Obama Spurs Debate – NYTimes.com

Instead of lowering health care costs, he increased them in almost every state and added a massive 2.5% Obamacare tax

ScreenHunter_8586 Apr. 15 05.31Now There Can Be No Doubt: Obamacare Has Increased Non-Group Premiums In Nearly All States – Forbes

Last week he claimed that his daughter’s asthma was caused by diminished air quality due to global warming, but the EPA shows the exact opposite – that US air quality has dramatically improved since he was a child – and continues to get better

ScreenHunter_8584 Apr. 15 05.27

Air Pollution and the Clean Air Act | US Environmental Protection Agency

View original post 26 more words

Catastrophic Global Warming Theory Is Dead


The very fact that we are here means there are no positive feedback that dominant the climate. CO2 has been in the past much higher than it is now.

Tony Heller's avatarReal Climate Science

Radiative transfer models show that adding more CO2 to the atmosphere doesn’t have much affect on temperature, so Hansen made up a psychotic theory of positive feedbacks, which were going to push the Earth past a “tipping point.”

The most important feedback was loss of polar sea ice, which was theorized to amplify global warming. This hasn’t happened. In fact the amount of sea ice on Earth may challenge record levels later this year.

ScreenHunter_8590 Apr. 15 06.08

timeseries.global.anom.1979-2008

If positive feedbacks dominated, Earth would have passed many tipping points in the past. But like all long standing systems, negative feedbacks dominate and keep the climate relatively stable.

All real scientists understand this, which is why climate scientists don’t.

View original post

Hearing: President’s UN climate pledge


Dr. Curry is one a few few real scientists that are left in the country, too many have been corrupted my the money.

curryja's avatarClimate Etc.

by Judith Curry

The House of Representatives Committee on Science, Space and Technology Hearing on the President’s UN Climate Pledge has now concluded.

View original post 618 more words

You think all of this is nailed in the models?


If you use a more realistic CO2 sensitivity value of under 1.0 degree C than the natural climate movements such as the AMO can be used to make a model that works. If the natural movements are dismissed you are forces to use the higher IPCC value of 3.0 degrees C and you are traped in a system that can not work.

Bob Greene's avatarJunkScience.com

I ran across three articles that further convince me that it’s foolish to use climate models to direct the U. S. or global economies.

View original post 171 more words

Temperature Data Tampering For Propaganda Purposes Vs. Actual Science


If you use a 12 month running average it really shows up.

Tony Heller's avatarReal Climate Science

ScreenHunter_1508 Apr. 14 11.30

ScreenHunter_1509 Apr. 14 11.31

View original post

Ron Clutz On The AMO


I use AMO in my Climate Model as one of three factors and it works very well!

Pitfalls in climate sensitivity estimation: Part 2


niclewis's avatarClimate Audit

A guest post by Nicholas Lewis

In Part 1 I introduced the talk I gave at Ringberg 2015, explained why it focussed on estimation based on warming over the instrumental period, and covered problems relating to aerosol forcing and bias caused by the influence of the AMO. I now move on to problems arising when Bayesian probabilistic approaches are used, and then summarize the state of instrumental period warming, observationally-based climate sensitivity estimation as I see it. I explained in Part 1 why other approaches to estimating ECS appear to be less reliable.

Slide 8ringSlide8

View original post 3,186 more words