Both NOAA and GISS Have Switched to NOAA’s Unjustifiably Overcooked “Pause-Busting” Sea Surface Temperature Data for Their Global Temperature Products


A bit technical for the average person but the summary is that the IPCC climate models as shown in Figure 10 are now showing that global temperatures should be SIGNIFICANTLY higher than what NOAA and NASA show. The importance of Bob’s work is that the powers to be are making current temperatures unjustly higher than they should be and that even with that there are no even close to what the IPCC climate models say they should be.

Bob’s work is much more complete than the simple model I developed but the results are the same.

Bob Tisdale's avatarBob Tisdale - Climate Observations

This is the June 2015 Global Surface (Land+Ocean) and Lower Troposphere Temperature Anomaly & Model-Data Difference Update, but in it we’re presenting the new GISS and NCEI surface temperature products…and the UAH lower troposphere temperature data version 6.

View original post 2,750 more words

Rewriting The Past At NOAA


NOAA and NASA now have zero creditability in what they publish. The data tampering is so blatant they they don’t even try to hid it any more. They no that no real reporting will be now and so they are now just like the media a propaganda arm of the progressive government.

Tony Heller's avatarReal Climate Science

The White House was unhappy that the world isn’t warming, so they told NOAA to alter the data, and make the hiatus disappear.

The apparent observed slowing or decrease in the upward rate of global surface temperature warming has been nicknamed the “hiatus.” The Intergovernmental Panel on Climate Change’s (IPCC) Fifth Assessment Report, released in stages between September 2013 and November 2014, concluded that the upward global surface temperature trend from 1998­­-2012 was markedly lower than the trend from 1951-2012.

Since the release of the IPCC report, NOAA scientists have made significant improvements in the calculation of trends

ScreenHunter_9878 Jul. 07 09.01

Science publishes new NOAA analysis: Data show no recent slowdown in global warming.

no slow down in global warming

This isn’t the first time they have done this. They have repeatedly altered  the temperature record, which now looks nothing like the 1974 NCAR graph

screenhunter_393-may-21-04-35 (1)

The overlay below shows the 1974 NCAR graph on top of the current graph. NOAA…

View original post 22 more words

Increasing Is Decreasing


I would add the Iran and China understand that western governments and press are seriously mentally defective, and will believe anything they are told.

Tony Heller's avatarReal Climate Science

China promises to keep increasing their CO2 emissions for the next 15 years, while calling the massive increase a “carbon intensity reduction”

Beijing: China, the world’s biggest emitter of greenhouse gases, has submitted a new carbon intensity reduction target to the United Nations while reaffirming its goal to curb carbon emissions by 2030, or “even earlier”.

Premier Li Keqiang made the announcement while during a visit to Paris, where the global climate conference will take place at the end of the year.

China’s carbon dioxide emissions will peak by around 2030 and China will work hard to achieve the target at an even earlier date,” Mr Li said in a statement after meeting with French President Francois Hollande.

Global warming: China intensifies carbon reduction and reaffirms 2030 emissions target

In other words, when they complete all their new coal plants around the year 2030, then they won’t have…

View original post 19 more words

A Climate Model That Works


A quick review of several sources including Wikipedia that had estimated dates of 5 previously identified warm and cold periods going back almost 3,000 years was used to give these average dates for either the bottom or the peak temperature in that period.

The Sub Atlantic Cold Period 363 BC

The Roman Warm Period 365 AD

The Dark Age Cold Period 700 AD

The Medieval Warm Period 1192 AD

The Little Ice Age 1602 AD

The average peak to bottom for these observed Cycles is 491 years or 982 years for a complete cycle. So if we add 491 years to the last bottom which was in 1602 AD that would make the peak of the “current” warming trend 2149 AD. This has nothing to do with CO2 although CO2 will add some to the coming peak maybe even .5 degree Celsius.

Basically what this quick 30 minutes study showed is there is nothing to worry about except corrupt politicians.

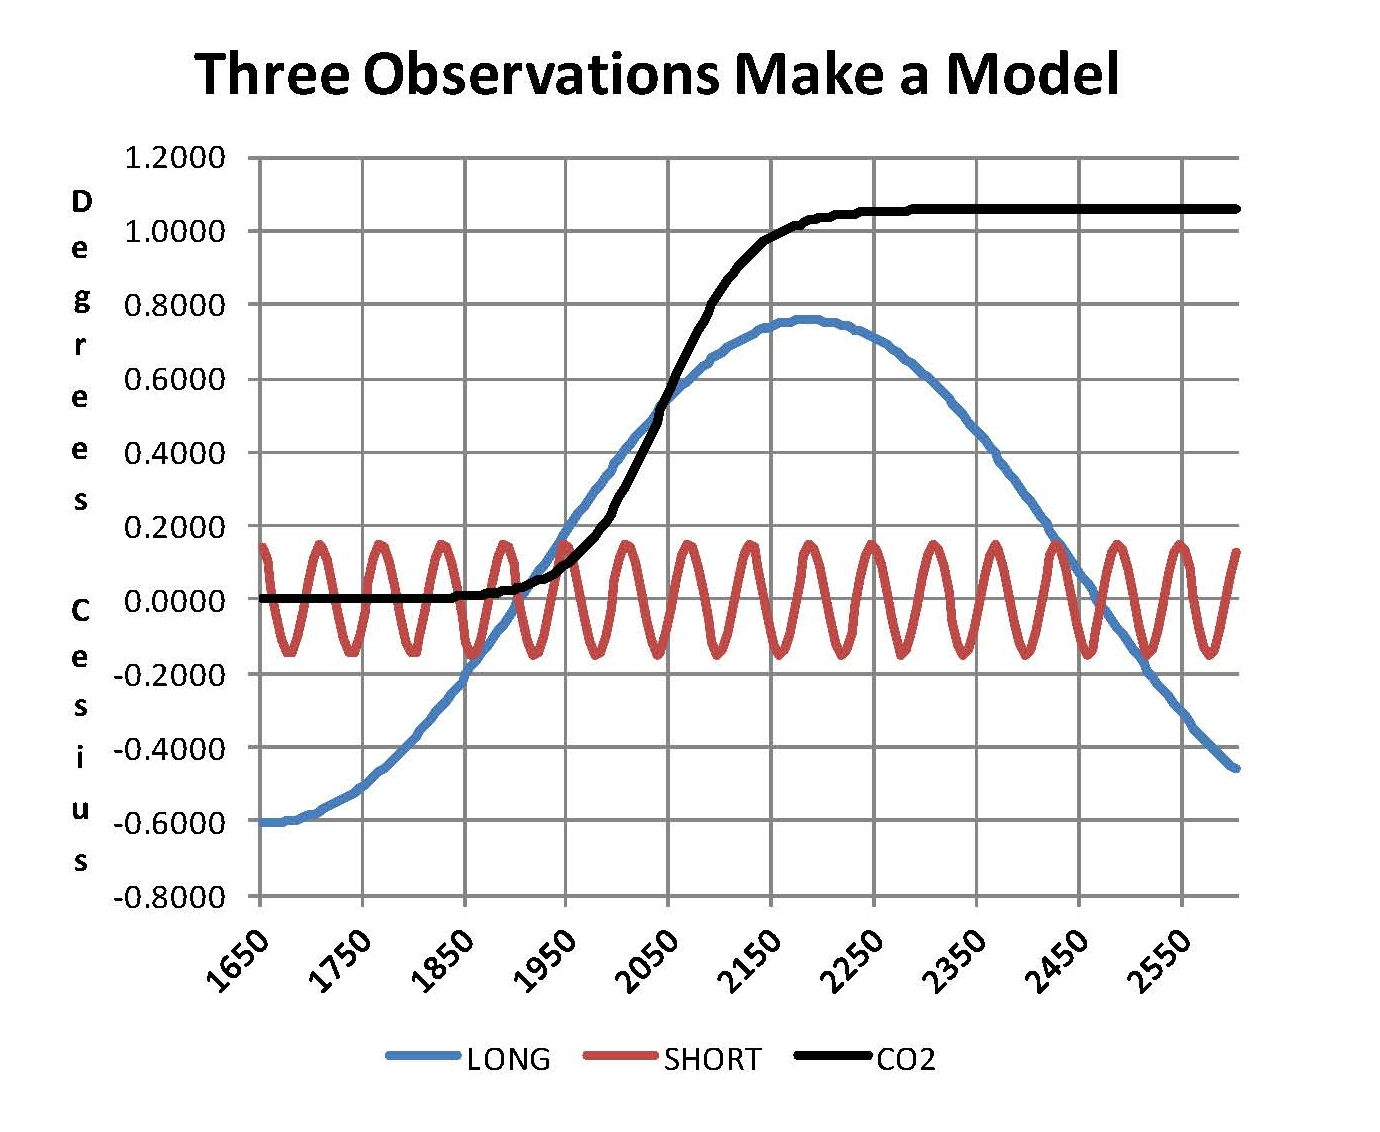
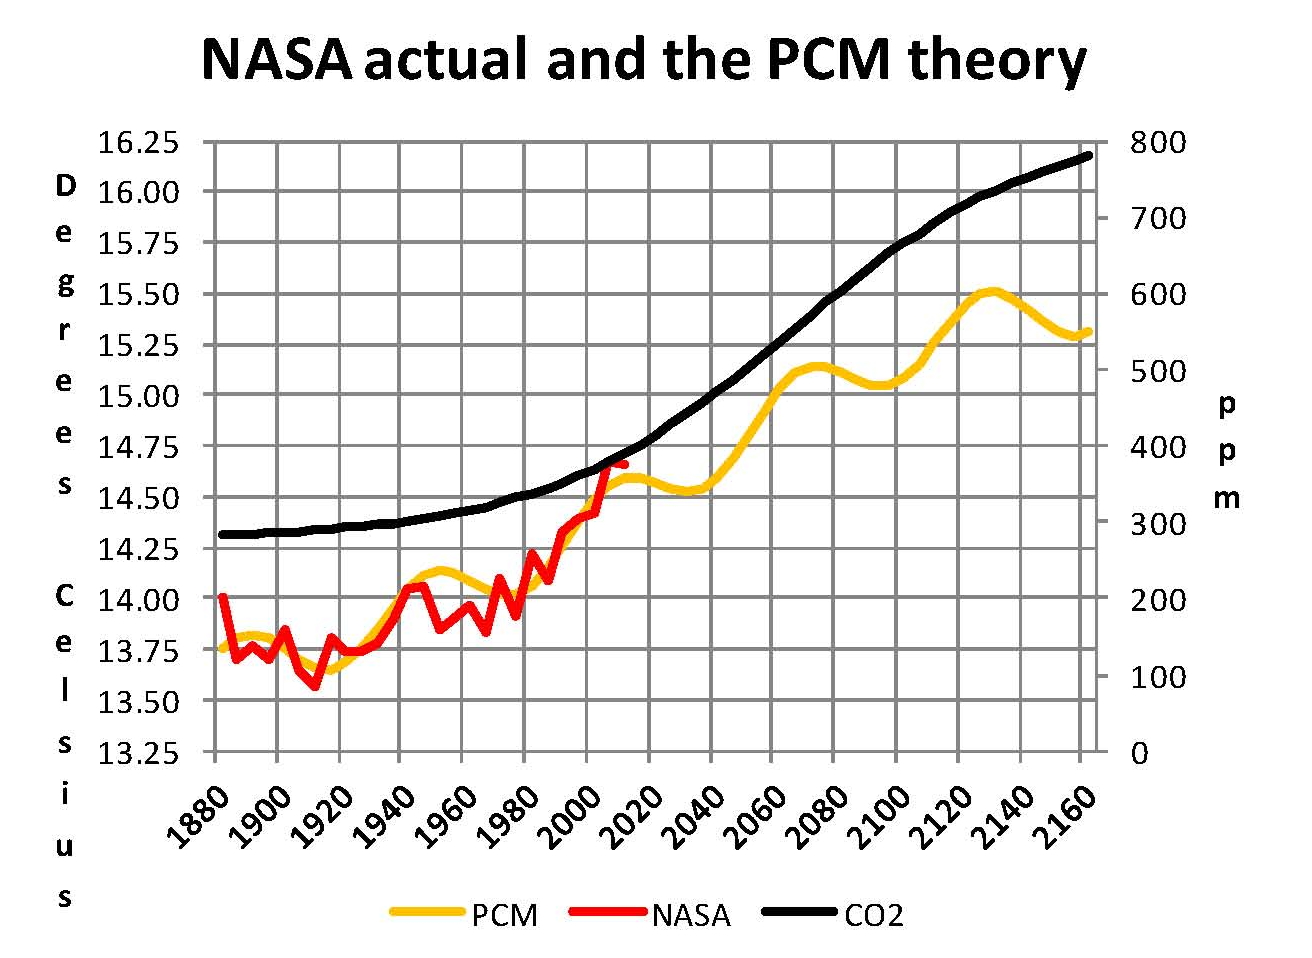
Based on this quick review and other information all previously shown on my blog a climate model can be constructed in a reasonable amount of time (Took me a couple of years since I was starting from scratch) Which is as follows. Chat One shows mathematically derived plots based on empirical observations of NASA–GISS data and other data such as was shown in the opening paragraph of this post. The cyan line is based on the war and cold cycles in the opening. The red line is based on El Nino, LA Nina and the Atlantic Multidecadal Oscillation (AMO). The black line is based on a mathematical analysis of NOAA CO2 growth rates projected into the future and reaching a level of 1,000 ppm by the end of the next century.

The blue line is the base since we knows what the temperature was in 1600 and we have a good idea what the level of CO2 was back then as well. Therefore from Chart One we can see that the blue pattern takes about 1,000 years to make a cycle and the total rang is 1.4 degrees Celsius. The red line has a cycle of 70 years with a range of .38 degrees Celsius. And CO2 from 1650 to the peak in about 2150 is about 1.0 degrees Celsius however keep in mind that half of the increase has already been used up since we are at 400 ppm now.

Image1

Chart Two is a composite made from adding all three of the items in Chart One together. Obviously after 2150 the blue line starts moving down and since it is the largest of the three it will drag down all the rest with it for another 500 years just as it has done for the past 3000 years. The yellow line is the sum of the three items in Chart one labeled PCM The red line are actual NASA-GISS temperatures for their Table LOTI. The red and yellow line match well indicating that there is validity in the assumption used here. Previous posts here have showed most of the detail for doing this including all the equations, for those that interested.

Image2

Is Another Little Ice Age On The Way?


The anthropogenic portion of “climate” change is small compared to the natural flows of heat on the planet. My research shows the the current pause or slow down or what every will last until about 2035. During the period between now and then temperatures will probably drop slightly and then there will be another increase much like was was experienced in the 80’s and 90’s this has nothing to do with CO2 but everything to do with the observed changes in global temperatures for the past 3000 years. Even a HS kid could see it if they were shown the real numbers, which they never will be shown. In any case by the time the temperatures start back up CO2 will be at or close to 450 ppm so it will be very hard to justify the crazy temperatures that the IPCC will have forecast for then.

Climate Scientists Reaching Unprecedented Levels Of Stupid


Reactionary science just like a bunch of cats or dogs running in circles trying to catch their tails. These idiots will chase anything that bring them government study money. All they need to know is what the result need to be to get the funing.

Tony Heller's avatarReal Climate Science

Experts say that it will be record cold, and getting milder.

Britain braced for mini-ice age as temperatures are set to drop to a 300-year low

Low temperatures not seen for 300 years could be on the way to Britain thanks to a drop in solar activity, experts have warned.

If you were enjoying the current warm spell, enjoy it while it lasts as forecasters have warned that the UK could enter a mini-ice age.

A Met Office-led study in conjunction with scientists at the Universities of Oxford, Cambridge and Reading, found that a return to low solar activity not seen for centuries could increase the chances of cold winters in Europe and eastern parts of the United States.

But the study, which was published in the Nature Communications journal, added that the freeze will not be enough to halt global warming.

Sarah Ineson, a Met Office scientist and lead…

View original post 93 more words

Arctic Meltdown Scam In Complete Collapse


With NOAA and NASA on the side of fantasy what difference does the truth matter now!

Tony Heller's avatarReal Climate Science

Arctic sea ice extent is now higher than 2006, the year with the highest summer minimum of the past decade.

ScreenHunter_9681 Jun. 24 04.36

There is still snow in southern Greenland on June 24. Vikings used to farm there. That would be impossible now.

arcticomm_webcam (7)

The Northwest Passage is completely blocked by thick, multi-year ice.

ictn2015062318_2015070100_040_arcticictn.001 (1)

Climate experts will continue to lie about this, because their funding depends on it.

View original post

Weak El Niños and La Niñas Come and Go from NOAA’s Oceanic NINO Index (ONI) with Each SST Dataset Revision


Maybe it would be easier to just drop the anomaly concept and therefore the base year requirement and just use the actual temperature.

President Obama Says Florida Will Disappear In His Children’s Lifetime….


Neither of these issues is he or the Pope, qualified to speak on or make decisions on!

Frequency Of Early Season Hot Weather Plummeting In The US


Just reading errors in the older system, they were not certified to read thermometers.

Tony Heller's avatarReal Climate Science

obama-sweating-GTU

Climate experts claim that hot days in the US are becoming more common due to increased CO2, but the data shows the exact opposite. Through June 15, hot days peaked in 1911 – and were much more common prior to 1960.

ScreenHunter_9639 Jun. 22 08.28

Reductions in summer heat are even more dramatic. Hot summer days were much more common prior to 1960.

ScreenHunter_9640 Jun. 22 08.40

When scientists make claims opposite the data, you know that they are criminals – not real scientists.

View original post