Something has been bothering me about the NASA-GISS LOTI data table for a long time now, and I don’t mean the data manipulation which we all know is there. NASA publishes a table of values representing the global temperature of the planet supposedly based on actual measurements. The problem I saw in their data was the large swings in their numbers on a month to month basis; at a local level yes, of course, but on a global level the changes would have to be very gradual because of the very large numbers involved in the energy content of the atmosphere.
Last week I decided to try and calculate the heat value of the NASA LOTI changes and so from Wikipedia we find that the dry atmosphere is 5.1352E+18 kg and the water is 1.27E+16 kg for a total of 5.1479E+18 kg. with that all that was needed was a heat value and so a Google search brought up a guest post on WUWT from April 6, 2011 by Jeff Id from his the Air Vent blog where a thermal analysis was completed for a different purpose but in the post was the number I was seeking of 1005 Joules per degree Kelvin for the heat value of the Earth’s atmosphere.
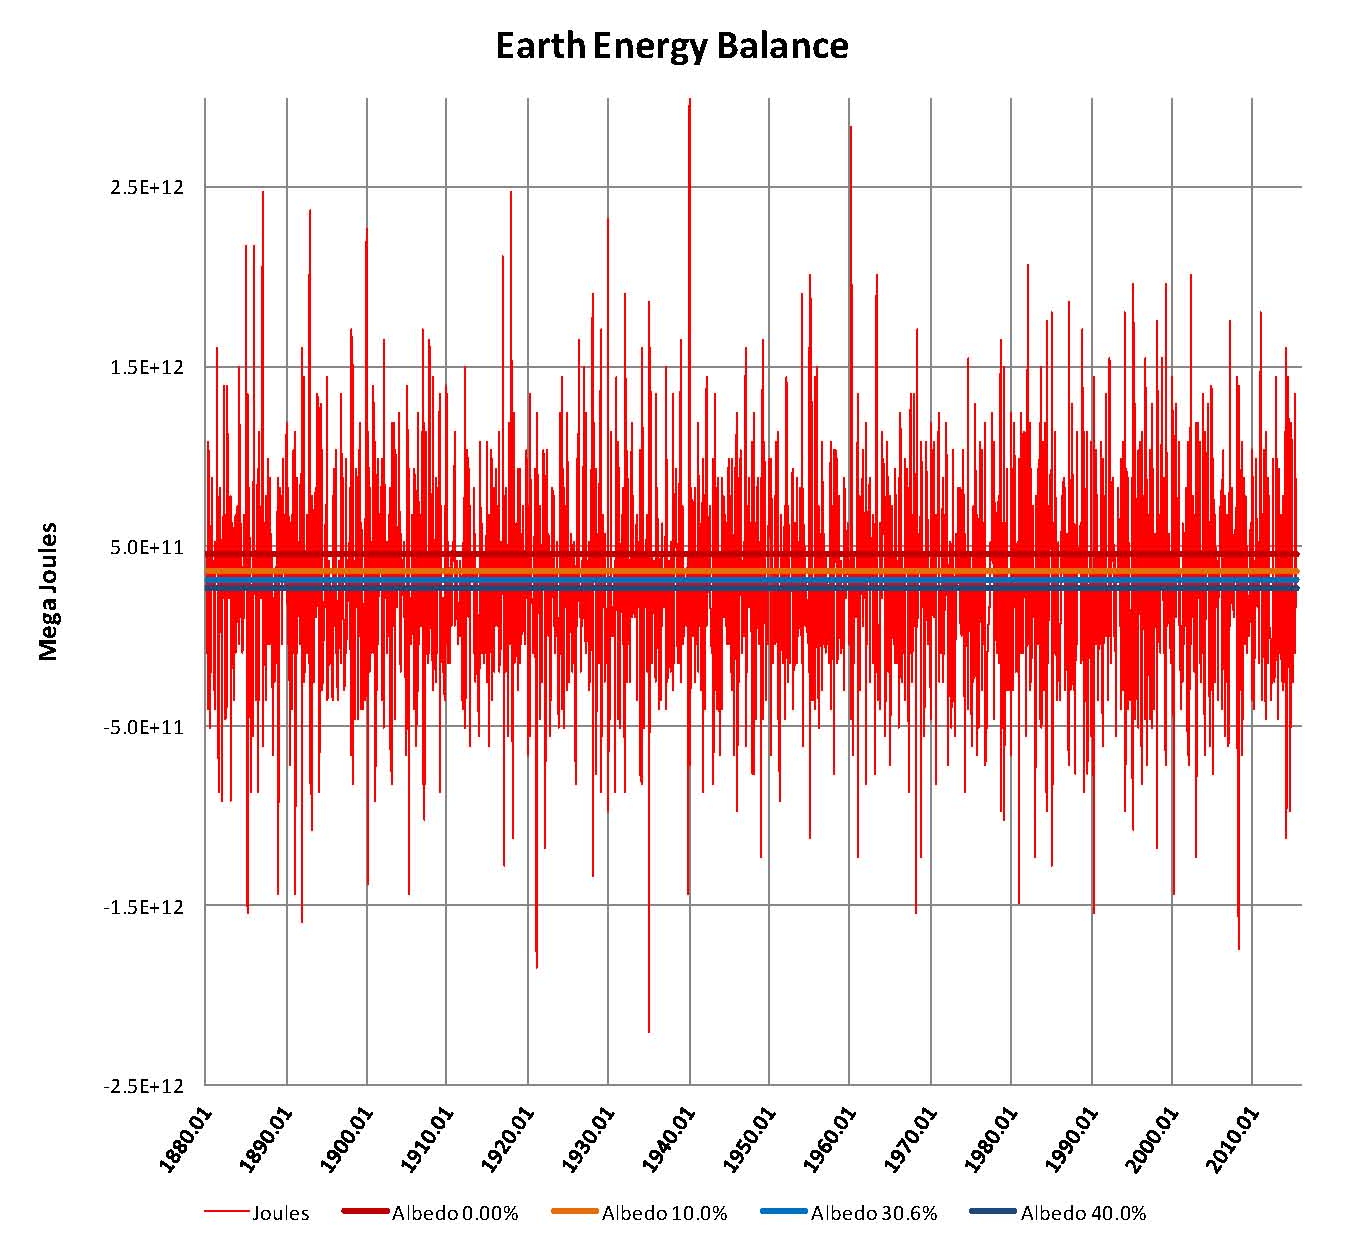
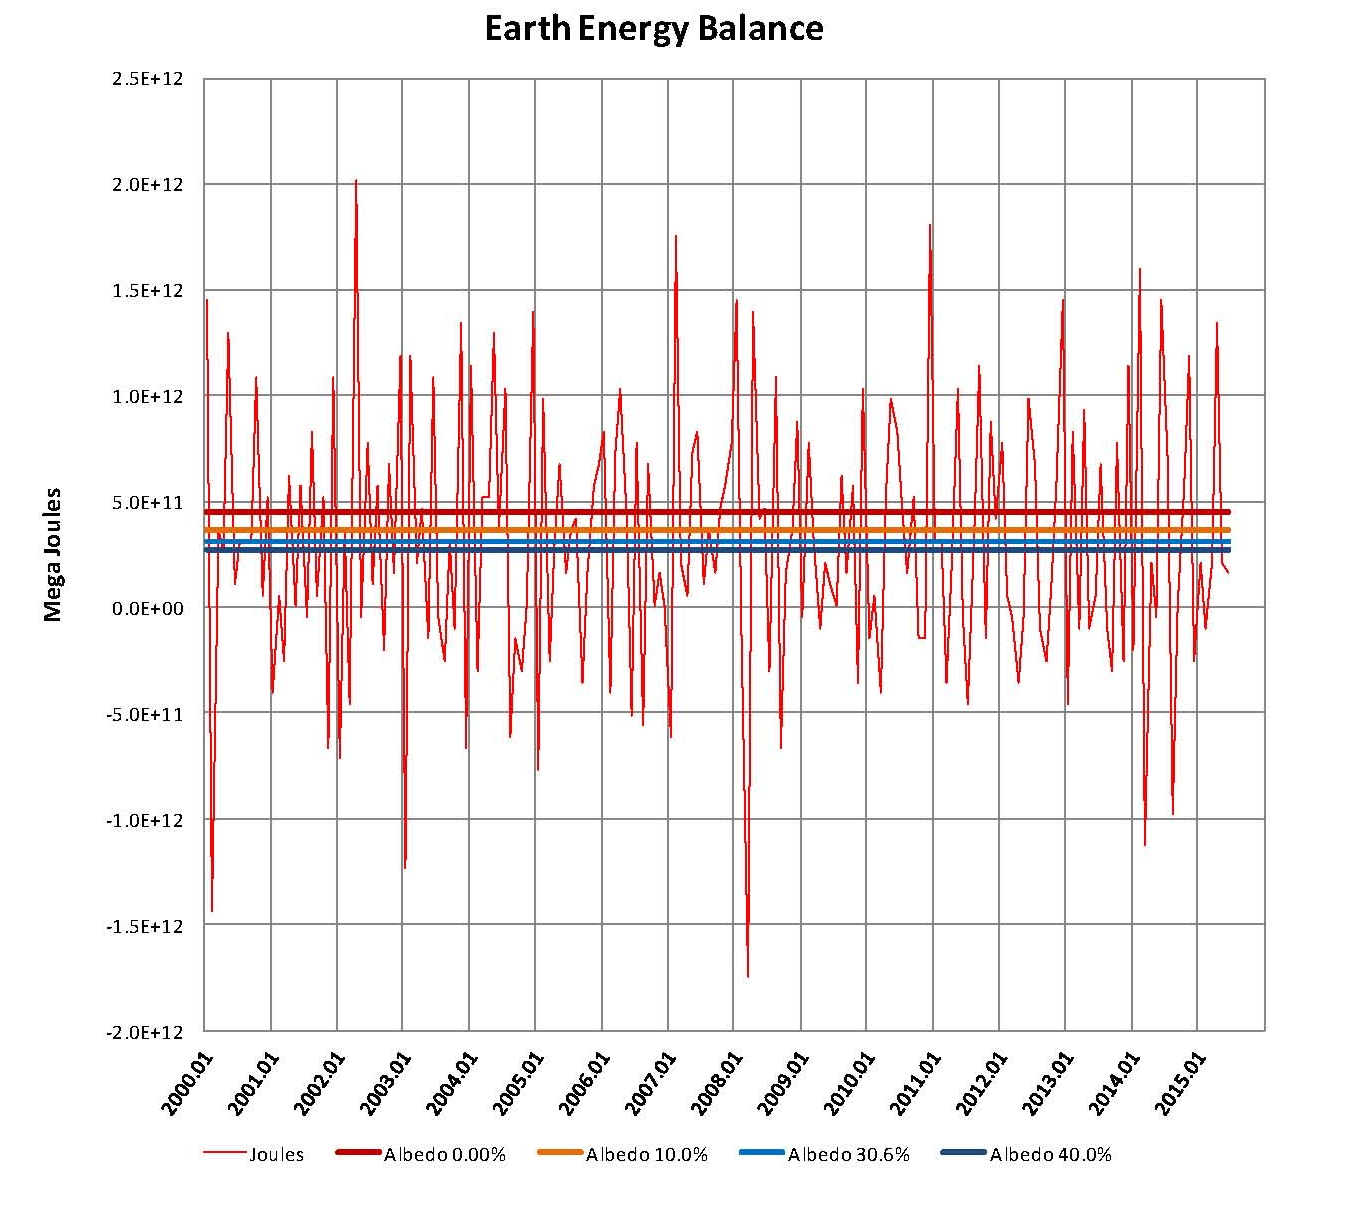
The next step was to take the most current (at the time this was written) NASA LOTI values from January 1880 to June 2015 and place them in a spreadsheet it was then simple to calculate the heat value of each months anomaly for example for January 1880 the value was 1.48193E+21 Joules and for June 2015 the value was 1.48728E+21 Joules. There were 1625 values in the LOTI table; because of the large number of values the line width was set to zero to make it readable and the scale is in mega joules. A second chat was added from January 2000 to the present so that more detail can be seen
It’s clear when looking at this chart that there are extremely large monthly energy flows involved here if the NASA numbers are actually valid. To put this in perspective four lines were added to this chart for the incoming solar radiation using the following albedo percentages 0.0%, 20.0%, 30.6% and 40.0% and using 1368 Wm2 for solar radiation at the earth’s orbit adjusted to 342 Wm2 to compensate for the spherical earth. Obviously the Wm2 had to be converted to Joules we used 2,592,000 seconds for the conversion since we were looking a monthly changes.
With that done we can see that the monthly NASA-GISS energy flows far and away exceed any possible variation in the planets albedo and so the values in the NASA-GISS table LOTI cannot be correct.
I would appreciate feedback on this analysis as there are serious implications to the integrity of the NOAA and NASA published data!