
In Part I the basics for a different kind of climate model which we call the Pattern Climate Model (PCM) were discussed and in this section we will present a method where the real reasons for global temperature movements can be demonstrated in a very simple model. The reason or logic for developing this model is that based on geological evidence the link between Carbon Dioxide and global temperature appeared weak at best, especially at elevated levels meaning over 400/500 ppm. More currently over the past 2000 years or so there appeared to be patterns to the climate that had better relationships to orbital changes, Milankovitch Cycles, and variations in the suns output. As discussed in the seventh point over the past several thousand years the Milankovitch Cycles appear to give a global warming and cooling cycle of some 1,052 years with a swing in temperature of about 1.46 degrees Celsius. This swing appears to match well with the timing of the Little Ice Age and the Medieval Warming as well as other warming and cooling cycles going back further than those two just mentioned. With a swing of almost 1.5 degrees Celsius this is has probably been the primary driver of global temperatures for the past 4000 years. Figure 3 follows.
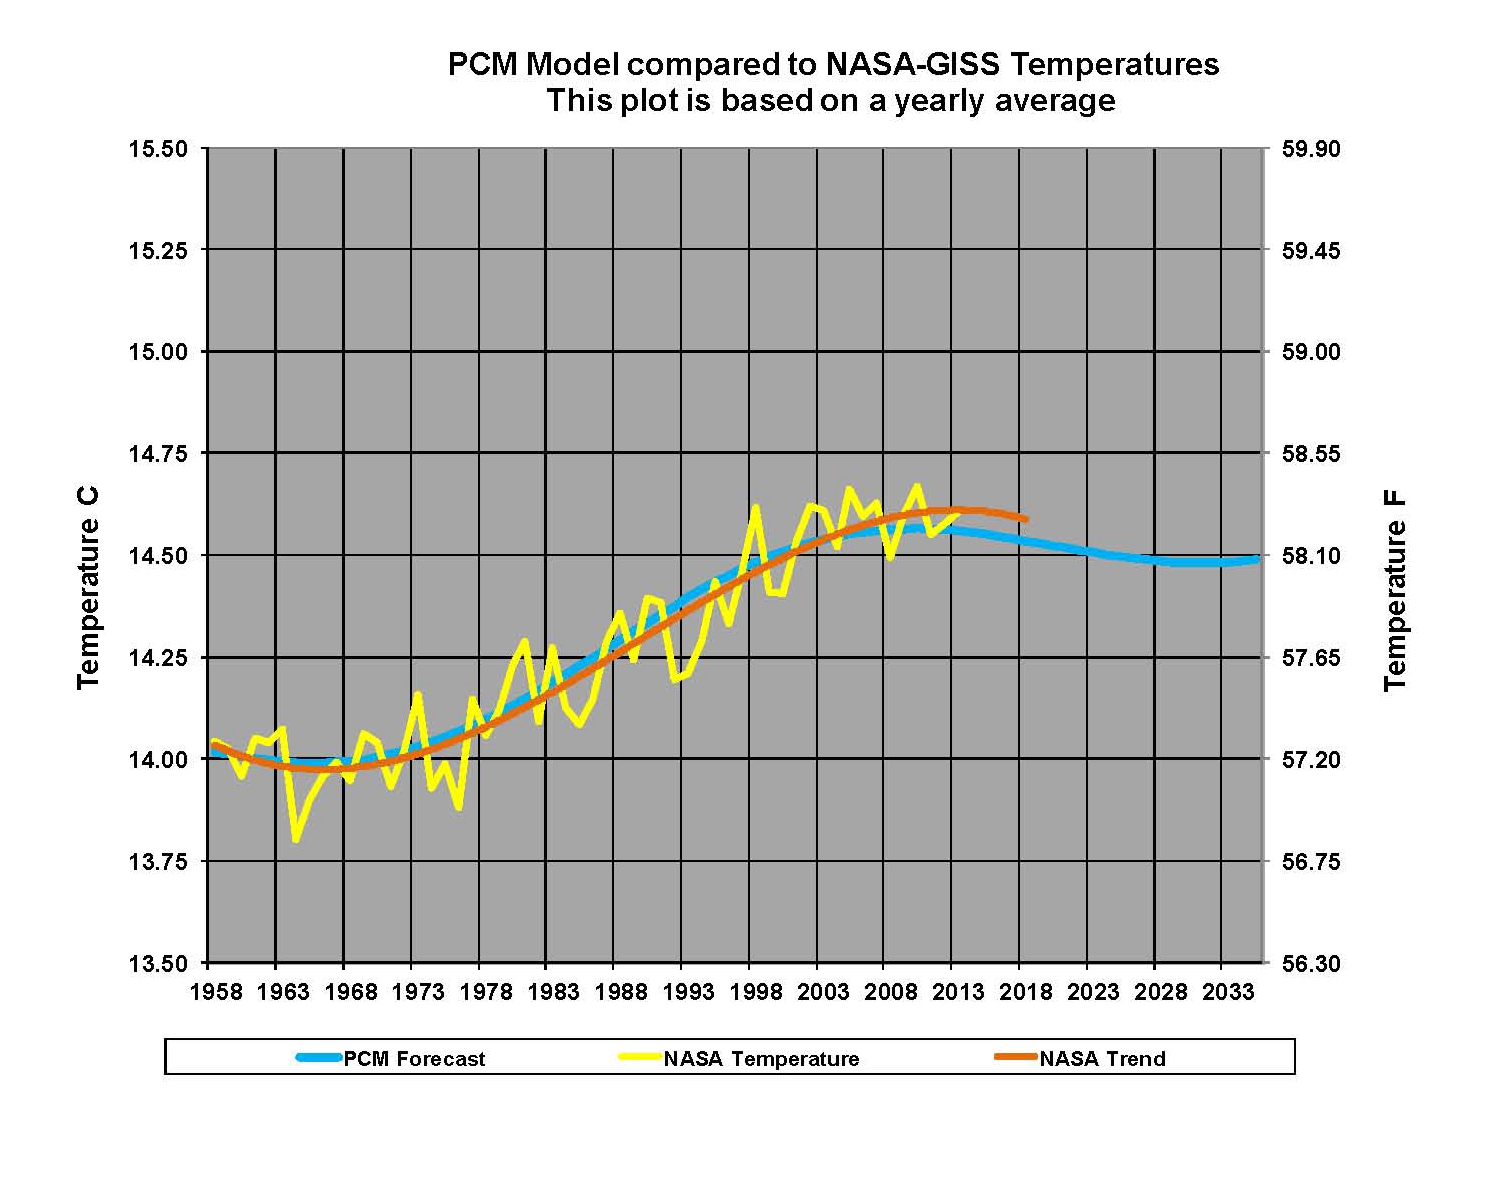 However the Milankovitch Cycles cannot explain all of the variations as there are clearly many ups and downs observed with shorter times and less magnitude. The solar variation from internal variation in the fusion process in the suns interior appears to be the primary reason we have the short cycle of almost 67 years and with a swing of about .32 degrees Celsius. Putting these two cycles together get’s us very close to observed NASA-GISS temperatures but there does seem to be more needed and we find that if we use a sensitivity value for Carbon Dioxide of .64 degrees Celsius and then add that value to the long and short trend that we end up with a very good match to the NASA-GISS temperature plots. Because of the way the sensitivity value works in the models the actual temperature affect on the Climate is the highest when there is very little of it and it gets proportionately less the more there is. That may seem to be counter to logic but what happens is basically a “saturation” beyond which the affects of the Carbon Dioxide becomes almost zero. If this were not true then during those periods where Carbon Dioxide was 10 or 20 times what it is now would have produced temperatures that would have killed off much of the life on the planet. Figure 3 shows the mathematical result of properly adding all these factors together and they are shown as the blue plot ladled the PCM. In addition just as was shown in Figure 1, an orange trend line for the yellow NASA-GISS temperatures is shown and both match the blue PCM plot very closely from 1960 to the present unlike that of the IPCC plot. Figure 4 follows
There is a very clear difference between the blue PCM plot verses the IPCC red plot compared to the NASA-GISS temperature plot. Now that the short trend is moving down global temperatures have stopped increasing (this is why the orange trend plot has turned down) and will now move down between .08 and .16 degrees Celsius by 2035 and this assumes that Carbon Dioxide reaches 450 ppm by the end of 2035 which is in line with the IPCC “ar4 forcings.” This effect, the reversal of the past increasing trend is clearly shown in the current NASA-GISS data as shown in Figure 3 and 4 of actual NASA-GISS temperature data as of July 2013.
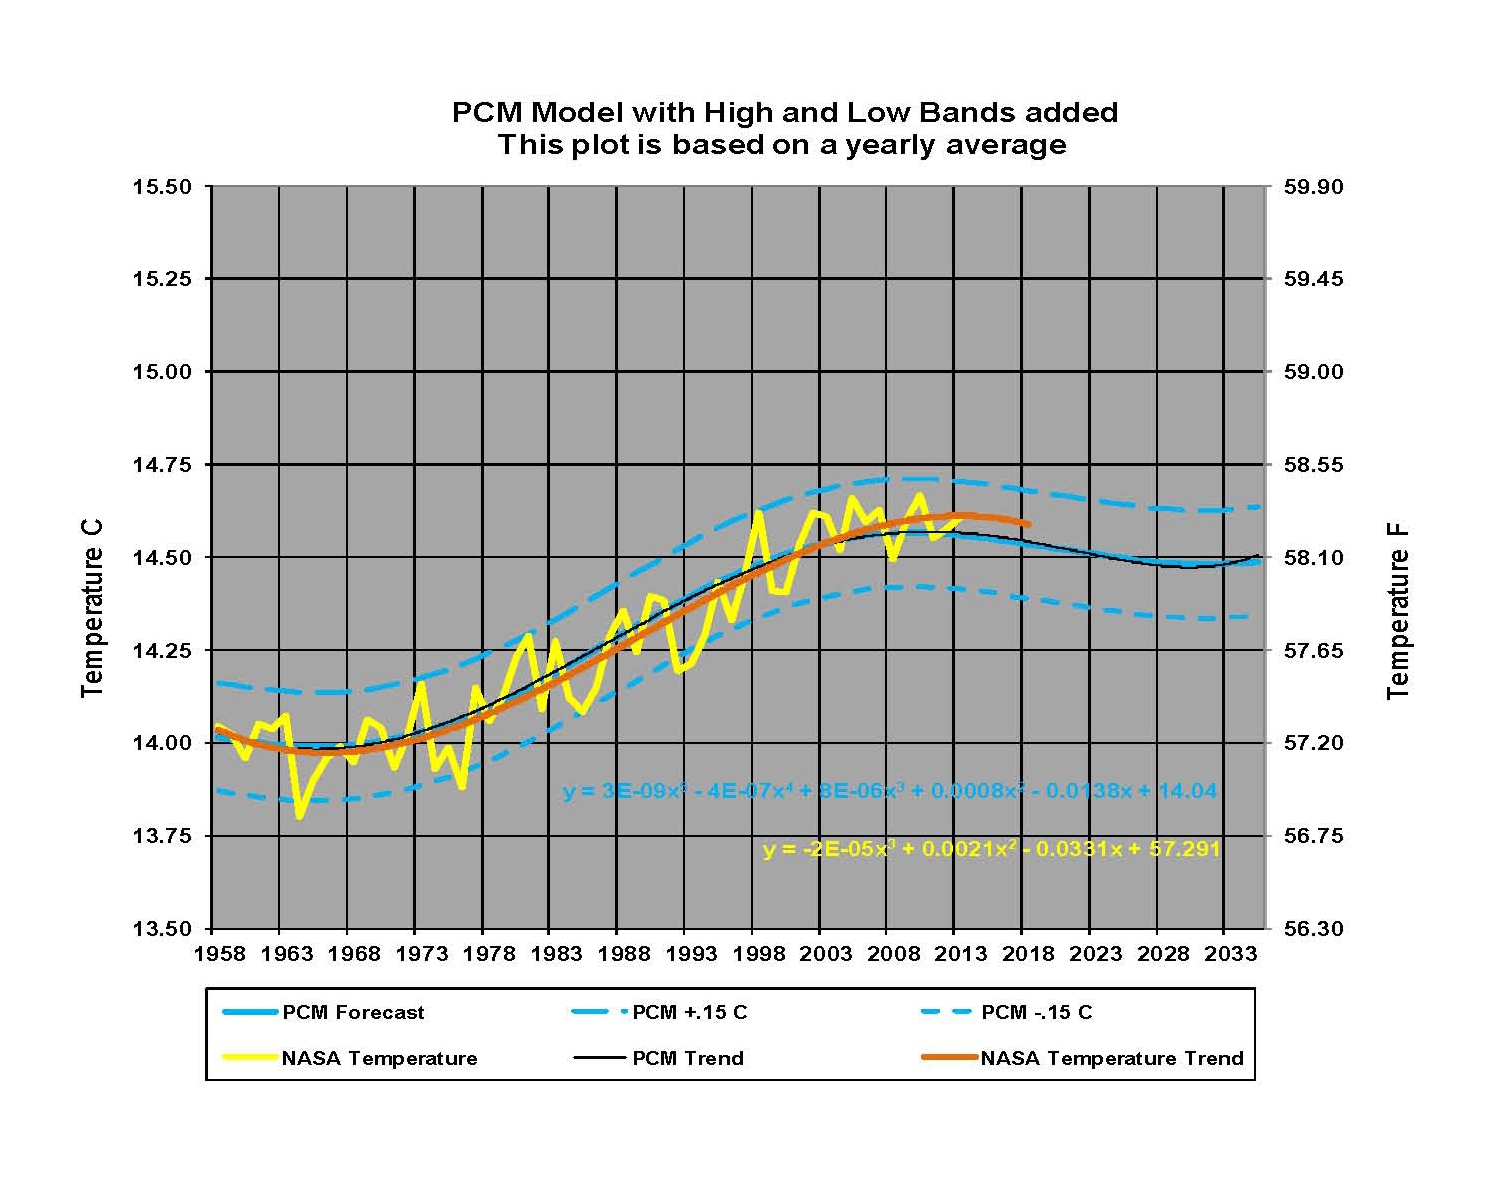
In Figure 4 we put some probability bands around the PCM model using the same values as used on the IPCC model a high (+.15 degree C) and a low (-.15 degree C) and they represent a deviation of +/- 1.0% from the mean. We can see that the PCM models bands contain most of the yellow NASS-GISS values from 1958 to 2013 with 51 of 56 points inside its bands for 91.1%. We also show the orange trend plot with its equation to the yellow NASA-GISS data which shows that their data plot is trending closer to the PCM plot than the IPCC plot and there have been no years outside the bands since 1998 which is 15 continuous years. If the NASA-GISS data plot continues following the current pattern for three more years then no more temperature plots can be expected to fall outside the dashed blue lines and the issue will be settled as it will get harder and harder for a temperature plot to fall into the red bands as that IPCC trend continues to more higher and higher.
For reference in Figure 1 all the values on the red plot to the left of 1988 are back calculated and all the values to the right of 1988 are forecasted values by the IPCC GCM system. Then on Figure 3 we have the PCM system where all the values on the blue plot to the left of 2009 are back calculated and all the values to the right of 2009 are forecasted values by the equations in the PCM system. Unlike NASA-GISS table LOTI temperature values the PCM Temperature values do not change as new temperatures are added to the data table. The model is what it is and lives or dies on the accuracy of its predictions.
The concern over global warming as observed during the 70’s 80’s and 90’s was not unreasonable since Carbon Dioxide, a known “greenhouse” gas (we use this term even though it is wrong as explained in point nine), levels were going up and global temperatures were also going up. The politicians that wanted to act got involved and created a solution before the apparent problem was even understood. The green energy, sustainability and save the planet slogans that were developed and even the greenhouse effect words were all designed to convince the citizens that things must be changed or there would be dire consequences. The IPCC climate models will eventually be fixed to work as they will eventually realize that something is not working the way they thought. Unfortunately the political damage has already been done as we poor hundreds billions of dollars into changing how we produce energy to fix a non-existent problem. The sooner we can get past this the less time, effort and resources will be wasted and we can use them for much better purposes.
