
Water the climate stabilizer
This post is an “opinion piece” although I believe it is based on sound principles and the conclusion is probably not all that far off from what we actually have with the planets climate.
What so many people forget when they are discussing the subject of Climate Change or Anthropogenic Climate Change is that the primary greenhouse gas in the atmosphere is Water, just plain old H2O at .25% or 2,500 ppm. The Carbon Dioxide CO2 that so many are extremely worried about is only a minor player at only .04% or 400 ppm. The how that these two interact in our atmosphere along with incoming solar radiation and outgoing infrared (IR) is what keeps the atmosphere of the planet 33 degrees Celsius warmer than it would be without these two gases. In other words the planet would be an ice ball and probably devoid of life without them.
When studying climate in relationship to Water and the various other trace gases such as CO2, Ozone, and Methane one finds that there are only a few bands (frequencies) of visible (incoming) or Infra red radiation (outgoing) where the trace gases could affect water which is the repository of the heat making up that 33 degrees Celsius of warming. Ozone absorbs ultra violet which is very important to us but does not interact with the water or the Carbon Dioxide in the atmosphere so it can be dismissed for considerations involving changes in global temperature. Methane at present levels is only 1.8 ppm and so even though it could be a factor at higher levels it can also be dismissed; and so for all practical purposes that only leaves Water and Carbon Dioxide to consider for changes in the climate with the variations of these gases in the atmosphere.
When we look at charts showing the radiation transmitted by the atmosphere or absorbed by it. It would seem that the ratio of absorption of energy by Carbon Dioxide to Water is about 1 to 6 or in other words 16.7% CO2 and 83.3% H2O. Since we know that there is energy in the H2O in the atmosphere from absorbing visible and Infra red energy and that can be determined to be 33 degrees Celsius that distribution logic tells us that 5.5 degrees Celsius is related to CO2 and 27.5 degrees is related to H2O. Based on these numbers we can generate sensitivity plots. Those plots make sense from observations of the atmosphere when all things are considered in proper context.
We’ll look at CO2 first and we find that from many peer reviewed papers the sensitivity values for CO2 have been moving down from the original National Academy of Sciences (NAS) 1979 Charney report of 3.0 degrees Celsius being the most likely to now most being less than 2.0 degrees Celsius. There are even a few studies below 1.0 degrees Celsius such as .68 degrees Celsius Harde and .64 degrees Celsius Lindzen. If we pick .65 and plot the resultant curve we find that 400 ppm intersects the CO2 plot at 5.5 degrees warming which just happens to be the same value that we got looking at the radiation absorption and transmission Charts. In my work I came up with .65 degrees Celsius as well because it was the value that made my model work; so obviously I have no problem with this value.
The following Chart shows the relationship that we just described.

With the Carbon Diode subject now settled (here) that leaves water to be studied and this is a little more complex. Everyone agrees that water is the primary greenhouse gas because of the large amount of heat that it can hold, from Wikipedia we have the following three statements:
Waters heat capacity is the highest of all common liquids and most solids and it prevents extreme changes in the planets temperature i.e. it is a great heat moderator.
Waters latent heat of fusion is also the highest of all common solids and liquids its thermostatic heat regulating effect is due to the release of heat when freezing and the absorption on melting.
Waters latent heat of vaporization is the highest of all common substances so it is immensely important in the transfer of heat in and between the ocean and the atmosphere which makes it a driving force in climate and weather.
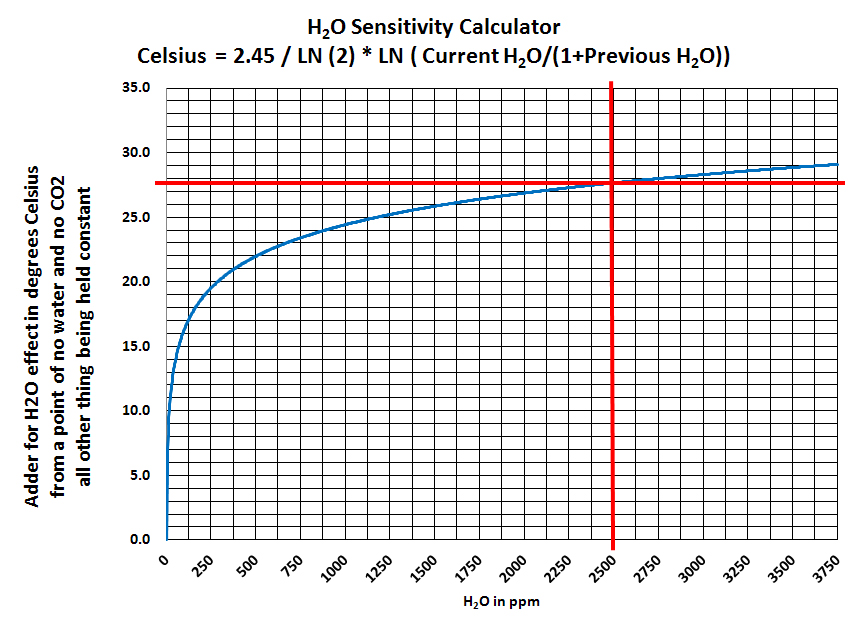
We know following the logic used here that 5.5 degrees Celsius was the amount of increase in the atmosphere from Carbon Dioxide and so if we subtract that from 33 degrees Celsius we get a remainder of 27.5 degrees Celsius. That must then be the amount contributed by the water itself to the process and we can make another chart showing the contribution due to water. To make the chart we have water at 2500 ppm and we know the amount of increase in temperature must be 27.5 degrees Celsius so what sensitivity value will produce that curve? The following plot shows that if the sensitivity value of water is approximately 2.45 than we get the required value as shown in the following Chart.
This process makes sense since if the numbers were reversed and we made Carbon Dioxide have a sensitivity of 3.0 degrees Celsius (as the IPCC claims it is) than the warming from CO2 would be 27.9 and there would be no room for the water as there would only be 7.1 degrees available for the water. These numbers are almost the same as what was developed here but reversed between the CO2 and Water so it has to be one way or the other. However, since we know the absorption bands of the CO2 and Water and we know the distribution on energy coming in and gong out we also know that this is not possible.
Therefore this paper must be a close approximation of the actual situation in the atmosphere and the IPCC value that they use of 3.0 degrees Celsius must therefore be wrong.
