
Homogenization or Manipulation?
What does NASA do when it attempts to determine the World’s temperature that it publishes each month in various reports such as the Land Ocean Temperature Index, or LOTI? This table of anomalies (changes from a base of 14.0O Celsius) is published back to January 1880 and the latest version includes temperatures though April 2014, or 1,600 values. Each month when the new table is created using the process called “homogenization” NASA “recalculates” all the temperatures all the way back to January 1880.
After several years of studying the NASA values for work I was doing, sometime in late 2012 or early 2013, as I remember it, a major change was noticed in the 2012 values from those in earlier periods. The changes were observed because of the way I was entering the data for each month’s anomaly in a spreadsheet column for analysis which put each month’s value next to the previous months one. What was observed was that the temperatures from 1900 to 1940, and other periods were significantly and systematically changed to support the myth that Carbon Dioxide emissions were dramatically changing the climate of the planet.
Table 1 is a listing of NASA anomalies that is provided as proof of the data manipulation that goes on with the NASA homogenization process. I picked four years as a sample 1909, 1910, 1911 and 1912 and they are shown on the Y axis of Table 1 and you can see in the Table that there was a major shift in the numbers between the LOTI issue dates October 2011 and September 2012 (Report download dates on the X axis) which matches what is shown later in Figure 1. There are three red ovals placed around some of the major shifts in this sample of what occurred from the period 1900 through 1940 to emphasize the issue; although all that data has been shifted to much colder temperatures.
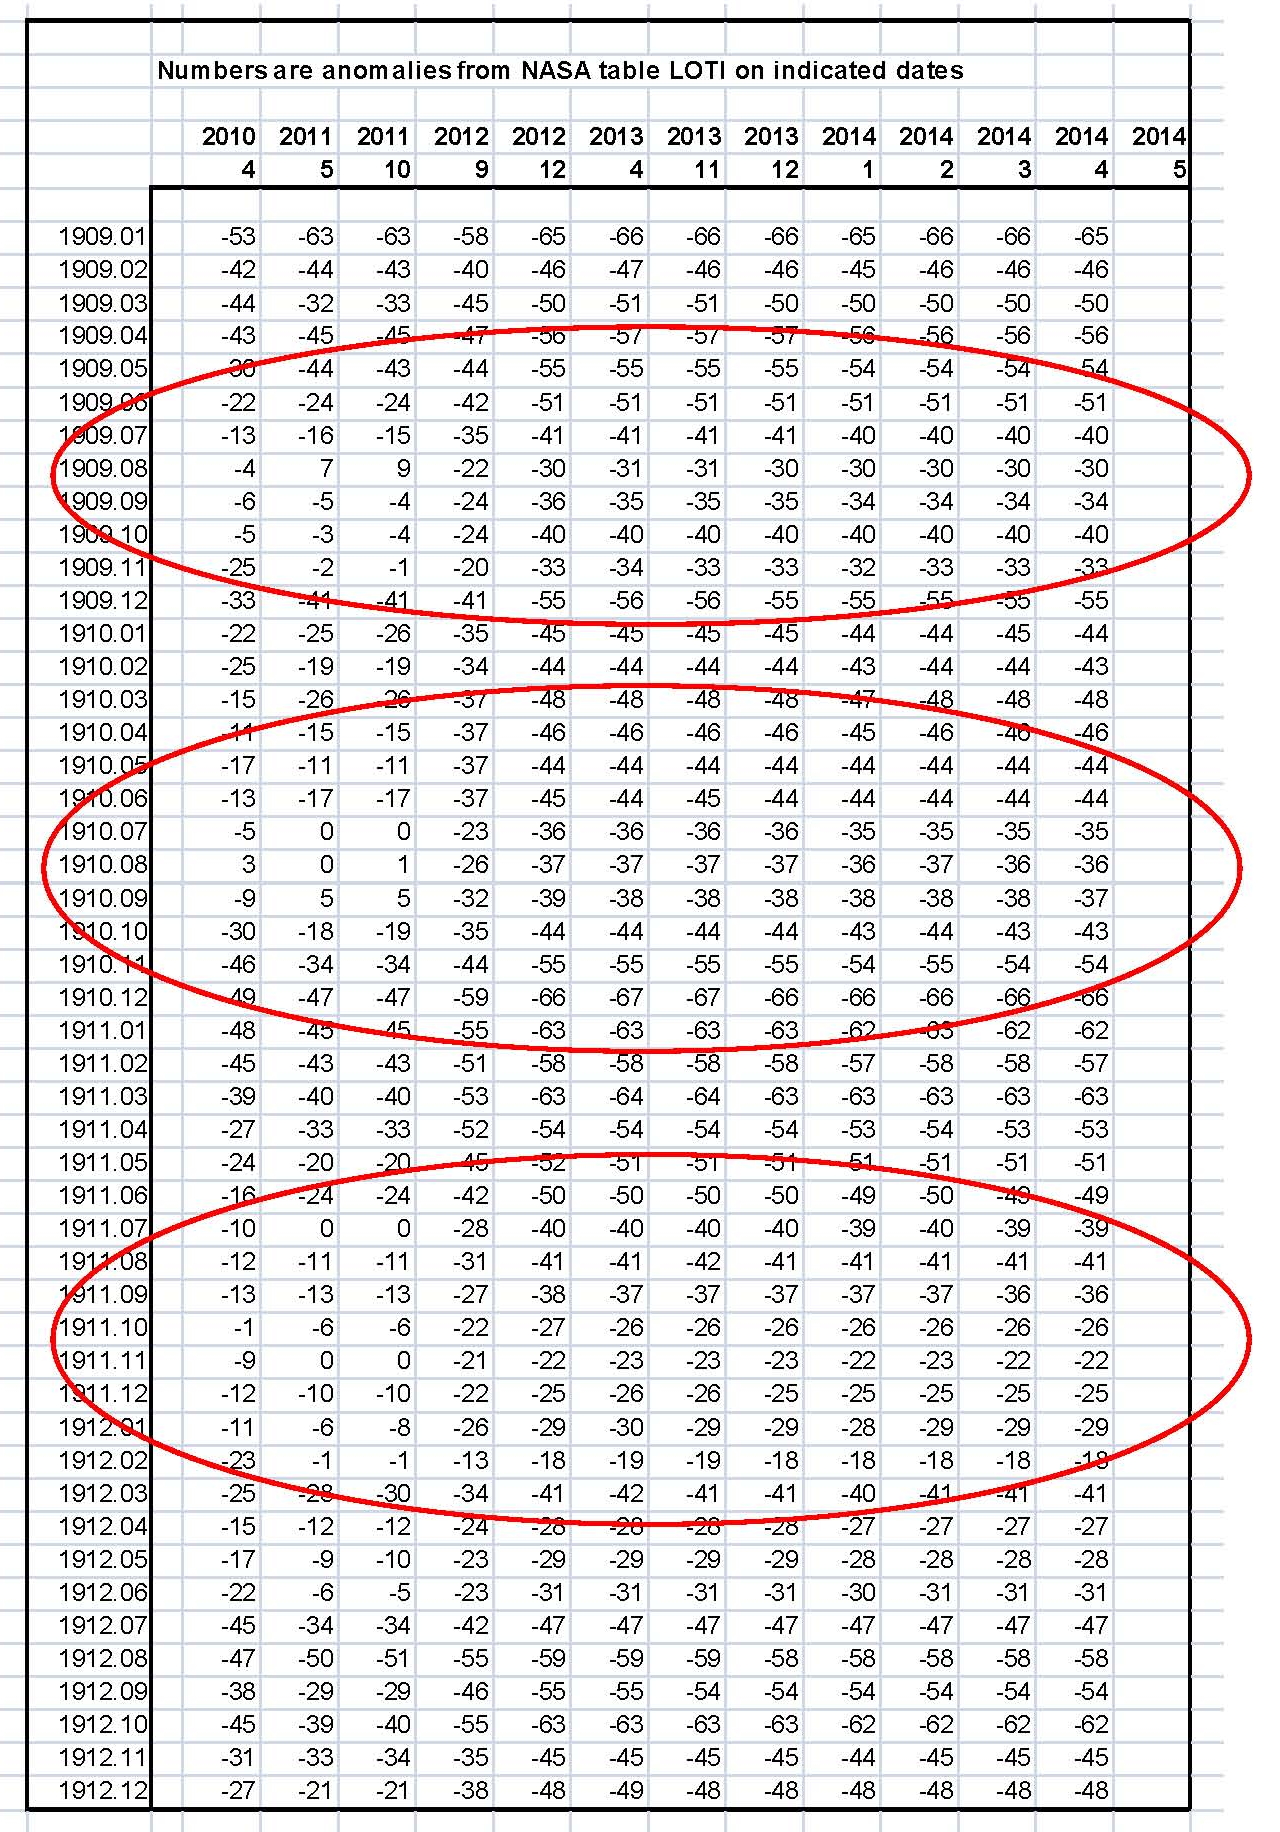
Table 1 Listing of anomalies
We show what NASA did in Figure 1 which contains 8 anomaly plots broken into two sets, one set of four from 2011 and earlier (brown and orange) and the other set of four from 2012 and later (blue and green). There is a major difference between the two sets of plots which should not be there; red ovals on the chart. My take on why this happened cannot be proved but it would make sense with the management in place at NASA when the change was made between November 2009 and October 2011.
To those reviewing the data, at NASA, it would have been obvious by 2005 that temperatures had stopped moving up and that was not possible according to the logic used in the anthropogenic climate change belief. The IPCC and their cohorts had stated many times that the science was settled and the debate was over. But they were showing in their homogenization process very high temperatures by 2010 (in support of what was supposed to be happening) which was getting hard to justify. The yellow and orange plots were reaching an anomaly of 100 or 1.0O Celsius over the 14.0O Celsius base. So they decided to change the program and we have the results in Figure 1.
The process that NASA uses to determine the anomaly results in variability and so to remove that we first looked at blocks of ten years which would then contain 120 values for each month and an average for that set was determined. From 2009 to the present the average was determined using the actually number of values available for each of the monthly tables since some tables ended prior to the present. That gave us 14 points to plot from 1880 through 2014 for each of the eight reviewed months. Figure 1 has the ten year time blocks on the X axis and the value of the anomaly on the Y axis. The anomalies are in hundredths of a degree so the total range is 1.6O Celsius.
As can be seen the values of the anomalies from the first set dropped significantly from 1900 to 1940 and again from 2000 to the present and it was not a gradual change but first one way and then the other way, indicating a programming change.
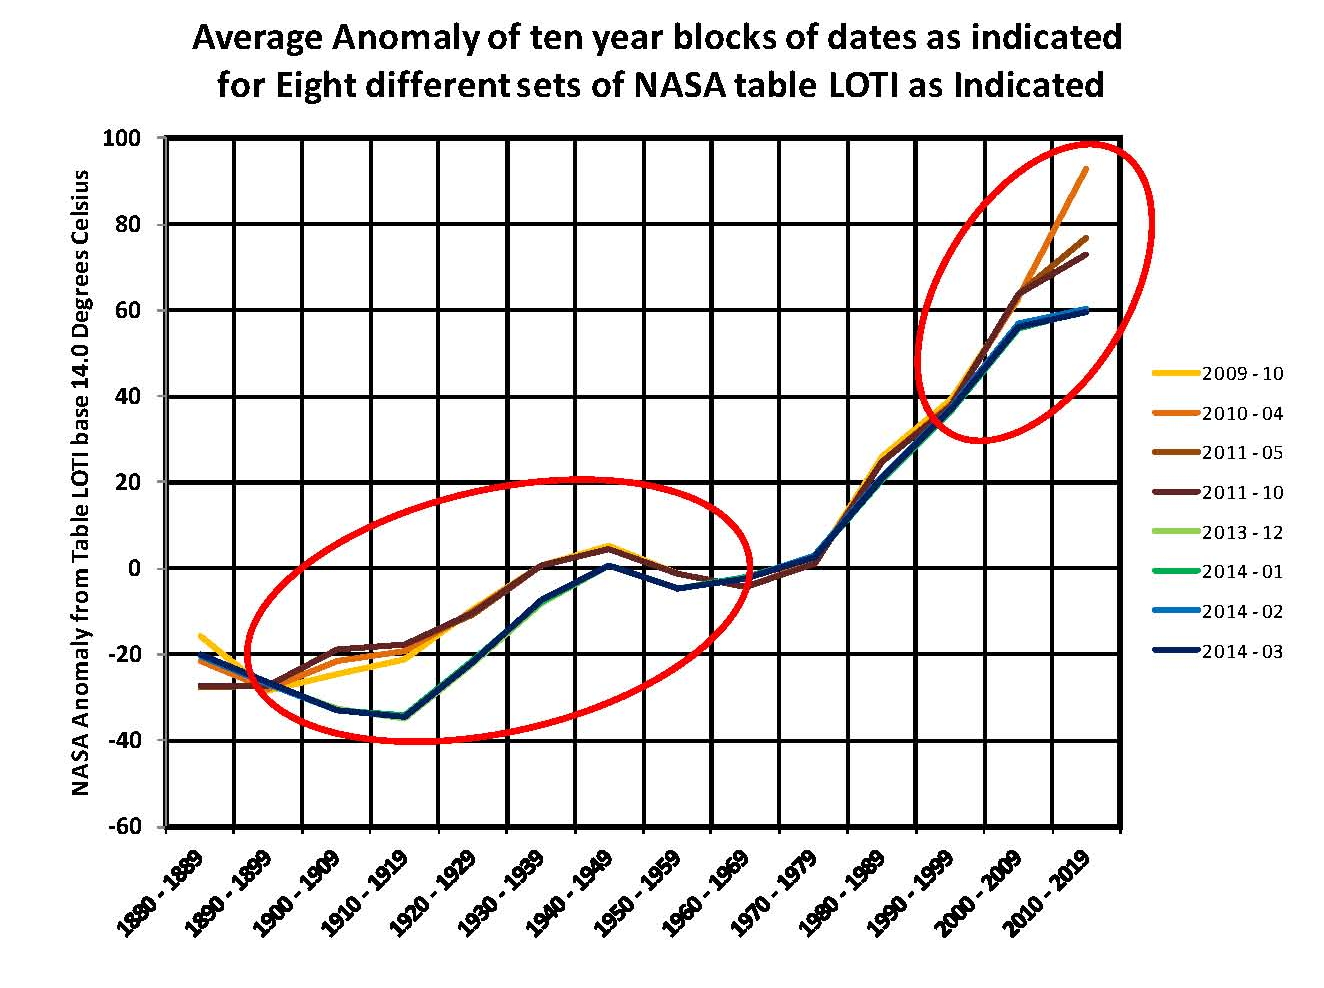 Figure 1, NASA manipulation
If we look at the periods in the brown – orange set from 1920 to the present time the movement up appears to be about 100 (-20 to +80) or 1.0 degree Celsius. But I think that they knew that the “current” numbers they were showing were not real. So somewhere in NASA a decision was make to reprogram the homogenization program and what they did was lower the 1920 period and the present period about the same amount to give about the same upward movement in temperature as previously existed prior to the change. On their charts the shift would almost not be seen.
The result is that the new set, blue – green shows an upward movement of about 95 (-35 to +60) which matches the older set range but ends up at a much lower value that is closer to what the real temperature is even though they don’t like that. The difference between the sets is close to -.25 degrees Celsius which is not inconsequential. Whether this was intentional or not the change is there and is major and that puts into question the process used by NASA to determine the global temperature.
This process must be reviewed in detail so we can be sure of the accuracy of what is being published.
The next step was to look at each data set independently, and what should have been observed on a plot would be a more or less horizontal line across the Chart for each time block for the average value of the NASA anomaly for that period. Instead what was observed Figure 2 were major shifts mostly down, colder, in a large number of the time blocks all occurring during 2012; meaning that a programming change must have been made that shifted around entire blocks of temperature anomalies, this has to be intentional and not random.
Rather than show all the plots new ones were created to show where the major changes were and they are plotted here Figure 2 as 1900 to 1919, 1920 to 1939, 1940 to 1959 and 1960 to 1979 this time each plot containing 240 values for each of the 13 NASA LOTI reports so were are looking at 20 year blocks which should definitely take out any random variations. Virtually all the 13 original time blocks showed this kind of shift, some up and some down in values, but since many overlapped it was hard to track the individual plots and this simplified version shows the core of what was done with the temperatures without the distraction of too many plots. Without data manipulation each plot should end up as a straight line on the Chart.
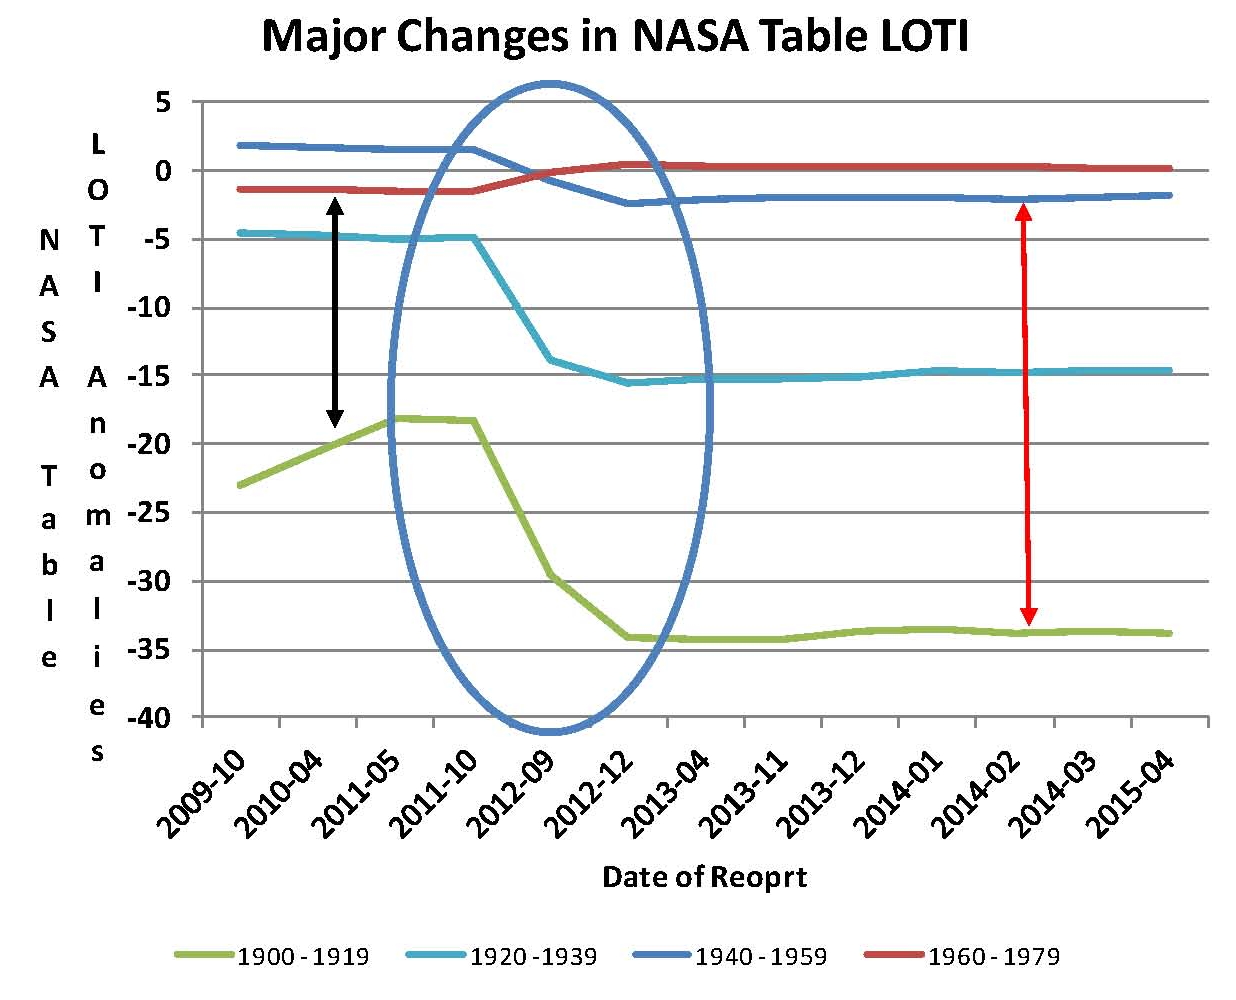 Figure 2, NASA homogenization
It’s obvious that there has been a major shift in the values shown in NASA table LOTI during these four 20 year periods totaling 80 years. What appears to have been done is to make the 1900 to 1919 period .15 degree C colder; make the 1920 to 1939 period .1 degree C colder; make the 1940 to 1959 period about .05 degree C colder and then make the 1960 to 1979 period about .025 degree C warmer. By doing this they made the 1960 to 1979 period warmer than the earlier 1940 to 1959 period such that the “look” of the data fit the narrative of the alarmist message being promoted by Hansen (who was still employed by NASA during this time) and Gore of dangerous anthropogenic global warming. The data after the 2012 change shows a very clear ~.35 degree C progressive warming, red arrow, from 1900 to 1979 compared to less than ~.2 degrees C prior to 2012, black arrow, and it also gets rid of the 1940 to 1959 warm period which doesn’t match the overall message being promoted.
It’s hard to image how this change could come about without conscious effort being applied to make this the end result; it’s just too convenient to be by chance.

I have read this before somewhere, just like you are saying.
Sent from my iPad
>
LikeLike
Its common knowledge that they do this but this shows how bad it is. You can’t get the full effect if you don’t have the actual values, which I have.
LikeLike
Here in Australia the Bureau of Meteorology is working hard adjusting temperatures. Their speciality is to change cooling trends with rising trends.
http://kenskingdom.wordpress.com/2010/02/05/giss-manipulates-climate-data-in-mackay/ was an early blog. Since then Ken has started working through the 104 “gold standard” stations in the ACORN database, and has managed to check 83.
The ACORN figures are then fed to NASA, HADCRUT etc.
If this is going on elsewhere** then they will claim at some future date “it wasn’t us, we used the figures supplied”.
**Don’t bet your shirt on it not happening except, perhaps, Outer Mongolia.
LikeLike
No bet from me the only ones that aren’t faking the data are me and the rest of the planets flat earther’s … 🙂 I’m working on a alternative method for determining the “real” sensitivity for CO2 it looks very promising and I expect to post it here before the end of the month. Of course only a flat earther would understand it as the scientific community seems to have lost there way … 🙂
LikeLike