Homogenized Anomalies
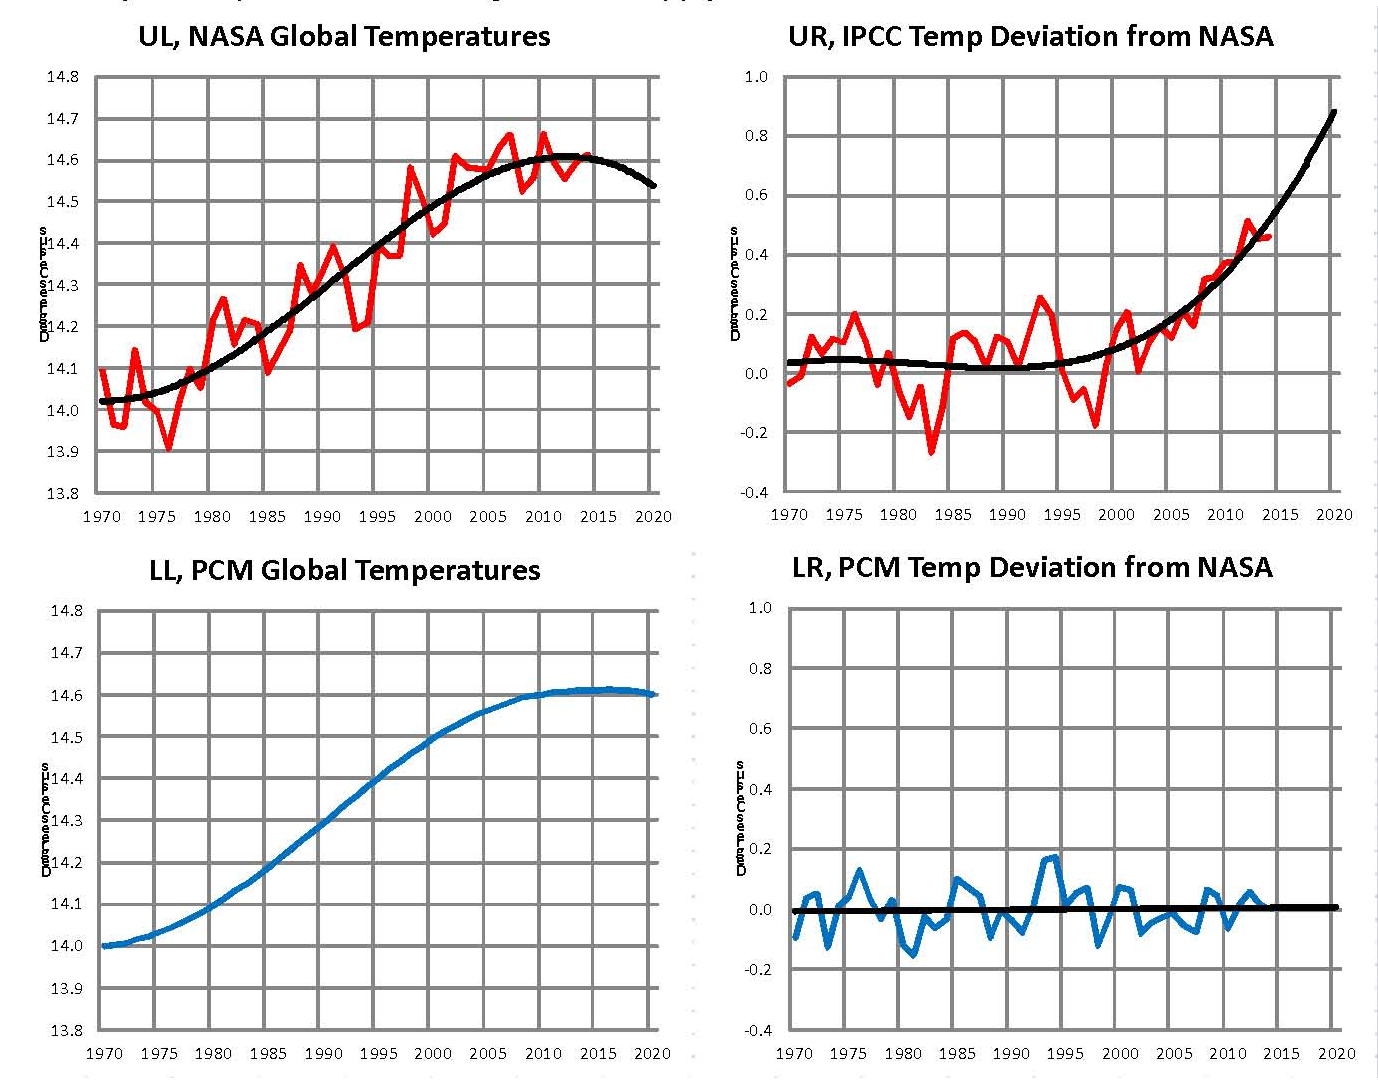
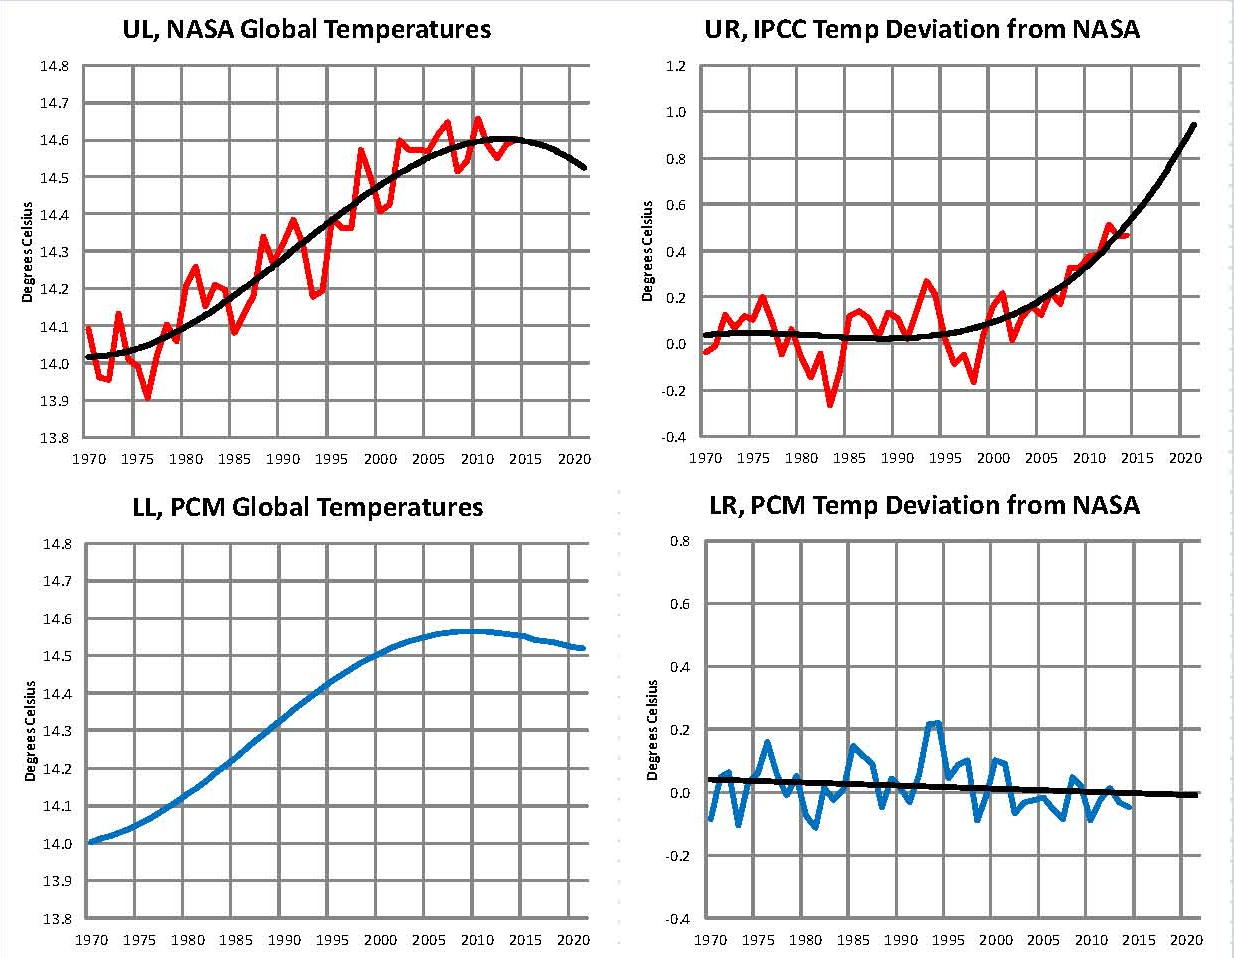
NASA makes an attempt at determining the World’s temperature each month and publishes the result around the middle of each month in various reports one of which is called the Land Ocean Temperature Index, or LOTI. This table of values is published back to January 1880 and the lasted version includes temperatures though April 2014, or 1,600 values. However, rather than publish an actual temperature they first establish a base of 14.0 degrees Celsius and then using a complex algorithm determine a value higher or lower than the 14.0 degrees Celsius base in hundredths of a degree which they call an anomaly, i.e. 13.5 degrees Celsius would be -50 and 14.5 would be +50. Each month when the new table is created using this process called “homogenization” NASA recalculates all the temperatures all the way back to January 1880.
After several years of studying the published values, sometime in early 2013 as I remember it, a major change was noticed in the 2012 published values from those in earlier periods. Previous to this minor changes of a few hundredths of a degree were commonly observed in the LOTI data but they just appeared to be random or rounding changes, which would be normal in a process like NASA uses, so they were ignored. The reason is that a few pluses and a few minuses would mostly cancel out and could be ignored as having no real affect. What was observed was something much different and so an in depth analysis was made of the entire set of 13 available tables and then by entering all the data for 8 of them plus 5 new ones into a spreadsheet which created a table with now over 22,000 values, which could be reviewed.
To simplify the analysis the data for the 13 reports was looked at in ten year blocks e.g. January 1880 to December 1889 which would be 120 values and an average determined; this would eliminate any random or rounding changes. This was done for the period January 1880 through December 2009 creating a Table of 169 values which were placed into an Excel Chart. What should have been observed would be a more or less horizontal line across the Chart for each time block for the average value of the NASA anomaly for that period. Instead what was observed were major shifts mostly down meaning colder in a large number of the ten year time blocks all occurring during 2012; meaning that a programming change must have been made that shifted around entire blocks of temperature anomalies. This has to be intentional and not random.
Rather than show all 13 plots four new ones were created to show where the major change was and they are plotted here as 1900 to 1919, 1920 to 1939, 1940 to 1959 and 1960 to 1979 each plot containing 240 values for each of the 13 NASA LOTI reports. Virtually all the 13 original time blocks showed this kind of shift, some up and some down in values, but since many overlapped it was hard to track the individual plots and this simplified version shows the core of what was done with the temperatures without the distraction of too many plots.

It’s obvious that there has been a major shift in the values shown in NASA table LOTI during these four 20 year periods totaling 80 years; shown in the area contained in the blue oval with the question mark. What appears to have been done is to make the 1900 to 1919 period .15 degrees colder; make the 1920 to 1939 period .1 degree colder; make the 1940 to 1959 period about .05 degrees colder and them make the 1960 to 1979 period about .025 degrees warmer. While doing this they made the 1960 to 1979 period warmer than the earlier 1940 to 1959 period such that the look of the data fit the narrative of the alarmist message being promoted by Hansen and Gore of dangerous anthropogenic global warming which was the original message being promoted at the time. The data after the 2012 change shows a very clear ~.35 degree progressive warming, red arrow, from 1900 to 1979 compared to less than ~.2 degrees prior to 2012, black arrow, and it also gets rid of the 1940 to 1959 warm period which doesn’t match the overall message being promoted.
It’s hard to image how this change could come about without conscious effort being applied to make this the end result; it’s just too convenient to be by chance.
Sir Karl Raimund Popper (28 July 1902 – 17 September 1994) was an Austrian and British philosopher and a professor at the London School of Economics. He is considered one of the most influential philosophers of science of the 20th century, and he also wrote extensively on social and political philosophy. The following quotes of his apply to this subject.
If we are uncritical we shall always find what we want: we shall look for, and find, confirmations, and we shall look away from, and not see, whatever might be dangerous to our pet theories.
Whenever a theory appears to you as the only possible one, take this as a sign that you have neither understood the theory nor the problem which it was intended to solve.
… (S)cience is one of the very few human activities — perhaps the only one — in which errors are systematically criticized and fairly often, in time, corrected