The Government continues to flounder with directionless and inconsistent energy policies, inviting much public commentary, but the science these days scarcely gets a mention.
As we have seen in social policy, the strategy of the left is first to shut down debate and delegitimise any dissent from the position adopted by the left-leaning elements of the media, academia, bureaucracy, the environmental movement and renewable-energy interests.
Lacking the capacity to distinguish science from pseudo-science, the Coalition under Howard effectively acquiesced to the totalitarian-left idea that the science on global warming was settled. It dared not question the assertion that carbon dioxide was causing dangerous global warming for fear that it would be loudly denounced and ridiculed as being in denial about the harmful effects that our emissions of carbon dioxide were supposed to be having on the climate.
In doing so, the Coalition allowed the totalitarian left to define the terms of the debate. But, let us do the impermissible and look at the science behind the question of whether carbon dioxide is causing dangerous global warming.
The scientific method for investigating a new idea is to pose two falsifiable hypotheses: the null hypothesis and the alternative hypothesis. The null hypothesis tests the most obvious explanation; and the alternative hypothesis tests the new theory that the scientist is bringing to bear on the issue.
In the context of global warming, the null hypothesis is that the warming observed since the onset of industrialisation is due to natural causes; the alternative hypothesis is that this warming is due to anthropogenic carbon-dioxide emissions. Both hypotheses must be tested and the objective is to see which of these two hypotheses is incompatible with the data. That is, we are attempting to falsify one or the other or both of the hypotheses (since it is conceivable that there is another human-related cause of the global warming which has not yet been thought of).
A hypothesis can never be proved by this method but it remains viable only as long as it remains consistent with the data. You must not cherry-pick your data; the hypothesis must be consistent with all of the available data. It takes only one instance of the hypothesis being found to be inconsistent with the data for it to be falsified; and this is why the science is never “settled”.
One must begin by assembling all of the available data. The data we are concerned with in this issue are the temperature and atmospheric carbon-dioxide data. The temperature data consists of the meteorological record that has been collected using various instrumental techniques since the 1850s, and also data from various “proxy” sources that enable the temperature record to be inferred. This may be done from such techniques as the measurement of isotope ratios in gas samples extracted from ice cores and seabed cores.
Using these proxy sources of temperature data, scientists have been able to reconstruct the temperature history of the planet going back thousands to hundreds of thousands of years and beyond. Samples collected from ice and seabed cores can also be used to determine the concentrations of carbon dioxide present in the air over those periods.
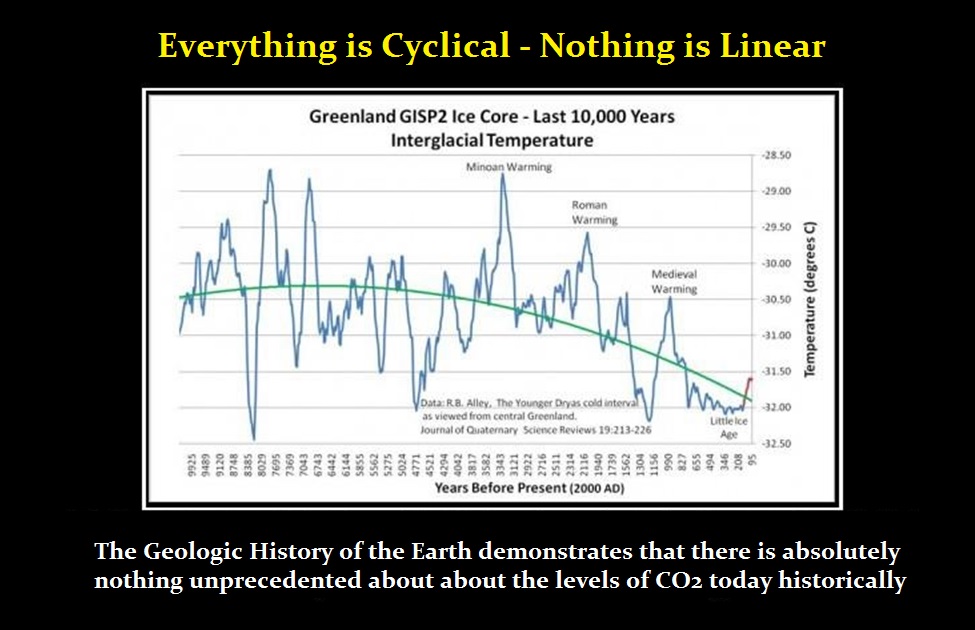
Figure 1 shows one example of data derived from such proxy sources. The top panel of the figure shows a declining temperature trend over the 8,000-year period from the Holocene Climate Optimum to the modern warm period (left-hand scale). It also shows that this location experienced numerous cycles of warming and cooling that involved temperature changes of the order of two degrees Celsius.
The superimposition of the temperature data from the modern period instrumental record (dotted line and right-hand scale) provide a very appro-ximate context to the late 20th-century warming.
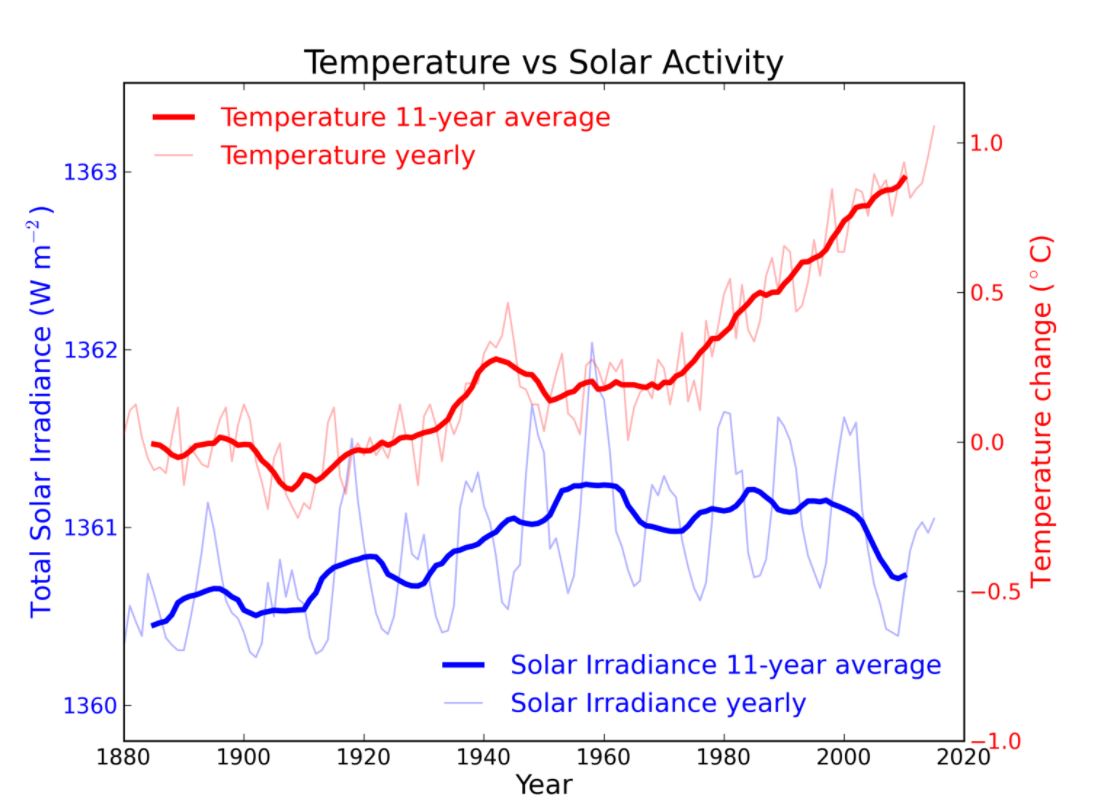
The lower panel shows that the carbon-dioxide concentration over the same period has been consistently increasing. Neither the cooling trend nor the cyclic behaviour of temperature is reflected in the carbon-dioxide record in the lower panel. Therefore carbon dioxide cannot be causing the observed temperature changes. No causation can exist if there is no correlation.
These data clearly show that whatever effect carbon dioxide may have on the temperature, it is far outweighed by other factors: and this falsifies the hypothesis that carbon dioxide causes dangerous global warming. The data show that there is nothing unusual about the current episode of increased global temperature in either its timing or its amplitude, which lies well within the bounds of natural variation.
From these data we cannot ascribe any cause to the current warming event, nor is it necessary to do so. We simply observe that the data are seen to be consistent with the null hypothesis that the modern warming is due to natural causes, and inconsistent with the alternative hypothesis that this warming is due to carbon dioxide. We do not need to understand the details of the operation of the climate system, which so occupies the Intergovernmental Panel on Climate Change (IPCC).
It is important to recognise that no single data set is ideal. All available data sets have their limitations, including those of Figure 1. It is equally important to recognise that all of the available data must be considered. It is not valid to simply disregard data that don’t suit you when there is no satisfactory data set available to provide all the information required on its own.
The data most commonly relied upon in making the case that carbon dioxide is causing dangerous global warming are the data from the instrumental meteorological record. Over the 167-year period of the meteorological record, it is not possible to observe the extent of natural variation in temperature that can be seen in the proxy record of figure 1. Therefore the meteorological record is incapable of being used to test the null hypothesis. This makes the meteorological record the least useful of the data sets that are available for answering the question of whether the warming observed over the last 100 years is due to increased carbon dioxide in the atmosphere. Conclusions based on these data alone are therefore worthless.
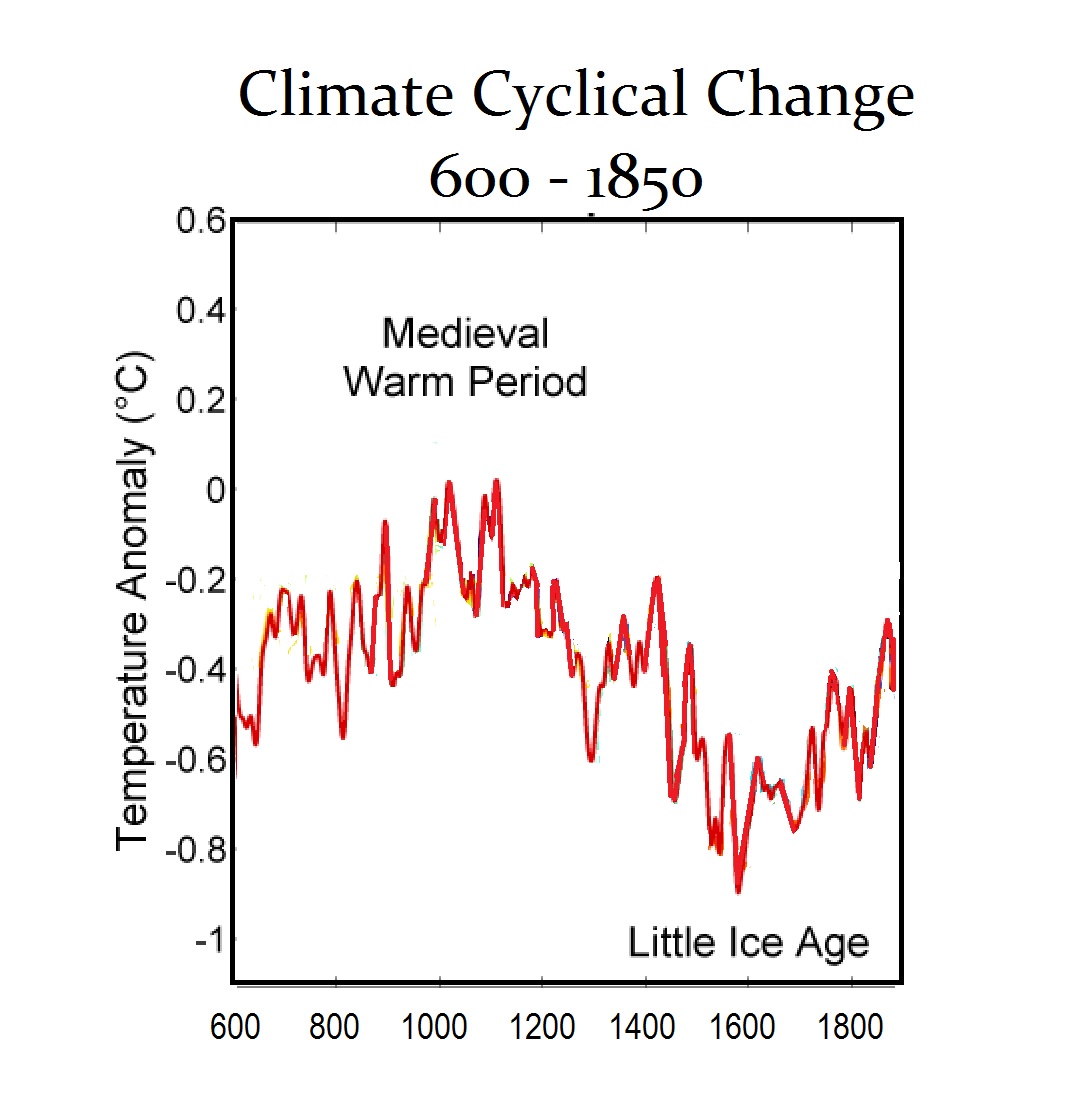
The main limitation of the data of Figure 1 is that they are derived from ice cores at a single location and cannot therefore be considered to represent the “global average” temperature that the meteorological record attempts to approximate. This does not mean that these data can be disregarded. There is evidence from a vast range of sources that the warming cycles of Figure 1, among them the Mediaeval Warm Period, The Roman Warm Period, the Minoan Warm Period and the Holocene Climate Optimum, did not occur only at the sites from which the cores were taken but were in fact widespread and probably global. (For a comprehensive discussion of the evidence, see Heaven and Earth. Global Warming: The Missing Science, by Professor Ian Plimer. Available from Freedom Publishing.)
It is probable, however, that the amplitude of the temperature excursions from the baseline in Figure 1 are somewhat larger than would be seen in a global average graph, if such a graph were available, since temperature variations in equatorial regions are usually smaller than temperature variations at higher latitudes. Nevertheless, the data cannot be ignored, because such data provide the best indication we have of the natural variability of temperature and provide the context within which modern-day warming must be considered. In this context, the current warming event appears to be just the latest in a long series of warming and cooling cycles.
The alternative hypothesis is seen to be completely inconsistent with the data and must be rejected since the 8,000-year declining temperature trend occurs in conjunction with a steadily increasing carbon-dioxide trend.
The current meteorological record shows that there has been no statistically significant warming over the past 19 years. This suggests that we may be at the peak of the current warming cycle and that the next temperature change is more likely than not to be the cooling phase of this cycle. This is consistent with the expectation by some astrophysicists that in the next 20 to 30 years we will encounter conditions similar to those of the Little Ice Age that were experienced during the last cooling cycle.
Under those conditions, the global-warming alarmists may come to regret their love affair with wind turbines that stop turning and solar panels which, in colder areas such as those located around Canberra, may become covered with snow if the southern hemisphere experiences a similar cooling to the northern hemisphere. The alarmists may then want to burn all the coal that they can get their hands on. That may become difficult if the Greens are successful in their push to have all coalmines and coal-fired power stations closed down. Do they seriously imagine that these natural climatic cycles have somehow stopped?
Changes in the climate can be expected and it is prudent to prepare for them. But whether it is warming or cooling, our ability to cope with the changes will depend on the availability of cheap and reliable power. It is deadly foolish to base our response to inevitable climate changes upon a theoretical understanding of the way that the climate system operates that is known to be inconsistent with the data and that would result in a complete inability to deal with the cooling that will inevitably come at some time in the future.
The cooling that was experienced in Europe during the Little Ice Age resulted in shorter northern-hemisphere growing seasons, crop failures, starvation, depopulation and the plague, and was far more deadly than any possible warming we might face. (Again, see Plimer, Heaven and Earth.)
Although there is endless reporting and commentary about the danger of global warming, there is no mention of the data supporting the anthropogenic global-warming hypothesis because no such data exist. Discussion always diverts to such matters as modelling, sea-level changes, weather events, reef bleaching, melting ice caps or any of a myriad other phenomena in which changes have been observed.
If you study nature you will always observe change, but these changes must be seen in their proper context. All of these changing phenomena may (or may not) be signs of warming. But signs of warming are precisely what one would expect to see at the peak of a warming cycle and they tell us absolutely nothing about the cause of the warming. To test the hypothesis that it is carbon dioxide that is causing the warming we must turn to carbon dioxide and temperature data: and they show that whatever the cause of the warming is, it is not carbon dioxide, whose warming effect, such as it is, is clearly outweighed by natural factors.
Any attempt to imply that rises in sea level, for example, are a sign that carbon-dioxide emissions are the cause of global warming is bogus science (there are other reasons why sea levels might rise). It is effectively saying that the hypothesis that carbon dioxide is causing global warming is being supported by another hypothesis: that sea-level rises are due to global warming, which is due to carbon dioxide. Or that the bleaching of the Great Barrier Reef is due to the warming of the oceans, which is due to global warming, which is due to carbon dioxide.
You cannot support a hypothesis with another hypothesis or even a series of hypotheses. That is bogus science. The test of the global-warming hypothesis can only be made against the carbon-dioxide and temperature data.
In a similar vein, any attempt to assure us that we must cut emissions because if we add more carbon dioxide to the atmosphere we will reach a “tipping point” that our theory (and our models) show will bring us catastrophe, is also bogus science. Such a line of reasoning is effectively saying: “Don’t take any notice of the data that falsify our global-warming hypothesis. No, we have a theory about how the climate system operates and our understanding of this system is much better at telling how carbon dioxide affects the climate than the data. We know about triggers and tipping points and whatnot, and if we keep adding to the carbon dioxide it will bring catastrophe – just you wait and see.”
That is not science; you cannot support a hypothesis with a theory. The theory is, after all, based on the premise that the hypothesis is true: but the data show that it is false. When vascular plants evolved on earth some 400 million years ago, the carbon-dioxide concentration was more than 10 times the current level, and that did not cause tipping points or runaway global warming; yet we are asked to believe that a mere doubling of carbon dioxide from the very low levels we see at present will bring catastrophe.
Those who claim that carbon dioxide causes dangerous global warming need to produce data that force the rejection of the null hypothesis: that the warming is due to natural causes. This has not been done and, in the absence of those data, the global-warming hypothesis must be regarded as nothing but a theory based on a premise that is known to be false.
For all the costs that “clean” energy policies and high energy prices impose on household, business and national budgets, there can be no possible bene-fit, since the proposition that carbon dioxide causes dangerous global warming is falsified by the data.
One must ask: how can the government have got it so wrong, since the government has access to the best scientific advice available?
The answer to that has two parts. The first, as alluded to earlier, is that the left long ago completed its march through the institutions – including the scientific institutions – so the overwhelming majority of advice to the government conforms to the so-called “consensus” view. The second is that there are too few people entering the ranks of Parliament who understand science and who recognise when they are being fed pseudo-science by those providing the advice.
As the late Professor Bob Carter pointed out, it was not until the election to Parliament of Dr Dennis Jensen as a Liberal Member for the House of Representatives in 2004 that the Liberal Party had anyone with the scientific qualifications and training to discern the pseudo-science from the science and develop an informed approach to the global-warming issue. Dr Jensen displayed a healthy scepticism about the global-warming alarmism in his maiden speech to Parliament.
Unfortunately, Mr Howard did not put him in charge of global-warming policy. Instead, the Liberal Party continued to struggle with the issue while the myths and falsehoods associated with global warming took hold and green ideology took the moral high ground in professing to be intent on saving the planet from “carbon pollution” and the dangerous global warming it was alleged to cause.
Malcolm Turnbull entered Parliament in the same year as Dr Jensen and, in the biggest mistake of his career, Mr Howard in 2007 placed the left-leaning Turnbull in charge of Environment and Water Resources, presumably to give his environment policies some “green credentials”. The opportunity to tackle the global-warming falsehoods and develop a rational energy policy was thereby lost.
The election of Donald Trump to the presidency of the United States and his rejection of the Paris Climate Change Agreement, however, provide the Australian Government with an opportunity to admit its mistake and change direction on global warming and energy policy and thereby give itself a chance of snatching victory from the jaws of defeat at the next election. It needs to find a leader who can tackle this issue head on in the face of the furious opposition that it will encounter from the ABC and the rest of the media, academia, the bureaucracies, and vested interests in the scientific and renewable energy industries.
It will be a tough fight, but it is a fight that can only be fought from within government and not from opposition. It is only when you control the appointments and the purse strings that it is possible to challenge those presenting pseudo-science as evidence and dismiss those who will not properly deal with the scientific objections to the global-warming “consensus” position.
I believe it is the only way this nation can be saved from the high energy costs that are crippling our industries and punishing household budgets. Providing strong support to President Trump on this issue might even begin to turn around this insanity globally and allow the availability of cheap and reliable power to lift underdeveloped nations out of the poverty that currently denies them access to electricity, clean water and sanitation.
Dr Ian Flanigan (retired) obtained a PhD in chemistry at the Research School of Chemistry (ANU).

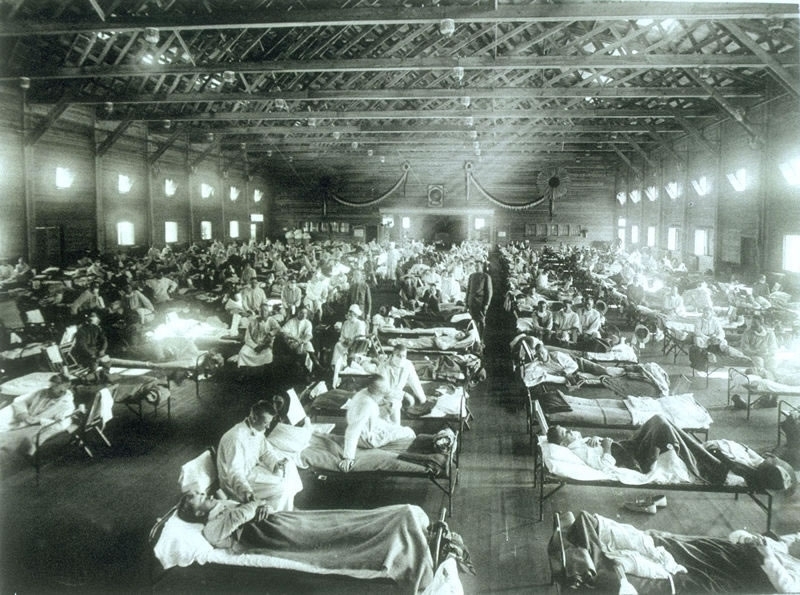 There was a sharp climate drop in 1916 creating a spike low in temperature. This 1916 spike low in our climate coincided with war and made this a devastating war aside from the poison gas. This was then combined with terrible influenza or flu pandemic of 1918 to 1919, which was the deadliest in modern history. This pandemic infected an estimated 500 million people worldwide or about one-third of the entire planet’s population. It killed an estimated 20 to 50 million victims.
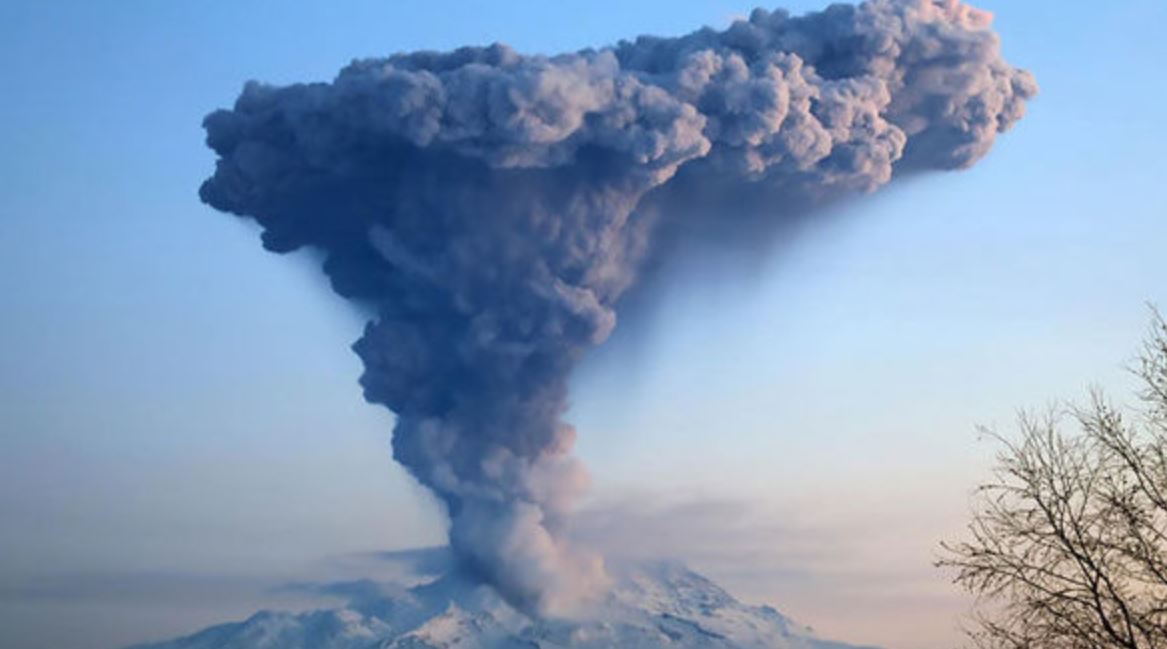
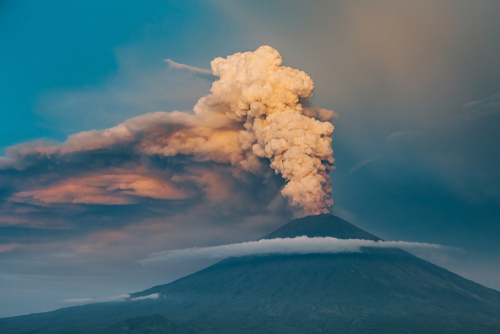
 What I can confirm is that volcanic eruptions play a tremendous part in creating Global Cooling, which is our real threat going into the next decade. Volcanic activity is rising again from Mount Tambora to Yellowstone. Evidence suggests that
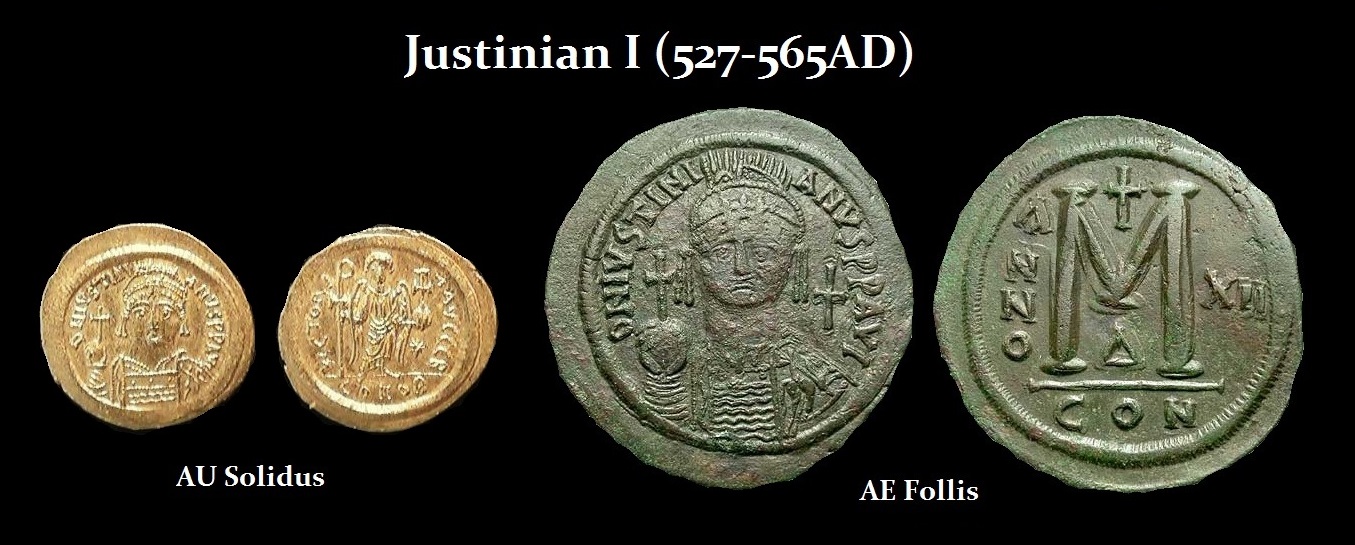
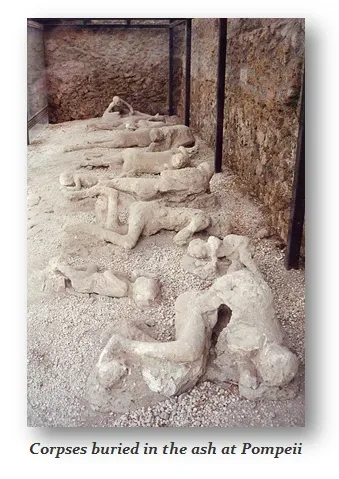 If we assume the 8.6-year cycle applies to this type of event given even the precession of the Equinox is a derivative 25,800 years (3×8.6), then we should see key markers along the way about every 224 years. If we look backward in time, we look to 1705BC, which was followed by the eruption of Thera (Santorini) which destroyed the Minoan Empire. Two cycles back from 535 brings us to 87AD, which was a period that also marked the eruption of Vesuvius in 79 AD is probably the best known volcanic eruption in world history since it buried Pompeii and Herculaneum.