
Trump runs his campaign just like he runs his business and that is to WIN which is, after all, what it is all about. We did get to the top by wining not loosing and Obama and Hillary have don’t nothing but loos for the past 8 years.
Tag Archives: 2nd amendment
Donald Trump Tells GOP Leadership: “Get Strong, Be Smart and Get Cool”…
Trump knows what it takes to WIN not just run … 🙂
R.A.T. Romney and The Rejected Republican Race-Baiters…
What Trump has in store for the members of the DC UniParty traitors is Trickle Down Jail … starting at the top with Hillary and Obama.
Email Release: Secretary Clinton Sold State Dept Position To Clinton Foundation Donor…
It is totally amazing how both Clinton’s are not in jail.
Employment and Unemployment 2006 verse 2016
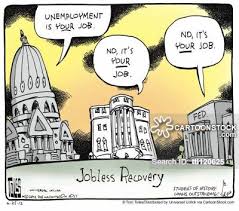
Last Friday June 3, 2016 the Bureau of Labor Statistics (BLS) published their “Employment Situation — May 2016” report which contained a number of surprises; the biggest one was that we had a 4.7% unemployment rate. This number and other “surprises” are surprises only because the government has no clue what is really going on in the economy; which is a major paradigm shift in the workforce based on all the new Federal requirements such as Obama Care which makes it more and more expensive for a company to have employees, therefore they either automate or ship work, jobs, out of the country. The following Table One is a summary of some of key items shown in Table A-1 in that report, the numbers are in thousands.
Table One, Thousands
Class March 2016 May 2016 Change Change %
Civilian population 252,768 253,174 +406 +.16%
Labor Force 159,286 158,466 -820 -.51%
Employed 151,320 151,030 -290 -.19%
4.7% Unemployed 7,966 7,436 -530 -6.65%
Not in work force 93,482 94,708 +1,226 +1.31%
The biggest thing that stands out in this report is that from March 2016 to May 2016 a total of only three months there are 290,000 fewer people working in May than March but simultaneously the unemployment rate went from 5.0% to 4.7%. That happened only because 1,226,000 people dropped out of the workforce, in two months, really? So it would seem that the easiest way for the government to lower unemployment is to take people out of the work force then to make it easier or less costly to have more employees.
This change happened by manipulating the values in Table One where we see that the Civilian population went up by 406,000 and the labor force shrunk by 820,000 the sum of the two is where the 1,226,000 comes from. 406,000 people should have entered the workforce and to keep unemployment at 4.7% the work force would need to be 159,692,000 the employed would then be 152,187,000 and the number unemployment would be 7,505,000. The bottom line is that for the 4.7% to be real there should have been 867,000 more people working then we actually have employed now.
A more telling look at this above information shown in Table One would be to compare May 2016 to an older report from August 2006 which was less than 10 years ago and the last time before the great recession that the unemployment rate was also 4.7% so it would be a very reasonable comparison to make. This look back is shown in the following Table Two where these figures are also taken from the Bureau of Labor Statistics “The Employment Situation: August 2008” also taken from Table A-1, the report name was a bit different back then but it is the same report.
Table Two, Thousands
A comparison from 10 years ago when the Unemployment rate was also 4.7%
Class Aug 2006 May 2016 Change Change %
Civilian population 229,167 253,174 +24,007 +10.48%
Labor Force 151,698 158,466 +6,768 +4.46%
Employed 144,159 151,030 +6,871 +4.77%
4.7% Unemployed 7,119 7,436 +317 +4.45%
Not in work force 77,469 94,708 +17,239 +22.25%
What we see is that the civilian populations increased by 10.48% while the labor force and employed and unemployed increased by only 4.56% (average of the three) resulting in the “Not in the labor force” jumping by a whopping 22.25% and therein lies the issue that we face now; too many people not working which places a heavy burden on those that are. Couple this with the shift in jobs from manufacturing to service which brings lower wages (separate analysis need to support) and you get the political situation that has given us Trump and Bernie.
Trump is right with Make America Great Again and the Democrat counterpart Bernie is just more free stuff which continues us down the present path at a faster rate. The other Democrat Hillary is only about more money and power for herself and her circle of friends, she is the only one not telling the truth about who she is. To be fair the RNC’s initial pick of Jeb Bush, eliminated by Trump, would not have been much different than Hillary, both want the same policies. The Republican voters picked Trump as he tells us that we can go back to the period where we were strong meaning we had good jobs and decent incomes. The next table will show us what the US would have looked like had Trump been elected in 2008.
Table Three will be constructed by taking the May 2016 and adjusting the values to be consistent with the 10.48% increase in the population shown in the first line of Table Two. We use the August 2006 value as it is also 4.7% unemployment but in addition the previous months are similar to that found previous to May 2016. That will show us where we should be verses where we are, in other words what Trump is telling us is that America should have been what is shown in Table Three and we are not there because of Obama Hillary and the progressive left.
Table Three, Thousands
A comparison from 10 years ago when the Unemployment rate was also 4.7%
Class May 2006a May 2016b Change Change %
Civilian population 253,174 253,174 0 0.00%
Labor Force 158,466 175,073 +16,607 10.48%
Employed 151,030 166,858 +15,828 10.48%
4.7% Unemployed 7,436 8,215 +779 10.48%
Not in work force 94,708 104,633 +9,925 10.48%
Right now there should be 166,858,000 people employed and drawing a paycheck, instead we only have 151,030,000 working; therefore we are short 8,957,000 jobs. And that is why the Trump movement is there, he didn’t create the movement the movement created him. Further if we had 8,957,000 more people working the GDP of the country would be $19.3 T instead of $17.4 T assuming the same job mix as existed in 2006. This number is easily calculated by dividing the $17.4 T GDP by the 151 M workers which gives us $115,232 of GDP per worker; and then we multiple that by the 166,858,000 workers that we should have and we get a GDP of $19.3 T.
So we are missing 8,957,000 jobs and almost $2.0 T of GDP so just think what a difference that would have made if we had actually elected a good president. McCain might have been a bit better than Obama but not by much so there really was no good choice in 2008.
Father of San Jose Victim Speaks To Media…
The “media” is bought and paid for by the Uni-Party (UNC) which is made up of the Washington Democrats (DNC) and Republicans (RNC) and financed by Wall Street. There only goal is to keep the money flowing to themselves and that is why the have to destroy Trump by any and all means. Sam Jose was just the beginning of what will be seen between now and November.
San Jose Police Chief Says: Community Criticizing Him For Doing “Too much to protect Trump supporters”…
California is now a state in transition and will soon be joining the rest of the well run Hispanics states across the world.
Rat Fink Ryan Pushes Passage of Puerto Rico (Bain Capital Bond Seller) “Rescue” Through House…
Top fat cats get baled out and everyone else gets screwed just like always! Systems like this always fail and ours is no exception.
Oh My – New York Times Quietly Discusses Data Evidence of “The Monster Vote”…
I hope and Pray that this model holds and Trump can pull it off; but I also fear that “they” will attempt an assassination on Trump if it looks like that Hillary can not win by say, mid October.
Bernie Betrays all his Supporters
Armstrong Economics Blog
Re-Posted Jun 9, 2016 by Martin Armstrong

Of course Bernie Sanders appears to have sold out emerging from a White House meeting with President Barack Obama vowing to work together with Hillary Clinton to defeat Donald Trump in November. Bernie would rather endorse a traitor who has sold her influence as Secretary of State just to save the Democratic Party. Obama assured Bernie, no doubt, that he would not allow Hillary to be indicted. And to further rig the game, the State Department refuses to release her emails until AFTER the election. But the actual date they gave was November 31st, 2016, which does not exist since November has only 30 days. Once she is president, no doubt they will vanish altogether.
It appears that Bernie is betraying all those who supported him. Hillary will raise $1 billion to buy the White House. That kind of money does not come from bankers without strings. Wall Street supports Hillary – not Trump. That says it all. How Bernie can just give up is amazing. What happened to his “revolution” will never be discussed.

