My contribution to Make America Great Again


Below is a copy letter I sent to the President two weeks ago to help him in his MAGA program. I’m an inventor and in the spirit of making America Great Again, I have offered to give all the technology embodied in my latest patent (first page image below the letter) to any company that will use any of that technology to build products or components in the United States free of any strings. Its a gift to my country for the privilege of living here.

I’m posting this letter on my blog because I seriously doubt that it will get to the president. And this offer is real and I will talk with any company that is interested. This is an issued patent so anyone can find it on the Patent and Trade Mark office if they want to read the claims.

The Coldest Winter 2017/2018


QUESTION: Mr, Armstrong; You said this year your computer is forecasting the coldest winter in a long time. I assume this is cyclical. Is this due to the sun diming?

KE

ANSWER: Yes, that is part of it. We look at correlations and what lines up with that is also a disruption in the Polar Jet Stream. That is how Ice Ages unfold. Pictured here is the normal picture of the Jet Stream. What correlates with the decline in the energy output of the sun appears to be the Polar Jet Stream plunges south even into Mexico.

This was what took place in early December. This will become a more common occurrence this year. Therefore, it will snow in the South and even into Mexico. Florida should escape the plunge, however, it will be unseasonably cooler by probably 10 degrees at the extreme points of reference.

So much for Global Warming. By the time we get to 2024, people will be willing to pay a tax to get warm.

Cold Wave Hits Thailand


Our staff in Thailand are reporting – “It’s Cold!” They are wearing coats in a place that is normally 30c (86f). Weather will continue to get strange in a lot of places around the globe. The decline in the energy output of the sun is extremely rapid and far more than anyone expected this quickly (see Bangkok Post).

The Sun is Cooling Faster than Anyone Suspected


The danger from the Global Warming crowd is that they are misleading the entire world and preventing us from what is dangerously unfolding that sparks the rapid decline in civilization – GLOBAL COOLING. I previously warned that this is not my opinion, but simply our computer. If it were really conscious it would be running to store to buy heating pads. This year will be much colder for Europe than the last three. It will also be cold in the USA. We are in a global cooling period and all the data we have in our computer system warns that the earth is turning cold not warm.

This cooling is very serious. This decline in the energy output of the sun will manifest in a commodity boom in agriculture as shortages send food prices higher. We will see famine begin to rise as crops fail and that will inspire disease and plagues. We will see the first peak in agricultural prices come probably around 2024 after the lows are established on this cycle. We have been warning that this rise would begin AFTER 2017.


Previously, I have reported that NASA confirmed we are going into a cooling period – not warming. They have put out a forecast of declining sunspot activity. Now NASA has come out confirming what our computer has been forecasting. They have reported that as the sun is experiencing a rapid decline in sunspots, it is also dimming in brightness or energy output. NASA’s Spaceweather station has recorded during 2017, 96 days (27%) of observing the sun have been completely absent of sunspots.

I have also previously warned that there is a 300-year cycle to this entire phenomenon. This cycle has aligned with the major turning point of the Economic Confidence Model 2015.75. During 2015, there were ZERO days observed without sunspots. The following year, 2016, came in with 9% of the days recorded without any sunspot activity. This jump to 27% here in 2017 is a substantial jump from 2015 that we cannot afford to ignore.

NASA launched a new sensor which is the International Space Station named TSIS-1. Its mission is to actually measure the dimming of the sun’s irradiance. It will replace the aging SORCE spacecraft and NASA has confirmed our computer forecast that the number of sunspots in this cycle will fall rapidly as it plunges into a date with its 11-year cycle minimum.

1918 InfluenzaHospitalThere was a sharp climate drop in 1916 creating a spike low in temperature. This 1916 spike low in our climate coincided with war and made this a devastating war aside from the poison gas. This was then combined with terrible influenza or flu pandemic of 1918 to 1919, which was the deadliest in modern history. This pandemic infected an estimated 500 million people worldwide or about one-third of the entire planet’s population. It killed an estimated 20 to 50 million victims.

This pandemic began in the spring of 1917 and some sources point to troops in France as being the center of the pandemic. A significant precursor virus, harbored in birds, mutated to pigs that were kept near the front. Others place it with troops in Austria. Nevertheless, influenza ran from mid-1917, became noticeable by January 1918, and continued into December 1920. The unusually deadly influenza pandemic shortened the overall life expectancy by 12 years. This influenza killed the strong rather than the weak since it thrived on the overreaction of the body’s immune system. The strong immune reactions of young adults fed the virus, whereas the weaker immune systems of children and middle-aged adults resulted in fewer deaths, which was very unusual.

Sunspot_Numbers

Across the entire electromagnetic spectrum, the sun’s output is declining. I personally hate cold. So this is not a forecast I want to see happen. Nevertheless, our computer has correlated this cooling trend with disease and it appears that famine also plays a role in this entire event. Additionally, a simple correlation with the energy output of the sun reveals that all major earthquakes occurred during strong solar minimums, which we are head smack into.

Consequently, there were 7 major earthquakes of 8.0 magnitude moving into the turning point in 2008-2010. Kiril Islands (Russia) twice- 8.1 (November 2006 & January 2007), Peru-8.0 (August 2007), Sumatra-8.5 (September 2007), Sichuan earthquake-8.0 (May 2008)Samoa-8.1 (September 2009), Maule (Chile)-8.8 (February 2010).

There are ways you can prepare. But do prepare. Do not wait until the very last second.

Federal Reserve is Responsible for Global Warming


COMMENT: Marty,


I was looking at the Global Warming Chart, at the red line and saying to myself, “That look awfully familiar.” Then I got it.


Note how the red line drops down from 1907 to almost 1913, gets a WWI bump and then rises steadily to about 1938. Then it really goes up for World War II, reduces down in 1956 and goes steady-eddy for the rest of the 50’s and 60’s. Then right on clue it begins to rise sharply in 1971 and hasn’t looked back. Global warming isn’t being caused by CO2. It is being caused by an excessive increase in credit, or more specifically the increase in the money supply. M2. What do you know? The Quantity of Money theory really does have an effect. And if this is true, the FED is more powerful than it realizes.


Just thought you’d like to know.

REPLY: Brilliant. You solved the whole crisis. The Fed is the problem and they take orders from Congress. There is the entire source. Besides altering the data, one must wonder if they did not fake it by using the money supply. They do not understand that things also shift in climate. New Jersey was tropical once and 1/3rd of the state is covered in what we called the Pinelands because it was sand and not soil. That region was all under water. Does that mean the sea was higher? No, the land shifted. Siberia is now warming while it snowed in Texas and Alabama.

Climate Change has Nothing to do with the Sun?


COMMENT: You are wrong. This chart proves you are wrong and it is mankind that is creating global warming. The sun activity has been declining for 35 years and the temperature is rising. That proves you are wrong.

PL

REPLY: First of all, the chart you rely on starts in 1880. The historical record is millions of years. Over 35,000 scientists have signed a letter stating Global Warming is fake. If I charted the Dow Jones for just the post-2009 period, I could conclude that the stock market only rises and never crashes. There is absolutely no empirical evidence whatsoever that proves Global Warming is caused by mankind when there have been warming periods and ice ages long before fossil fuels. It is one thing to say that our use of fossil fuels have “accelerated” the trend and something entirely different to argue that we have caused the trend.

The ice core sample proves there is about a 300 years cycle between the maximum and minimum energy output of the sun. Looking at just 140 years of data does not prove anything. I am glad you trust the government so much that they argue this so they can tax it. Like cigarettes, if they are 100% bad, then outlaw them. Never! Why do that when they can tax them?

If you want to argue the sun has nothing to do with this issue, then provide a study that goes back beyond 1880. If I am wrong, then perhaps all those who think they are the cause of the planet turning warm should walk to work, use no heat or air conditioning, purchase no clothes and make your own from sheep without consuming energy, or just commit suicide to stop breathing since you put out CO2 which you demonize as the planet killer.

Even NASA has come out and admitted it is going to get colder – not warmer. NASA has reported that Antarctic sea ice (different from Artic ice) reached a new record maximum. Don’t worry, we are going into a cooling period and that is when empires fall. So be patient, you will reduce CO2, you just may contribute your part to help that along.

Global Warming Causing California Wildfires?


Believe it or not, now the Global Warming crowd is trying to claim that the California wildfires are being caused by none other than Global Warming. “As global temperatures continue to rise, scientists say the risk of extreme fire seasons across the West is rising, too.” Anyone who has ever visited the Red Wood Forest in California stands in awe of the grandeur of the place. However, to the shock of many, the redwoods are nearly indestructible. They have evolved to withstand fires. That means, over millions of years, wildfires in California have existed long before humans were even there. The Global Warming people just never bother looking at the facts.


Siberian Volcano Suddenly Erupts


While all eyes have been on the volcano in Bali,  the Siberian Shiveluch Volcano erupted yesterday for over a 20 minutes spewing ash 6 miles (10 kilometers) high into the sky. The 1963 eruption in Bali was one of the largest and most devastating eruptions in Indonesia’s history. Nevertheless, it was still only a VEI5. Ideally, an eruption in Bali was due from a cyclical perspective in 2018.

In the case of the Siberian Shiveluch Volcano, there have been significant eruptions taking place in 1854 and 1956. The most recent eruption began again on August 15, 1999, and have continued periodically when on February 27th, 2015, Shiveluch erupted spewing ash into the atmosphere about 30,000 feet crossing the Bering Sea and into Alaska. From a cyclical perspective, this particular volcano was due to start again in 2017.

If we continue to get several volcanoes erupting into 2018, then this should be an active period and it will contribute to Global Cooling. Our models of food prices appear to be rising after 2018 moving into 2024. This would tend to indicate that we may indeed be looking at a rising in the volcanic activity in many places.

Climate Change – Volcanoes (Part II)


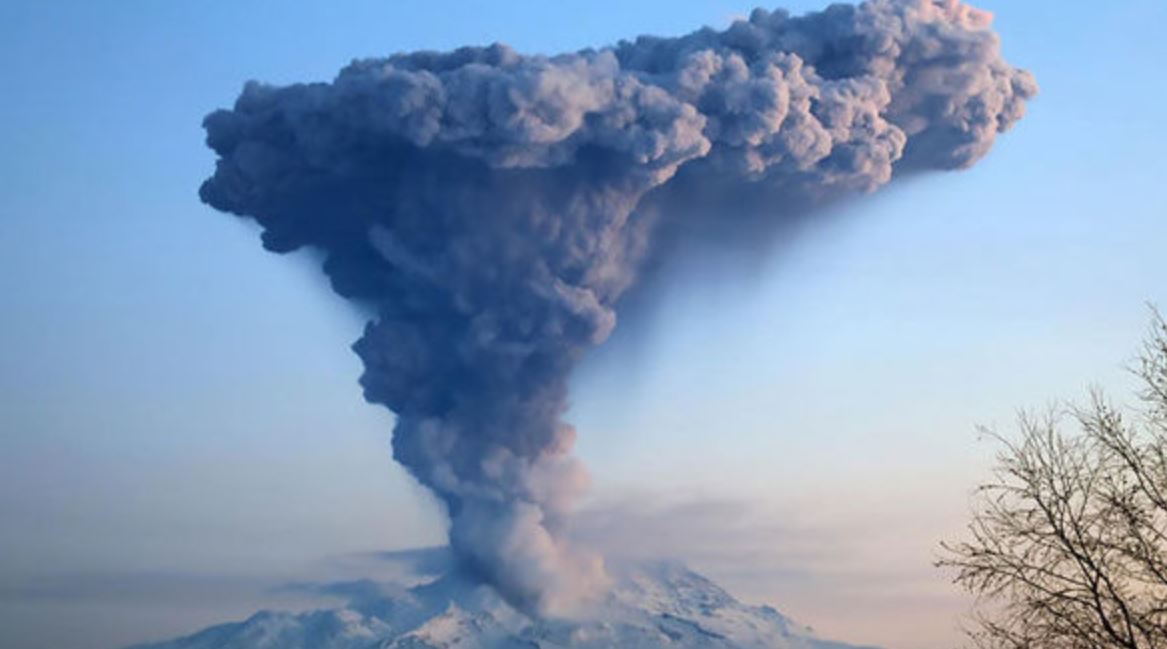
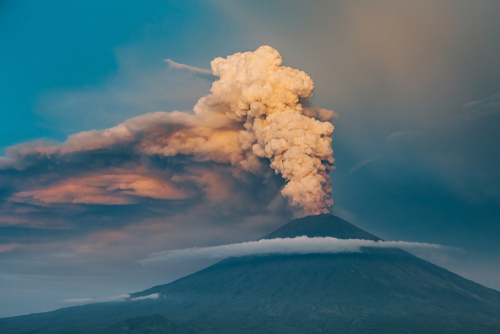
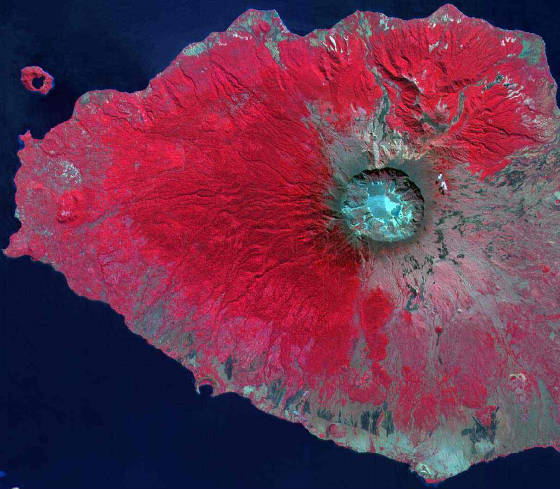
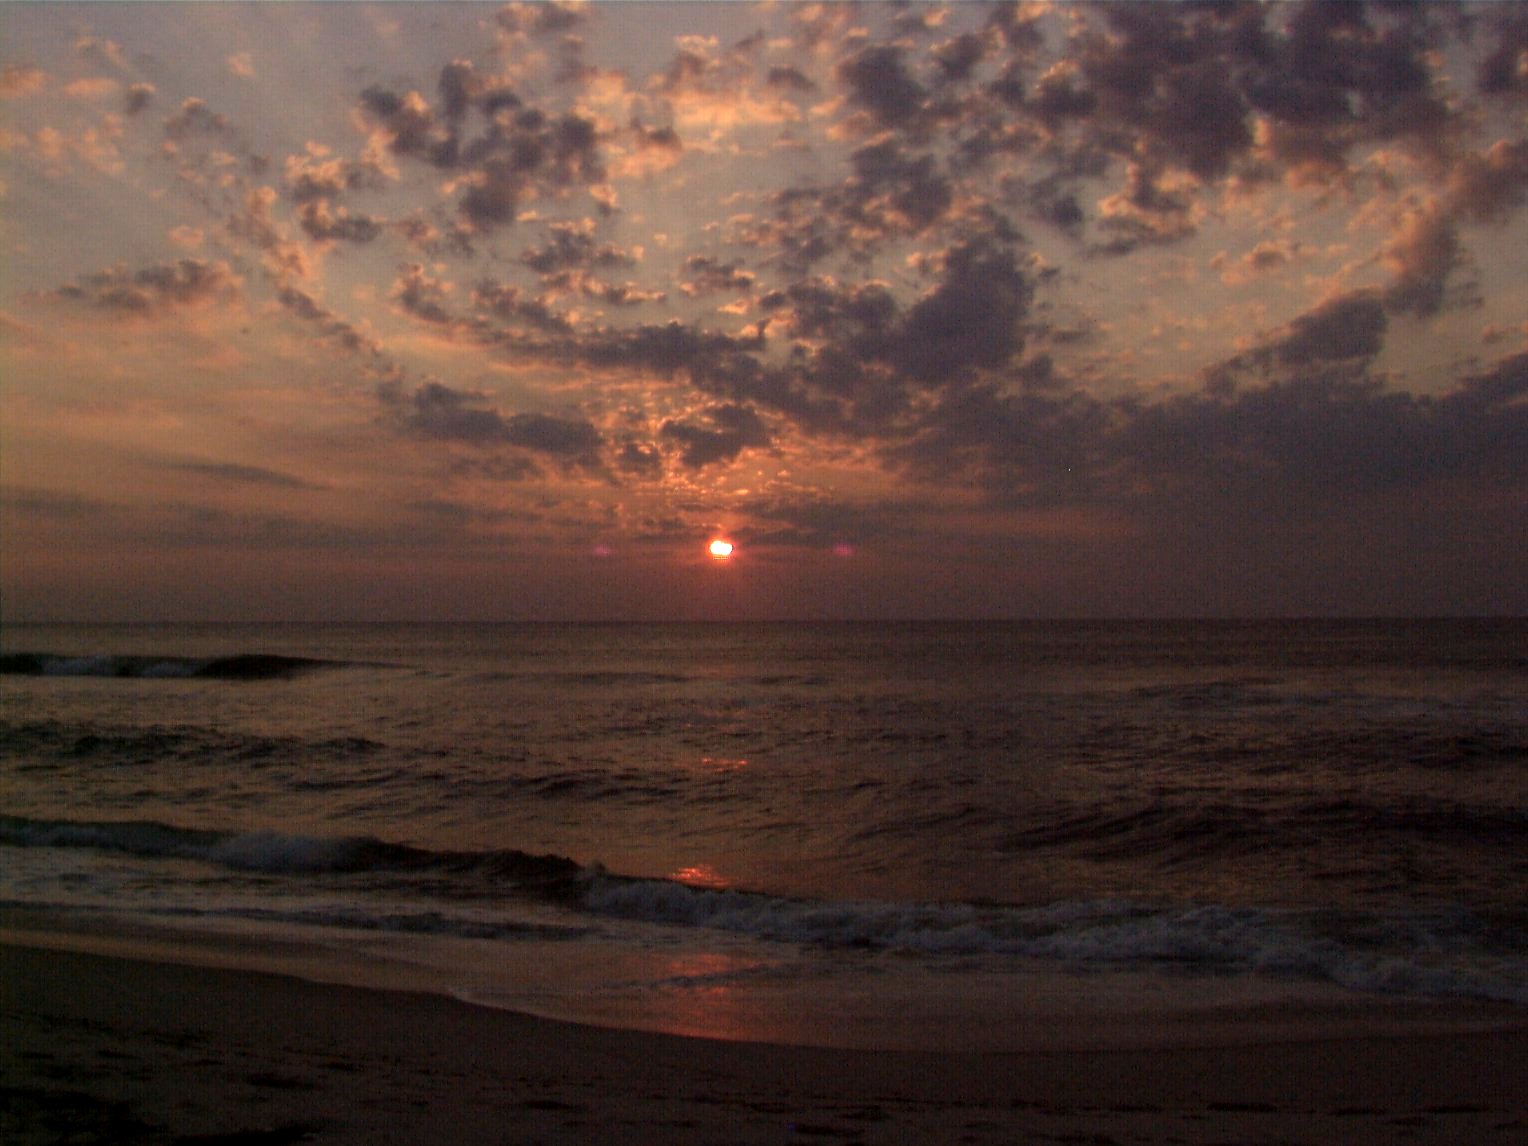
Eruption of volcano Agung in Bali

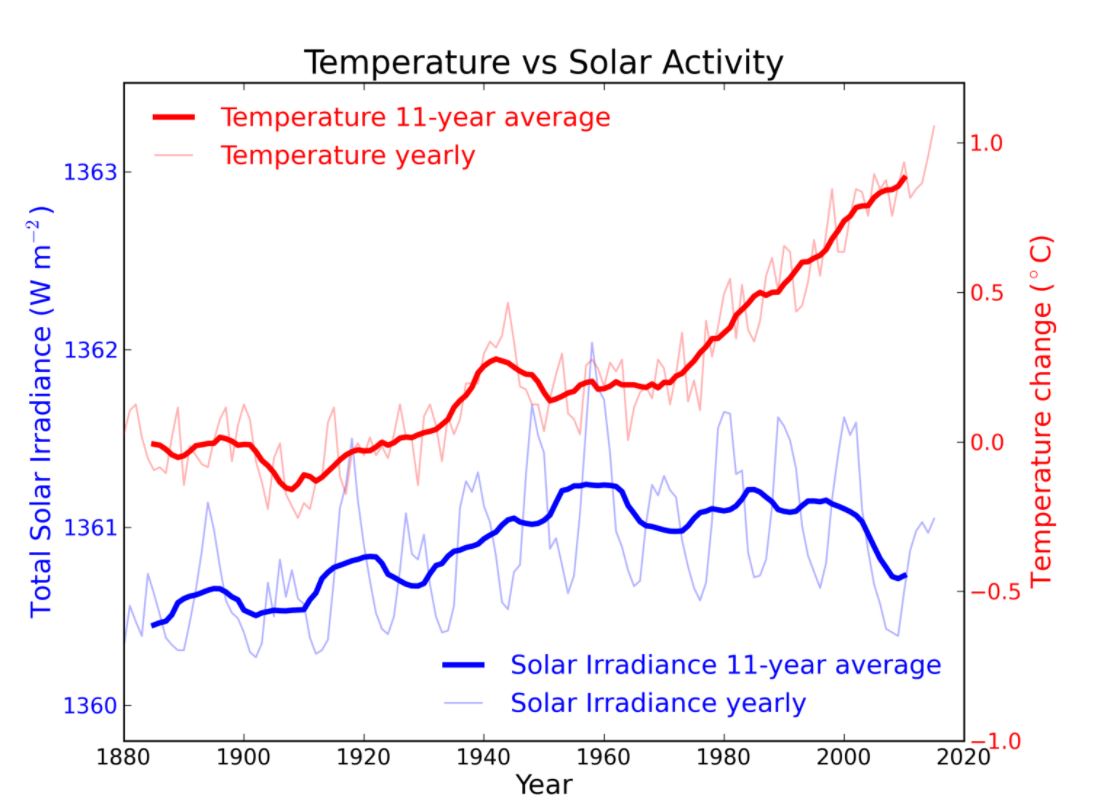
Over the past few decades, there have been several research papers in the scientific press that submit there is a correlation between cosmic-solar radiations and destructive geological events such as earthquakes and volcanic eruptions. On top of this, there are correlations with climate change that kick in where volcanoes throw up ash into the atmosphere which blocks the sun and that sets in motion the global cooling sending the earth back toward an Ice Age. Therefore, the entire process is extremely complex. Our computer can put out a forecast, but it is looking at everything and the dynamic complexity of all the interactions. This is why I do not put forth X happens because of Y. It is just more complex than such correlations.

Nonetheless, the strongest correlation between volcanoes and earthquakes remains that with the sun. In the last two and half centuries the following major volcanic eruptions occurred during strong solar minimum when the energy is at its greatest: Grimvotn (Iceland) 1783/84 (14 km3), Tambora (Indonesia) 1810 (150 km3), Krakatoa 1883 (5.0 km3), Santa Maria (Guatemala) 1902 (4.8 km3), Novarupta (Alaska) 1912 (3.4 km3). The only major eruption to occur during a solar maximum was Pinatabo (Philippines) 1991 (between 6 and 16 km3).

Additionally, research has concluded that there is an extremely high correlation between global volcanic activity among the largest of classes of eruptions and solar activity lows. Over 80% of these volcanic eruptions greater than VEI 5 and almost 88% of the extreme largest eruptions measuring VEI 6 or greater also taking place with solar minimums. There appears to be a strong correlation of volcanic eruptions coinciding with solar minimum. Pictured above, the Bali, Indonesian Agung volcano has been putting out smoke for several weeks. If this eruption unfolds as a VEI 6+ or VEI 7 as was Tambora back in 1815, this will accelerate the Global Cooling. That is going to be devastating for society and the global economy.

There is a clear relationship between solar magnetic activity and 11 of the most explosive eruptions from silicate-rich volcanoes in Japan over the past 309.6 years. It turns out that nine of these eruptions, in fact, took place during solar minimum, which is the inactive phase of solar activity/sunspots. We may find that volcanoes are also triggered by the by the rise in cosmic radiation.

What I can confirm is that volcanic eruptions play a tremendous part in creating Global Cooling, which is our real threat going into the next decade. Volcanic activity is rising again from Mount Tambora to Yellowstone. Evidence suggests that 1816, known as the year without a summer, was caused predominantly by a volcanic winter event caused by the massive 1815 eruption of Mount Tambora, which was the largest eruption in at least 1,300 years. However, the Year Without a Summer was exacerbated by the 1814 eruption of Mayon in the Philippines. Once again, it appears that there is a correlation of not just one volcanic eruption, but a series. Wheat prices had peaked in 1812 due to war, but they declined in 1815 falling to $19.90. They then rallied sharply into 1817 reaching about $30 posting a 50% advance.

1817-Wheat-Y

In Britain, the farmers tried to prevent the price of wheat from declining. They essentially paid off the politicians to introduce the Corn Laws which were tariffs and restrictions on imported food and grain (“corn”). The Corn Laws were enforced in Great Britain between 1815 and 1846. They were designed to keep grain prices high to favor domestic producers against the American farmers in the aftermath of the War of 1812. The Corn Laws imposed steep import duties and thereby made it too expensive to import grain from America, which set in motion famine conditions when food supplies were short. This attempt by the British government to protect their farmers from competition became a leading cause of the Great Irish Potatoe Famine.

Beginning from 1845 to 1851, the Irish potato famine killed over a million men, women, and children. This is what caused over a million more to flee the country sailing to America where food was plenty. Ireland in the mid-1800s was an agricultural nation, populated by eight million people who were among the poorest people in the Western World. The cause of famine was potato blight, which devastated the crops throughout Europe during the 1840s. However, the impact in Ireland was overwhelming since about one-third of the population was dependent on the potato. The Corn Laws contributed to the disaster by blocking the importation of food. They were abandoned because of the Irish situation in 1846.


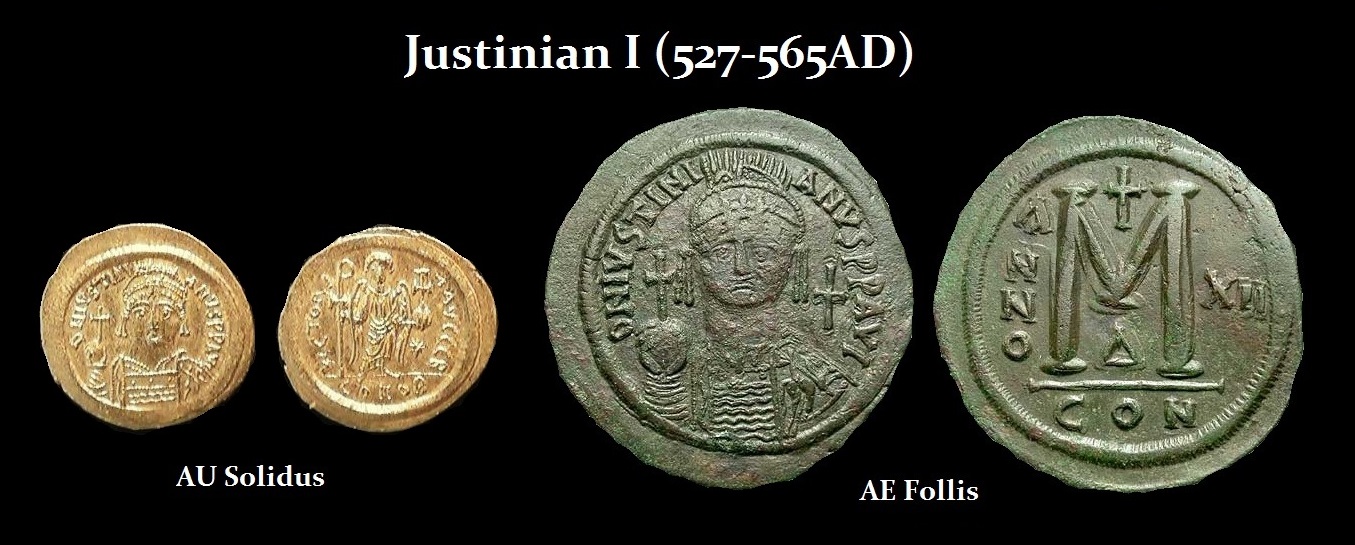
If we look back in time through the historical record, we discover another period where there appears to be a major convergence of volcanic activity which creates Global Cooling and the subsequent famine. There were the great volcanic eruptions that created the extreme weather events of 535–536AD during the reign of the Byzantine Emperor Justinian I (527-565AD). A mysterious cloud appeared over the Mediterranean basin according to the historian Procopius of Caesarea (Procopius Caesarensis; c. 500-560 AD) who wrote: “The sun gave forth its light without brightness, and it seemed exceedingly like the sun in eclipse, for the beams it shed were not clear.” This was a volcanic cloud that blocked the sun. But it was not a volcano in that region. The cloud’s appearance created a climate cooling for more than a decade. Crops failed, and there was widespread famine. This also sets in motion a pandemic known as the Plague of Justinian (541-542), which swept through the Eastern Roman Empire killing 5,000 people per day in Constantinople. The dating of this is extremely close to the famous civil unrest known as the Nika Revolt of 532 AD, which preceded the cloud account of Procopius and the plague.

Scientists had postulated that the Global Cooling set in motion by a giant volcanic winter 535-536AD may have been the result of the eruption of Ilopango in El Salvador, which filled Earth’s atmosphere with ash as did Mount Tambora in 1815. However, as the SMITHSONIAN reported back in 2010, “researchers say there were two eruptions—one in 535 or 536 in the northern hemisphere and another in 539 or 540 in the tropics—that kept temperatures in the north cool until 550.” This has emerged from studying the ice core samples collected in Antarctica and Greenland with data from tree rings. According to the correlation of this data, “nearly all extreme summer cooling events in the northern hemisphere in the past 2,500 years can be traced to volcanoes,” reported the Smithsonian.

There has been a lot recently written about the danger of a Supervolcano at Yellowstone. In fact, scientists discovered a tremendous blob of magma stored beneath Yellowstone, a blob that if released could fill the Grand Canyon 11 times over, the researchers reported on April 23, 2013, in the journal Science. The latest of the trio of Supervolcano eruptions created the park’s huge crater, measuring 30 by 45 miles across (48 by 72 kilometers). Correlating this with our database suggests that there is a more likely alignment with the flipping of the poles every 720,000 years, which we went into in great detail in the Mayan Report – Supernatural Side Roads.

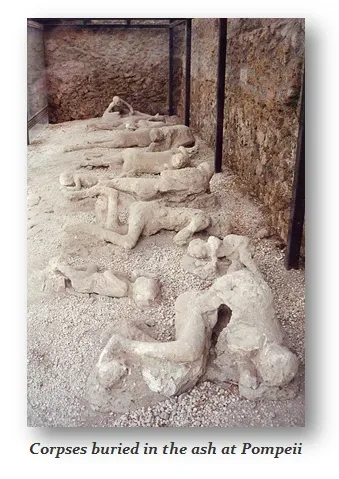
If we assume the 8.6-year cycle applies to this type of event given even the precession of the Equinox is a derivative 25,800 years (3×8.6), then we should see key markers along the way about every 224 years. If we look backward in time, we look to 1705BC, which was followed by the eruption of Thera (Santorini) which destroyed the Minoan Empire. Two cycles back from 535 brings us to 87AD, which was a period that also marked the eruption of Vesuvius in 79 AD is probably the best known volcanic eruption in world history since it buried Pompeii and Herculaneum.

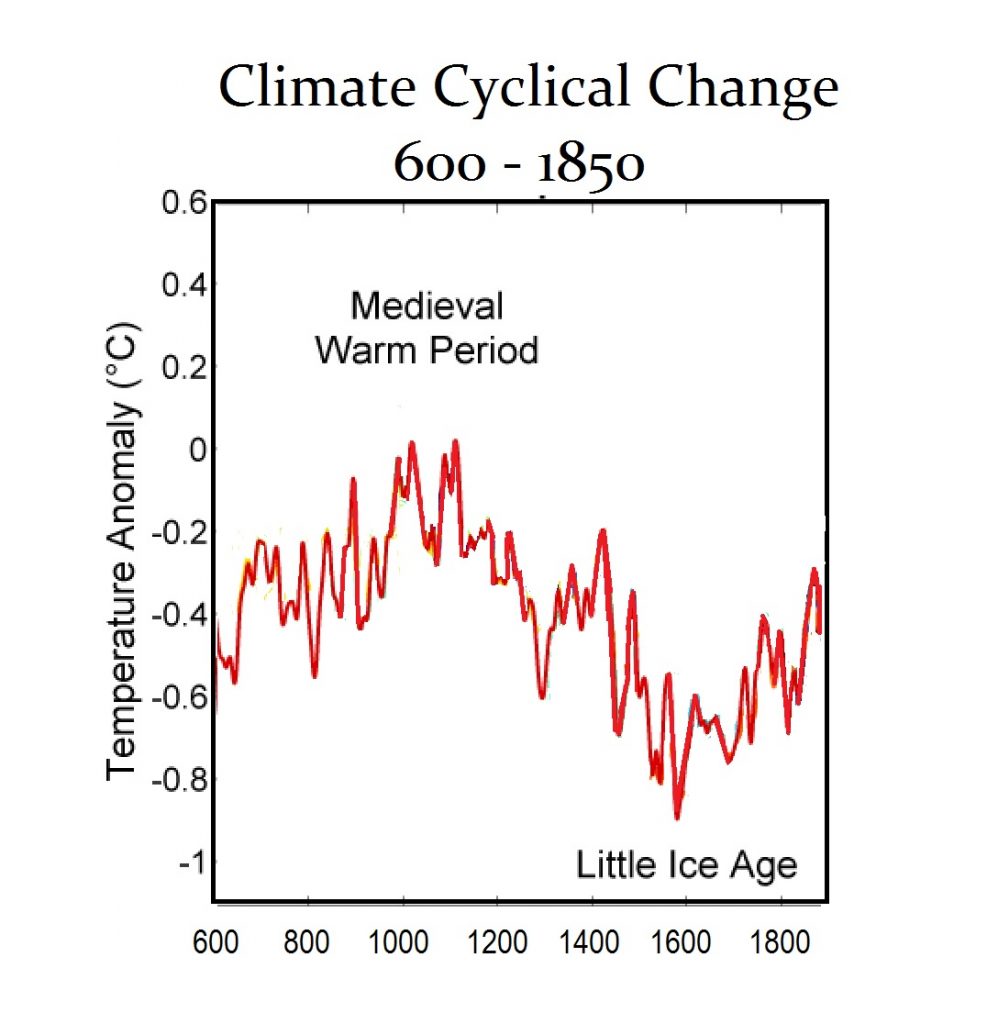
Looking at 224 intervals moving forward in time. there is evidence of unusually high levels of Carbon 14 discovered in tree rings throughout Japan from this period around 759AD, the next target after 535-536AD. The high Carbon 14 trace from this period has suggested that there was at least a gamma-ray burst from the sun. The next target would be about 983AD bringing us to the great Medieval Warm Period (MWP) when the climate turned back up into a warm climate for the North Atlantic region. This lasted into about 1200AD. The next target would be 1207 is perhaps the beginning of the Little Ice Age.

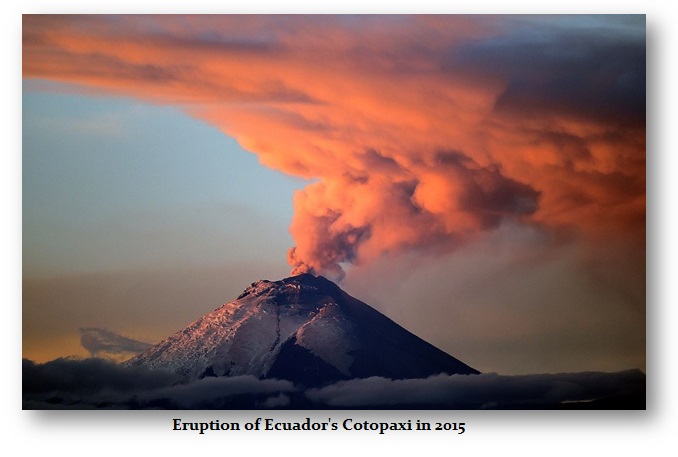
Thereafter, the next target period begins 1431, followed by 1655, 1879, which was followed by the Krakatoa eruption in 1883 (VEI 6). We also have a VEI 3 event at Cotopaxi, Ecuador in 1877. Cotopaxi has begun to erupt in 2015 while the island that once hosted Krakatoa was completely destroyed in the eruption in 1883, new eruptions began in December 1927 which rebuilt the Anak Krakatau (“Child of Krakatau”) cone in the center of the caldera. Anak Krakatau sporadically comes to life, building a new island in the shadow of its parent. The next major target would be 2103 for a massive correlation.

Tambora has also come alive since 2011. Radar Images provided by the International Earthquake and Volcano Prediction Center in Florida, show the hot areas. This volcano is also on the watch list for an eruption once again. There has been a sequence of earthquakes that began shaking the island with increasing frequency since April 2011. Columns of ash have already been venting as high as 4,600 feet.

If we see a series of volcanic eruptions in the VEI 6 category or greater within 2018, expect to see a very sharp turn down in temperature and Global Cooling will take on rapid change going into 2024.
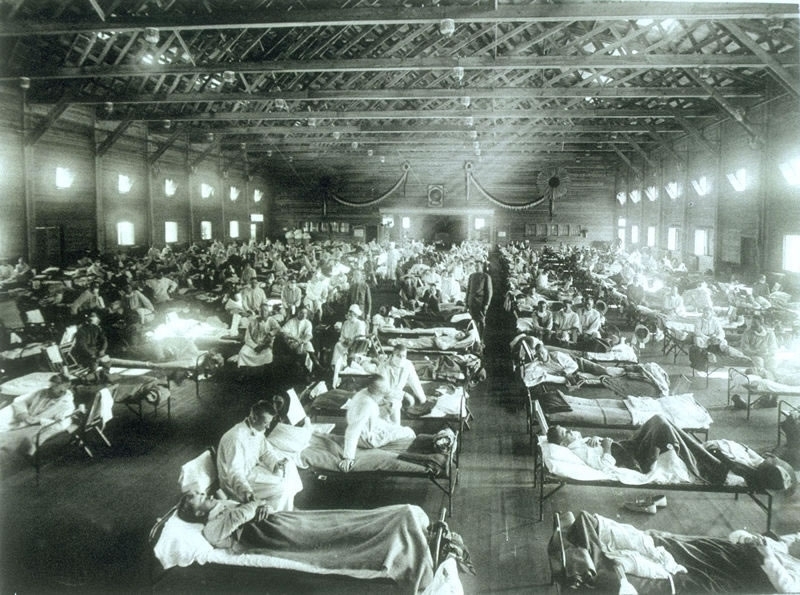
Climate Change – Earthquakes Caused by Complex Cycles (Part I)


Several people have asked why I could not confirm or deny that the cause of earthquakes is the slowing down of the Earth’s rotation. As previously reported, this new theory was published in Geophysical Research Letters earlier this year by Roger Bilham of the University of Colorado and Rebecca Bendick of the University of Montana. The theory notes that Earth actually slowed down in its rotation, which will increase the intensity of earthquakes every 32 years. Their research is based on looking at earthquakes since 1900 that were greater than 7.0, and noticing a cycle that is approximately every 32 years for an uptick in these large quakes. They argue that the only factor that strongly correlates is a slight slowing of the Earth’s rotation in a five-year period before the uptick.

I cannot confirm or deny that the cause of the 32-year cycle is the slowing of the Earth’s rotation because there are other correlations that need to be addressed. I did confirm that my own research agreed that there is a 31.4-year cycle of intensity in earthquakes. Additionally, I do not believe we can attribute the cause of earthquake intensity to the slowing of the Earth’s rotation because you cannot reduce the cause to a single factor.

As far back as 1967, a study was published with the Earth and Planetary Science Letters which found solar activity plays a significant role in triggering earthquakes. Solar activity, as indicated by sunspots, radio noise, and geomagnetic indices play a significant, but by no means exclusive, role in the triggering of earthquakes. (Source: Earth and Planetary Science Letters
Volume 3, 1967–1968, Pages 417-425)

Later, in 1998 a scientist from the Beijing Astronomical Observatory, Chinese Academy of Science, found a correlation between low solar activity and earthquakes. Then in 2007, Yin ZhiQiang, Ma LiHua, and Han YanBen conducted a study which produced results showing that the lengths and amplitudes of the periods have changed with time, and large variations have taken place during some periods. (Source: Chinese Science Bulletin).

Another recent research study carried by The Space and Science Research Center in Florida, US, showed a strong correlation between solar activity and the largest earthquakes and volcanic eruptions within the continental United States and other regions around the world. The study looked at the data of volcanic activity between (1650 – 2009) and seismic (earthquakes) activity between (1700 – 2009) and then the recorded data was compared with the sunspots record (solar activity).

The results of this study exposed a very strong correlation between solar activity and the largest seismic and volcanic events, within the continental US as well as globally. The correlation for volcanic activity was greater than 80% (discuss in a separate post) and for the largest earthquakes was came out with a 100% correlation with the top 7 most powerful quakes versus solar activity lows.

NASA also published a study showing that there can be lesser quakes in the 5.1 range that are shallow ground movements reflecting the strain accumulated on deeper faults, which remain locked and may be capable of producing future earthquakes in the 7.0+ magnitude range in Los Angeles. When we ran our weather models on a correlation with California earthquakes, it revealed a cycle of drought followed by flooding, which then undermines the structure and precedes earthquakes. NASA published a study showing that indeed the drought in California was causing the land to actually sink. They reported that groundwater levels have fallen 100 feet already.


In 2008 researchers, NASA announced that their scientists stand on the verge of a major breakthrough in their efforts to forecast earthquakes. They reported that they have found a close link between electrical disturbances on the edge of our atmosphere and impending quakes on the ground below. They observed this correlation days before the recent 8.0 devastating earthquake in China which struct on May 12th, 2008 (2008.361) known as the 2008 Sichuan earthquake. While there were a lot of quakes 309.6 years prior in 1698, there were not 8.0 quakes. There was an 8.0 quake known as the 1679 Sanhe-Pinggu earthquake, which was about 56Km from Beijing. If we look at the 224-year frequency, we again come close to the 1786 Kangding-Luding earthquake, which was a 7.7 quake. The 51.6-year frequency also produced two quakes in 1955 that were 7.1 1955 Kangding earthquake and a 6.8 quake known as the 1955 Yuzha earthquake.

Therefore, we may also have a close link between electrical disturbances on the edge of our atmosphere and impending quakes on the ground below has been found. This finding is in agreement with similar studies carried out by other space research institutes. Satellites have picked up disturbances 100 – 600 km above areas that have later been hit by earthquakes. Apparently, fluctuations in the density of electrons and other electrically-charged particles in the ionosphere have been observed, which may also provide a market for earthquakes.

In Taiwan, similar research has agreed with this theory. The researcher Jann-Yeng Liu also reported the link between earthquake and disturbances in the ionosphere. His work examined over 100 earthquakes with magnitude 5.0 and larger in and around Taiwan over several decades. His analysis showed that nearly every earthquake down to a depth of about 35 Km was preceded by distinct electrical disturbances in the ionosphere. So again, is this the cause or a mere correlation?

The theory put forth by Minoru Freund of the NASA Ames Research Center argued that when rocks are compressed-as when tectonic plates, they act like batteries, producing electric currents. This line of reasoning would imply that the electric disturbances are the result and not the cause since compressing rocks releases electrical charges that then travel upwards into the ionosphere. However, perhaps fluctuations in the cosmic-solar radiations are charging the ionosphere first, which then transfer to the planet disrupting the geomagnetic field generating the current.

The global warming people have totally ignored the sun and its interactions with our planet and the climate. It is a known fact that during solar minimum, which we are now headed in to, is when we get the peak energy in cosmic radiation. During these maximum energy periods, the cosmic radiation can penetrate the greatest depths within the planet. The correlation with the sun also exists whereby the greatest earthquakes swarm during the period of solar minimum.

Nevertheless, the relationship between the lowest-highest solar cycles and earthquakes produces the highest level of correlation. Therefore, the data simply establish an extremely strong correlation between major earthquakes of 8.0 magnitude or more (on Richter scale) and strong solar minimum (grand minimums).

We are in what is being called Solar Cycle 24. This is the 24th solar cycle since 1755 when extensive recording of solar sunspot activity began. It is the current solar cycle which began in December 2008 with a smoothed minimum of 2.2 (SIDC formula). There was only minimal activity until early 2010. It reached its maximum in April 2014 with smoothed sunspot number only 116.4, the lowest in over a century. The 8.0 2008 Sichuan earthquake took place right on schedule.

A simple correlation with the energy output of the sun reveals that all major earthquakes occurred during strong solar minimums. Consequently, there were 7 major earthquakes of 8.0 magnitude moving into the turning point in 2008-2010. Kiril Islands (Russia) twice- 8.1 (November 2006 & January 2007), Peru-8.0 (August 2007), Sumatra-8.5 (September 2007), Sichuan earthquake-8.0 (May 2008)Samoa-8.1 (September 2009), Maule (Chile)-8.8 (February 2010).

The Global Warming people have clearly harmed our investigation into serious correlations with the sun and our planet, which also impact our world economy. The cycles emerging from the various earth data correspo9nd to our Economic Confidence Model and the six waves at the 309.6-year level.

At the grand level of the 1857.6-year time interval we experience major changes and shifts in civilization. This correlates with the global cooling and the solar cycles. It is high time to understand that our planet is permanently linked to the solar energy. The longer the global warming crowd tries to blame humans for everything, the longer we will ignore something that may be far more devastating than global warming — the decline in solar activity which turns weather down and corresponds to a rise in earthquake and volcanic activity (see Part II on Volcanos).