
Trump knows what is wrong with the country and it is the political class in Washington DC! There are only out for themselves and don’t care a hoot about the common man. Since I have a degree in Economics I can tell you more then one way to quickly stop the unfair trade imbalances with most of the world. I’ve been meaning to write something on that subject and so i guess now is a good time to do so.
Monthly Archives: March 2016
Analysis of Global Temperature Trends, February, 2016 What’s really going on with the Climate?
The analysis and plots shown here are based on the following: first NASA-GISS temperature anomalies (converted to degrees Celsius so non-scientists will understand the plots) as shown in their table LOTI, second James E. Hansen’s Scenario B data, which is the very core of the IPCC Global Climate models (GCM’s) and which was based on a CO2 sensitivity value of 3.0O Celsius, lastly, a plot based on an alternative climate model designated ‘PCM’ based on a sensitively value of 0.65O Celsius.
Note: I am making a revision to my model based on some new information that will make my climate model more accurate; even with the NASA/NOAA data manipulation which is in full force now. I expect to have this work completed by the next post for January 2016 data. This change has been completed and this paper uses the new a revised model. This change was to link the developed patterns to multiples of Pi which did in fact make an improvement and reduced errors from NASA observations.
An explanation of the alternative model designated, PCM, is in order since many have interpreted this PCM model as a statistical least squares projection of some kind. Nothing could be further from the truth. A decade ago when I started this work the first thing I did was look at geological temperature changes since it is well known that the climate is not a constant; I learned that in my undergrad geology and climatology courses in 1964.
The following observations give a starting point to any serious study. First, there is a clear movement in global temperatures with a 1,000 some year cycle going back at least 3,000 to 4,000 years; probably because of the apsidal precession of about 21,000 years for a complete cycle. However about every 10,000 years the seasons are reversed making the winter colder and the summer warmer in the northern hemisphere. 10,000 years from now the seasons will be reversed. Secondly, there are also 60 to 70 year cycles in the Pacific and the Atlantic oceans that are well documented. Lastly we also know that there are greenhouse gases such as carbon dioxide. The National Academy of Sciences (NAS) estimated that carbon dioxide had a doubling rate of 3.0O Celsius plus or minus 1.5O Celsius in 1979.
The core problem with the current climate change theory is that the IPCC still uses the NAS 3.0O Celsius as the sensitivity value of carbon dioxide and a number in that range is required to make the IPCC GCM’s work. The problem with using this value is it leaves no room for other factors and hence the need of the infamous hockey stick plots of the IPCC from Mann, Bradley & Hughes in 1999. The PCM model is based on a much lower value for carbon dioxide consistent with current research that places the value between 0.65O and 1.5O Celsius per doubling of carbon dioxide. If the long and short movement in temperatures and a lower value for carbon dioxide are properly analyzed and combined a plot that matched historical and current (non manipulated) NASA temperature estimates very well can be constructed. This is not curve fitting.
The PCM model is such a construct and it is not based on statistical analyses of raw data. It is based on creating curves that match observations (which is real science) and those observations appear to be related to the movement of water in the world’s oceans. The movements of ocean currents are well documented in the literature. All that was done here was properly combine the separate variables into one curve which had not been previously done, to my knowledge. Since this combined curve is an excellent predictor of global temperatures unlike the IPCC GCM’s, it appears to reflect reality a bit better than the convoluted IPCC GCM’s, which after the past 19 years of no statistical warming have been shown to be in error.
Now, to smooth out highly erratic monthly variations a 12 month running average is used in all the plots. This information will be shown in four tables and updated each month as the new data comes in about the middle of the month. Since no model or simulation that cannot reasonably predict that which it was design to do is worth anything the information presented here definitively proves that NASA, NOAA and the IPCC just don’t have a clue.
Note, starting in late 20014 and continuing to the present NASA has made major changes to the way they calculate the values used in their table LOTI. These changes have significantly increased the apparent global temperatures (political reasons) and these changes are not supported by satellite data; so they are probably not real. For example in the report issued in April 2010 the following temperatures were reported March 2002 102, January 2007 108. The January 2016 report shows March 2002 90, January 2007 95 and January 2016 as 111 but was it and will it say there? This paper uses the questionable NASA data since it is all that is available at this time. Prior to this “change” the PCM plot showed almost no error for NASA data as can be seen in the plots posted here last year.
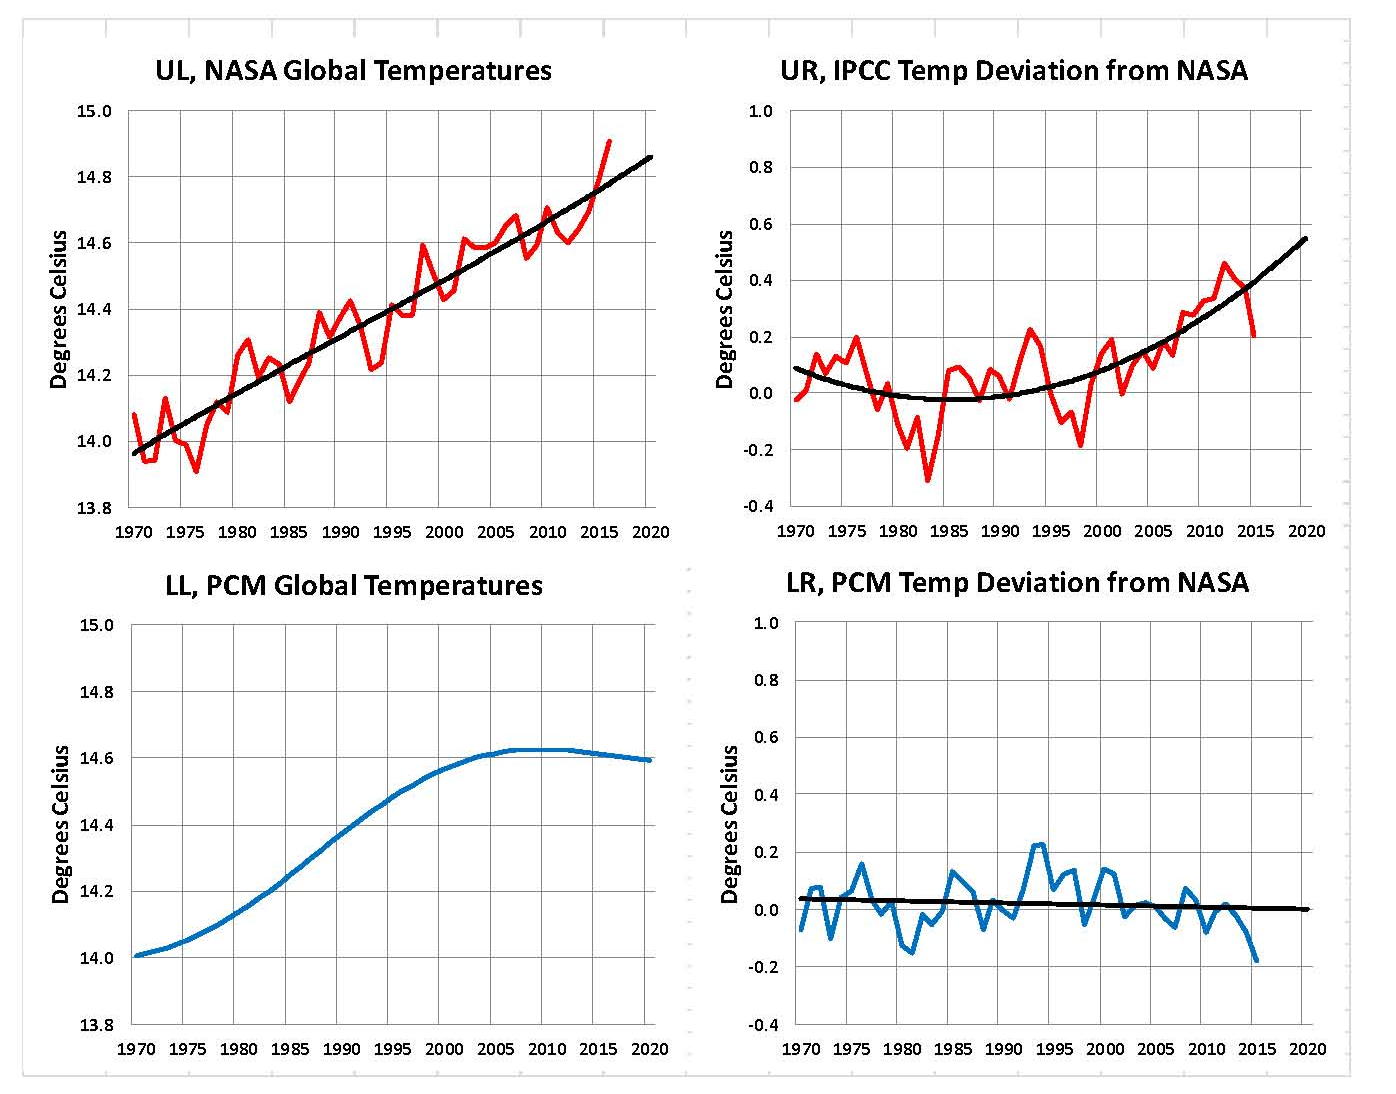
The first plot, UL is a plot of the NASA temperature anomaly converted to degrees Celsius and shown in red with a black trend line added. There has been a very clear reversal in the upward movement of global temperatures since about 2001 and neither the UN IPCC nor anyone else has an explanation for this 13 years later. Since CO2 has continued to increase at what could be argued an increasing rate, this raises serious doubts about the logic programmed into all the IPCC global climate models.
The next plot UR, also in red, shows the IPCC estimates of what the Global temperature should be, based on Hansen’s Scenario B, with the NASA actual temperatures’ subtracted from them. Therefore this plot represents a deviation from what the Climate “believers” KNOW what the temperature should be; with a positive value indicating the IPCC values are higher than actual and a negative value indicating the IPCC values are lower than actual, as measured by NASA. A black trend line is added and we can clearly see that the deviation from expected is increasing at an increasing rate. This makes sense since the IPCC models project increased temperatures based primarily on the increasing level of CO2 in the earth’s atmosphere. Unfortunately, for them, the actual temperatures from NASA are trending down (even as they try to hide the down ward movement with data manipulation) since other factors are in play, therefore each year the gap between them widens. Since we have 13 years of observations’ showing this pattern it becomes hard to justify a continuing belief in the IPCC climate models, there is obviously something very wrong here.
The next plot LL shown in blue is based on the equations in the PCM climate model described in previous papers and posts here and since it is generated by “equations” a trend line is not needed. As can be seen the PCM, LL, there is a 69.1 year cycle that moves the trend line up and then down a total of 0.29O Celsius and we are now in the downward portion of that trend (-.01491O C per year) which will continue until around 2035. This short cycle is clearly observed in the raw NASA data in the LOTI table going back to 1868. Then there is a long trend, 1036.7 years with an up and down of 1.65O Celsius (.00396O C per year) also observed in the NASA data. Lastly, there is CO2 adding about .007O Celsius per year so they basically wash out at -.0039 O C per year, which matches the current holding pattern we are experiencing. After about 2035 the short cycle will have bottomed and turn up and all three will be on the upswing again. These are all round numbers shown here as representative values.
The last plot LR in blue uses the same logic as used in the UR plot, here we use the PCM estimates of what the Global temperature should be with the NASA actual temperatures’ subtracted from them. A positive value indicates the PCM values are higher than actual and a negative value indicates the PCM values are lower than expected. A black trend line was added and it clearly shows that the PCM model is tracking the NASA actual values very closely. In, fact since 1970 the PCM model has rarely been off by more than +/- 0.1 degrees Celsius until the last few months where the manipulation showed up and has an average trend of almost zero error, while the IPCC models are erratic and are were approaching an error rate of over +0.4O C above expected until the last few months.
Note: Since I first started posting this monthly analysis a year and a half ago NOAA and NASA were directed make the global temperatures fit the political narrative that the planet was over heating and something drastic need to be done right now. The problem was as shown in this analysis the “real” world temperatures were not at the level that the IPCC GCM’s said they should be. Major adjustments to the data have been made that give the illusion that temperatures are going up even though they are not. However, as this analysis shows even with the manipulation that has destroyed all credibility from NOAA and NASA they cannot get the global temperatures even close to what their false theory claims they should be.
The next Chart shows the PCM model and all the various government plots related to climate change from 1875 through 2075. Clearly within the next dozen years we will know one way or the other which kind of climate model works. One based on observations and the other based on questionable science. There is no disrespect meant against the real climate scientists that have been marginalized this disrespect is meant for the political scientists who are the worst kind as they work for money not for the truth. Unfortunately, over the past year NASA has been directed by the current administration to make the global temperature match what the IPCC climate models predict it should be; therefore we see the very odd plot in the oval in the following Chart.
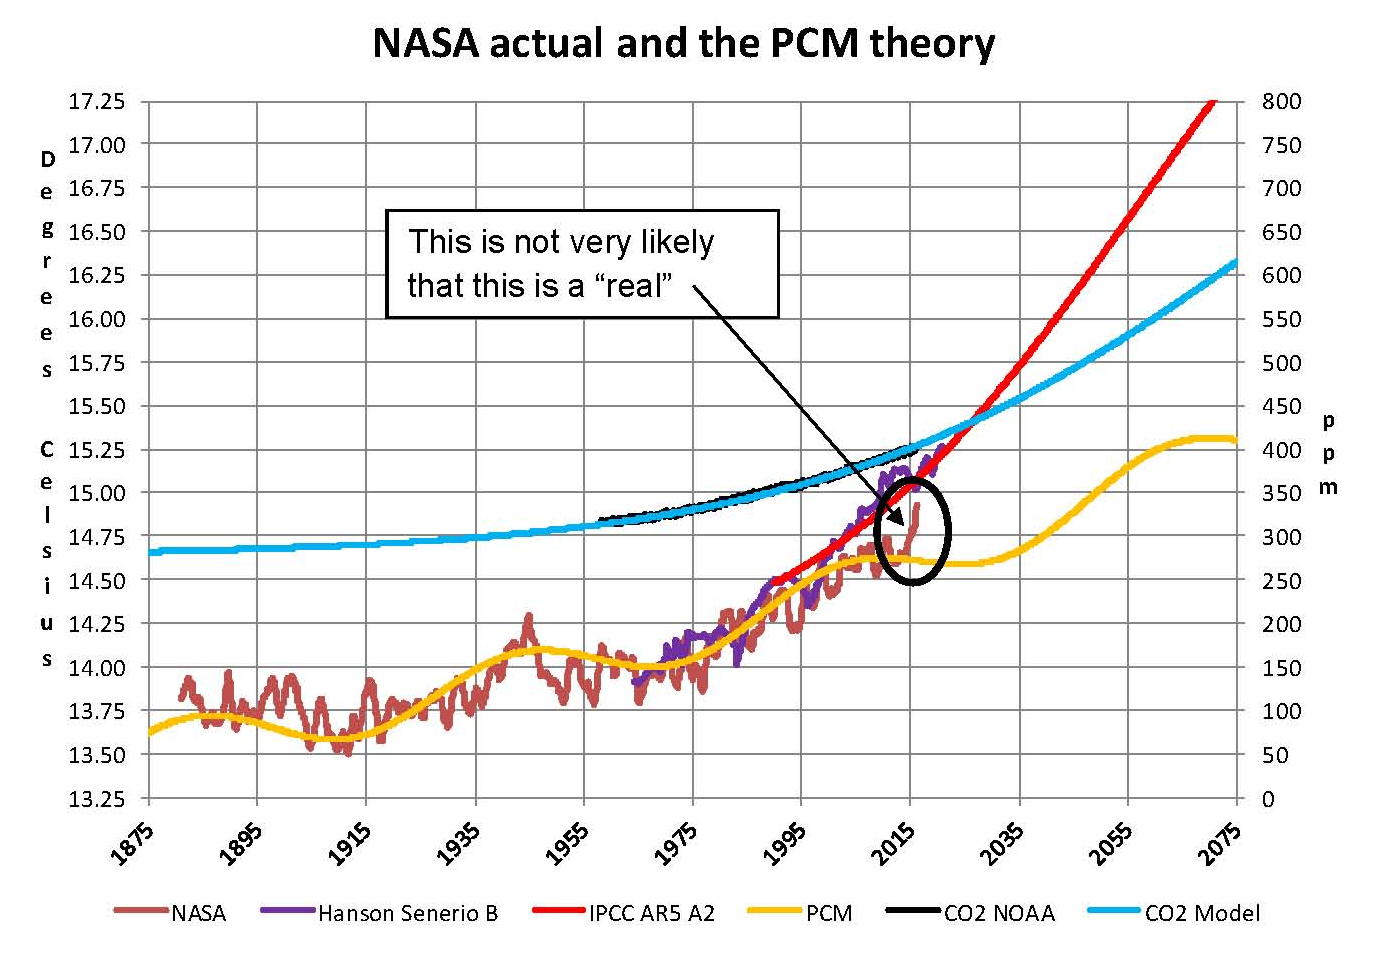
In summary, the IPCC models were designed before a true picture of the world’s climate was understood. During the 1980’s and 1990’s CO2 levels were going up and the world temperature was also going up so there appeared to be correlation and causation. The mistake that was made was looking at only a ~20 year period when the real variations in climate move in much longer cycles. Those other cycles can be observed in the NASA data but they were ignored for some reason. By ignoring those trends and focusing only on CO2 the models will be unable to correctly plot global temperatures until they are fixed.
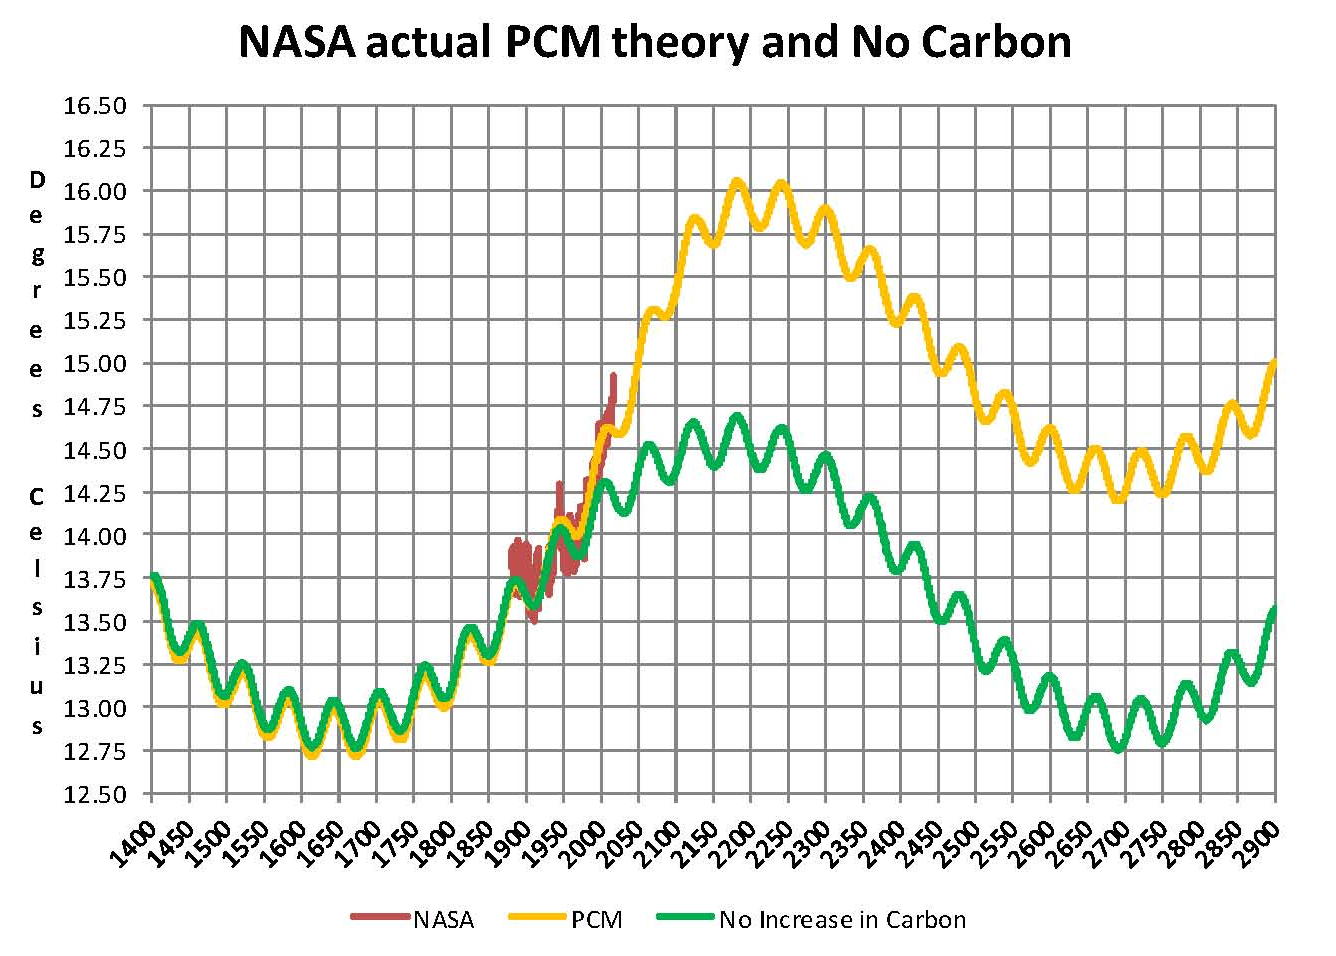
Lastly, the next chart shows what a plot of the PCM model, in yellow, would look like from the year 1400 to the year 2900. The plot matches reasonably well with history and fits the current NASA-GISS table LOTI data, in red, very closely, despite homogenization. I understand that this model is not based on physics but it is also not curve fitting. It’s based on observed reoccurring patterns in the climate. These patterns can be modeled and when they are, you get a plot that works better than any of the IPCC’s GCM’s. If the conditions that create these patterns do not change and CO2 continues to increase to 800 ppm or even 1000 ppm than this model will work into the foreseeable future. 150 years from now global temperatures will peak at around 15.75 to 16.00 degrees C and then will be on the downside of the long cycle for the next 500 years. The overall effect of CO2 reaching levels of 1000 ppm or even higher will be about 1.5 degrees C which is about the same as that of the long cycle. The Green plot shows the pattern with no change in CO2 from the pre-industrial era of ~280 ppm.
Carbon Dioxide is not capable of doing what Hansen and Gore claim!
The purpose of this post is to make people aware of the errors inherent in the IPCC models so that they can be corrected.
The Obama administration’s “need” for a binding UN climate treaty with mandated CO2 reductions in Europe and America was achieved as predicted at the COP12 conference in Paris in December 2015. To support this endeavor NASA was forced to show ever increasing global temperatures that will make less and less sense based on observations and satellite data which will all be dismissed or ignored. Within a few years the manipulation will be obvious even to those without knowledge in the subject.
Sir Karl Raimund Popper (28 July 1902 – 17 September 1994) was an Austrian and British philosopher and a professor at the London School of Economics. He is considered one of the most influential philosophers for science of the 20th century, and he also wrote extensively on social and political philosophy. The following quotes of his apply to this subject.
If we are uncritical we shall always find what we want: we shall look for, and find, confirmations, and we shall look away from, and not see, whatever might be dangerous to our pet theories.
Whenever a theory appears to you as the only possible one, take this as a sign that you have neither understood the theory nor the problem which it was intended to solve.
… (S)cience is one of the very few human activities — perhaps the only one — in which errors are systematically criticized and fairly often, in time, corrected.
RNC Chair Reince Priebus Discusses Open Convention (Video)….
It is very very clear that the RNC/GOPe and the donors that support them DO NOT WANT trump so they will do as attorneys always do and play word games while they work very hard behind the curtain to get the result that they want. Between now and the Convention the RNC/GOPe through their PAC’s will do EVERY THING they can to make Trump look bad and try to keep him from the magic number. THIS WILL BE THE NASTIEST POLITICAL CAMPAIGN IN MODERN HISTORY.
Donald Trump’s Brilliant Barking Hillary -vs- Putin Ad…
The Russian Reset Button – just one of the many Hillary botched deals although the Benghazi debacle was the worst even though no one was actually hurt there according to her.
This is what 25 years of Democrat and Republican rule has given us

This image is a typical Detroit city street today and this is what Trump wants to fix and he is showing the Democrat and Republican party candidates who are running for President what they have done. Trump is shown here as Captain America since he represents the American Citizens while neither the Republican nor Democrats do any longer. If what is shown here in the image is what you want than vote for the candidates that are being pushed by either party for a lot more of what is shown here is what you will get.
RNC Stop Trump Official: “We Choose Our Nominee, Not The Voters” (video)…
Well it finally comes out they they do not care about the Republican voters and don’t even know why they hold primaries as it in only what the party wants that matters. Well RNC we did kind of know that after the last few elections where we gave you the house and the Senate and you would still not do a few simple thinks that we asked for. If your donors are who you must listen to then do so at your own peril for this election is your last chance to keep a viable Republican party alive. A Democrat light party is not viable and that is what you are becoming — so why for for a want a be when you can have the real thing in the Democrat party?
Super Tuesday II – The Coming Split of the Republican Party
Armstrong Economics Blog
Re-Posted Mar 16, 2016 by Martin Armstrong

The split of the Republican Party is looking much closer after today. Trump won Florida, Rubio’s home State, and that led Rubio to drop out. However, Trump was denied a victory in Ohio which was won by its own sitting governor, John Kasich. This will make it now very difficult for Trump to win the necessary delegates for a first ballot in the Republican Convention. This Ohio victory doesn’t make Kasich a likely nominee in the least, just a spoiler to help the “establishment” pick who they want to be their nominee and that is certainly not Trump. Kasich has now won just one state so it appears that Ohio has sealed the fate of the Republican Party. Without Ohio’s 66 delegates, Trump now faces an extremely difficult path to reach the majority of delegates he needs to avoid a “contested” GOP convention. So the establishment looks like it will win and no candidate will enter the convention with a majority of delegates locked up. So after the first ballot, they are free to vote for whoever the “establishment” want. It looks like the computer may be right after all. This is beginning to appear to be a very insane situation. The last time no candidate had the required amount for a nomination was 1976. Under the rules of the GOP, all these primaries were pointless. Delegates can choose one of the candidates who ran, or someone else entirely – Romney?
With the people voting for Trump, the Republican Party may have to face a huge strong anger backlash from his supporters. We are more likely to see a third-party candidacy from Trump himself. The “establishment” will not have an outsider in that office so Trump might as well run Third Party to illustrate the corruption. The Republican prefer Hillary to Trump any day of the week. The “establishment” fear ending elections that cannot be bought by their supporters, their families might get fired from cushy jobs, and Trump would not just sign whatever bill is put before him. Obama has been a joke. Obama misses more than 50% of the morning briefings. Ever since Bush was in office and Dick Cheney actually ran the country, those in power prefer a stooge as President. That way they get to do whatever they want while the “boss” does not actually do his job.When Russia invaded Georgia, someone ran in to tell the President. He said: Really? Well I didn’t win that State anyhow. Texas would be a different matter.
Someone like Trump presents a HUGE THREAT to the establishment. They would have to assassinate him because he got in their way. The “establishment” might try blaming Cuba again or someone else they really do not like. The talk behind the curtain is clear – hand it to Hillary and everything remains intact.
So a Republican spit is looking more and more likely. They have drawn the line in the sand. They will BY NO MEANS accept Trump. He might as well begin forming a Third Party. What is going to be exposed is that we do NOT live in a Democracy. As long as the people vote for their groomed candidates, the pretense is fine. Now when it threatens their existence, well its time to bring the grapes of wrath down upon everyone. Their mistake; they assume this will all blow over. Where they are wrong is that to defeat Trump, they must expose the truth – it’s their game and they make the rules. Your vote really means nothing to them. I suspect this is step one in what the computer warns will be an entirely new political system ahead.
Hillary Bullshits About Obamacare
Armstrong Economics Blog
Re Posted Mar 15, 2016 by Martin Armstrong
My personal insurance costs under Blue Cross doubled. Absolutely everyone I have spoken to has had the same result. Here a woman tells Clinton the Democrats are out of touch. Her family of four saw their healthcare cost had “skyrocketed” from $480 a month to $1,080 a month. This is causing a dramatic economic decline and is part of the downturn in the economy as the average working family has lost a tremendous amount of disposable income to healthcare which is sucking everyone dry. There is no possible way for Hillary to lower deductibles and cost at the same time. She is just bullshitting this person on CNN. Then Social Security goes broken in 2017 and they will raise the age and taxes. Any career politician is just hopeless regardless of which party they belong to. Neither side is capable of running any responsible business no less a country.
The Common Sense Trump Coalition – A Post Election Night Debrief With Florida as a Predictive Microcosm…
I would dearly love for this analysis to be 100% true but offsetting this is the huge amount of money that the GOPe has at its disposal to counter the will of the “real” people. The battle is now formed as the unlimited money against the belief in God and freedom. I know what side I am on what side are you on?
Therefore, in support of our obligations as free citizens of the United States of America to maintain our founding document the Constitution of the United States and all that it stands for, and with a firm reliance on the protection of divine Providence, we mutually pledge to each other our Lives, our Fortunes and our sacred Honor.
FINAL Super Tuesday2 Election Results Thread – Florida, Ohio, North Carolina, Illinois, Missouri
Being from Ohio I’m very disappointed in what Ohio and the Ohio Republican Party did to Trump to steel the Trump victory there. Getting the required votes to reach 1237 is going to be a lot harder now.
