While some of the news coverage was interjecting global warming as the cause of the storm, in fact it tends to work in the opposite direction. This has been a sharply declining period of temperature. I wrote about how this was the year without an Arctic Summer. This has been the coldest summer in Europe and even in the States on the East Coast during August to early September. I went to visit family in August and had to buy a coat in New Jersey. In Australia there has been the coldest night on record in New South Wales. The warm water colliding with cooler air tends to make for bigger storms.
One of the major news stations was attributing Miami sinking into the water to Global Warming claiming this was PROOF of rising sea levels. Pictured here is Wildwood New Jersey which was famous in the 60s with Bobby Rydell’s song. I use to go there as a kid. The piers were once upon a time actually in the water. You could go on a pier and fish.
The beach has risen so much it is well beyond the piers today. Is this PROOF that sea levels are falling? No! So the fact that Miami is sinking is by NO MEANSPROOF of Global Warming. The sea coast rises and falls with the storms, which change the under water topography offshore. Ever since Sandy hitting New Jersey, there are parts of Long Beach Island that now flood in a rain storm.
It is NOT Global Warming that is to blame for Miami sinking. It is the simple fact that the beaches always change. I have lived on the beach for probably 30 years. It is like watching a movie. It is constantly changing. The sand rises and falls. It does not remain unchanged. Welcome to mother nature.
The devastation in the Florida Keys and in the Caribbean Islands has one thing in common. Those houses constructed in wood frames cannot withstand even a Category 3 storm no less a Category 5. To understand the disaster, we have to face the fact that construction standards are critical. Wood houses should be prohibited and all modern construction must be hurricane resistant.
The hype over Irma spun by the various news stations was just so over the top and poses a serious threat to society. Personally, I had every family member and cousins I rarely spoke to, begging me to get out of Florida. Everyone said I would die. The models I ran to decide where to locate in Florida worked well. My home never even lost power and one small old tree fell over in the front yard. That was the extent of the damage and living on the beach did not reflect the danger the TV portrayed since my place was all constructed in concrete – not wood.
Comparing those structures in the Caribbean and Key West to the block and concrete buildings in Florida is comparing apples and oranges. Some have shown trailer parks in Key Largo destroyed and then in the same breath say the “rich” lived in houses with little damage because modern houses more recently constructed must be in block and concrete. Those in trailer parks are always more vulnerable and some of those mobile homes are extremely expensive. This is true in the mid-West in tornado ally as well.
Nevertheless, the real issue is that their forecasting models were all wrong on the direction. It appears that the European model (which includes more data & takes longer to run) was doing a better job, but it too missed the turn inland. Then there were the dire forecasts that we would see a giant “surge” of a wall of water 15 to 20 feet high they painted would be like a tsunami. That too never materialized. A tsunami is a wave of energy pushing through the water. The storm surge they pictured was water simply rushing back in pushed away by wind. This type of “surge” may cause some flooding, but it lacks the energy of a tsunami. Depending upon the topography both under the water and the land, then the storm “surge” of just 3 feet (1 meter) can drown people. But that is totally different from a tsunami. An earthquake can create a tsunami as was the case with the Tokyo 1923 earthquake shown in the newspaper account above.
This modern version of what people are calling fake news is effectively trying to manipulate the public into thinking something is so horrific they cannot afford to change the station. The danger is that nobody will listen to them the next time. Irma has shown that fake news is by no means limited to just politics. They look for the hardest hit areas and then create a picture this is the entire state.
The models I ran that were cyclical based and did a far better job. They also showed it would hit Cuba when they forecast it would miss the island. Power was not lost at my home. Our data provider is in Boca Raton and they are still down. The East Coast got the worst of it yet the storm still came up on the West Coast and then turned inland.
Our models picked our area by Tampa as the best spot. This was the 32nd Category 5 storm so 2017 should have been the big one. All of that was accomplished by cyclical models and Socrates. So again I think it did a far better job than their modeling atmosphere. Perhaps it is like markets. You cannot really forecast any market if that is all you look at. It is the combination of all markets at all times.
All our staff have evacuated. We were all under mandatory evacuation orders. So thank you for all the concern. Our decision to leave was primarily due to the fact that the storm shifted to the West and the likelihood of power outages potentially lasting days or weeks was the real deciding factor. Generators also depend upon natural gas. If the storm is intense above Sarasota, then there is a potential that even the gas could be turned off. While Irma is not forecast to strike Cuba, it should cyclically speaking. We will see what happens. If this is correct, then Irma may impact the West even more than the Eastern part of Florida.
This is the 32nd (Pi) Catagory 5 Hurricane since 1924. That is not a good number cyclically speaking. Only five times has more than one Category 5 hurricane formed during the same season —1932, 1933, 1961, 2005, and 2007. Only in 2005 have more than two Category 5 hurricanes formed, and only in 2007 has more than one made landfall at Category 5 strength.
Moreover, there is a 96 year cycle in Category 5 hurricanes. There was a serious hit in 1921, but the 1825 Hurricane Santa Ana of took place on July 26, hitting near Guadeloupe. It continued west-northwestward to hit Puerto Rico, causing 1,300 deaths, before tracking to the west of Bermuda by August 2. The Santa Ana Hurricane quite honestly was one of the most intense storms to strike Puerto Rico in the previous few hundred years. WHile there was no atmospheric pressure readings taken in Puerto Rico, however, a minimum pressure of 918 mbar (27.1 inHg) in Guadeloupe indicated that the storm was likely a Category 5 hurricane (there are no officially observed Category 5 hurricanes before 1924).
The Tampa Bay hurricane of 1921 (also known as the 1921 Tarpon Springs hurricane) is the most recent major hurricane to strike the Tampa Bay Area. The storm developed from a trough in the southwestern Caribbean Sea on October 20. Initially a tropical storm, the system moved northwestward and intensified into a hurricane on October 22 and a major hurricane by October 23. Later that day, the cyclone peaked as a Category 4 before it hit Tampa. Typically, Category 5 storms develop most in the Atlantic.
There is evidence of even a monster storm which may have been greater than Category 5. Using paleotempestological research, they were able to identify past major hurricanes by comparing sedimentary evidence of recent and past hurricane strikes. There appears to have been a massive hurricane which was significantly more powerful than Category 5 that has been identified in Belizean sediment, having struck the region sometime before 1500.
We also know that in 1715 and again in 1733, Spain’s treasure fleets were devastated by hurricanes off the coast of Florida. Although the Spanish managed to recover some treasure, much more remained on the ocean floor. The sunken ships lay forgotten for more than 200 years until modern treasure hunters discovered several of them. The coins recovered have been sold off at auctions.
Ever since the 80’s we have heard how bad the use of fossil, carbon based, fuels is and how we must absolutely stop using them. The reason that we are told is that burning fossil fuels creates Carbon Dioxide (CO2) which is causing the planet to over heat. Although there is a small element of truth to that thought it has been greatly exaggerated and if one looks at the subject with an open mind one sees that the amount of climate change possible by increasing levels of Carbon Dioxide is only about 1/3 of the total observed historical changes in climate. In other words nature is the primary reason for climate change. Further, its unlikely that more than another .5 degrees Celsius will be observed from increases in atmospheric Carbon Dioxide. Previous posts here show why this is true if one cares to read them.
This post is to show the other side of the Carbon Dioxide issue which is that Carbon Dioxide is not the only thing created by burning fossil fuels. Actually three things are produced, energy in the form of high temperatures which can do work, Carbon Dioxide and water. There are other residues depending on the fuel used but they can be ignored as although important to consider, they are not items that can’t be controlled with proper engineering. Forgetting the heat energy (warming) produced, for now, the other two items Carbon Dioxide and Water are where this discussion leads us.
Carbon Dioxide the evil pollutant which must be stopped at all costs is the primary food for plant life and without it we could not exist. In fact increased levels of Carbon Dioxide well beyond where we are now would be very beneficial to all life on the planet as plants grow much better and faster at levels of Carbon Dioxide 3 to 4 times where we are now. So the fact is that increased levels of Carbon Dioxide are good not bad.
But no one is even discussing the third element of burning fossil fuels which is the production of large amounts of water. From the beginnings of the industrial revolution to today Carbon Dioxide has gone from 280 ppm to about 410 ppm today or from .028% to .041% of the earths atmosphere. That means that we have produced in the last 400 years …
736 Billion Tons of Carbon Dioxide (plant food) and
263 Billion Tons of Water
263 Billion tons of water is 63.1 Trillion gallons of water, or 57.3 cubic miles of water which is about half of the water now in Lake Erie the world 18th largest lake. Since no one would disagree that water isn’t bad, creating this much water is a good thing ….
One last thought is that 57.3 cubic miles of water has raised the earths oceans by about .026 inches or .7 mm in height representing about 1% of the observed increased level of sea levels. That may not be much but that increase is not from global warming its from the production of large amounts of water.
The point to this discussion is that we must understand all the processes that are happening since nature is very complex and no one thing controls anything on the planet.
Sir Karl Raimund Popper (28 July 1902 – 17 September 1994) was an Austrian and British philosopher and a professor at the London School of Economics. He is considered one of the most influential philosophers for science of the 20th century, and he also wrote extensively on social and political philosophy. The following quotes of his apply to this subject.
If we are uncritical we shall always find what we want: we shall look for, and find, confirmations, and we shall look away from, and not see, whatever might be dangerous to our pet theories.
Whenever a theory appears to you as the only possible one, take this as a sign that you have neither understood the theory nor the problem which it was intended to solve.
… (S)cience is one of the very few human activities — perhaps the only one — in which errors are systematically criticized and fairly often, in time, corrected.
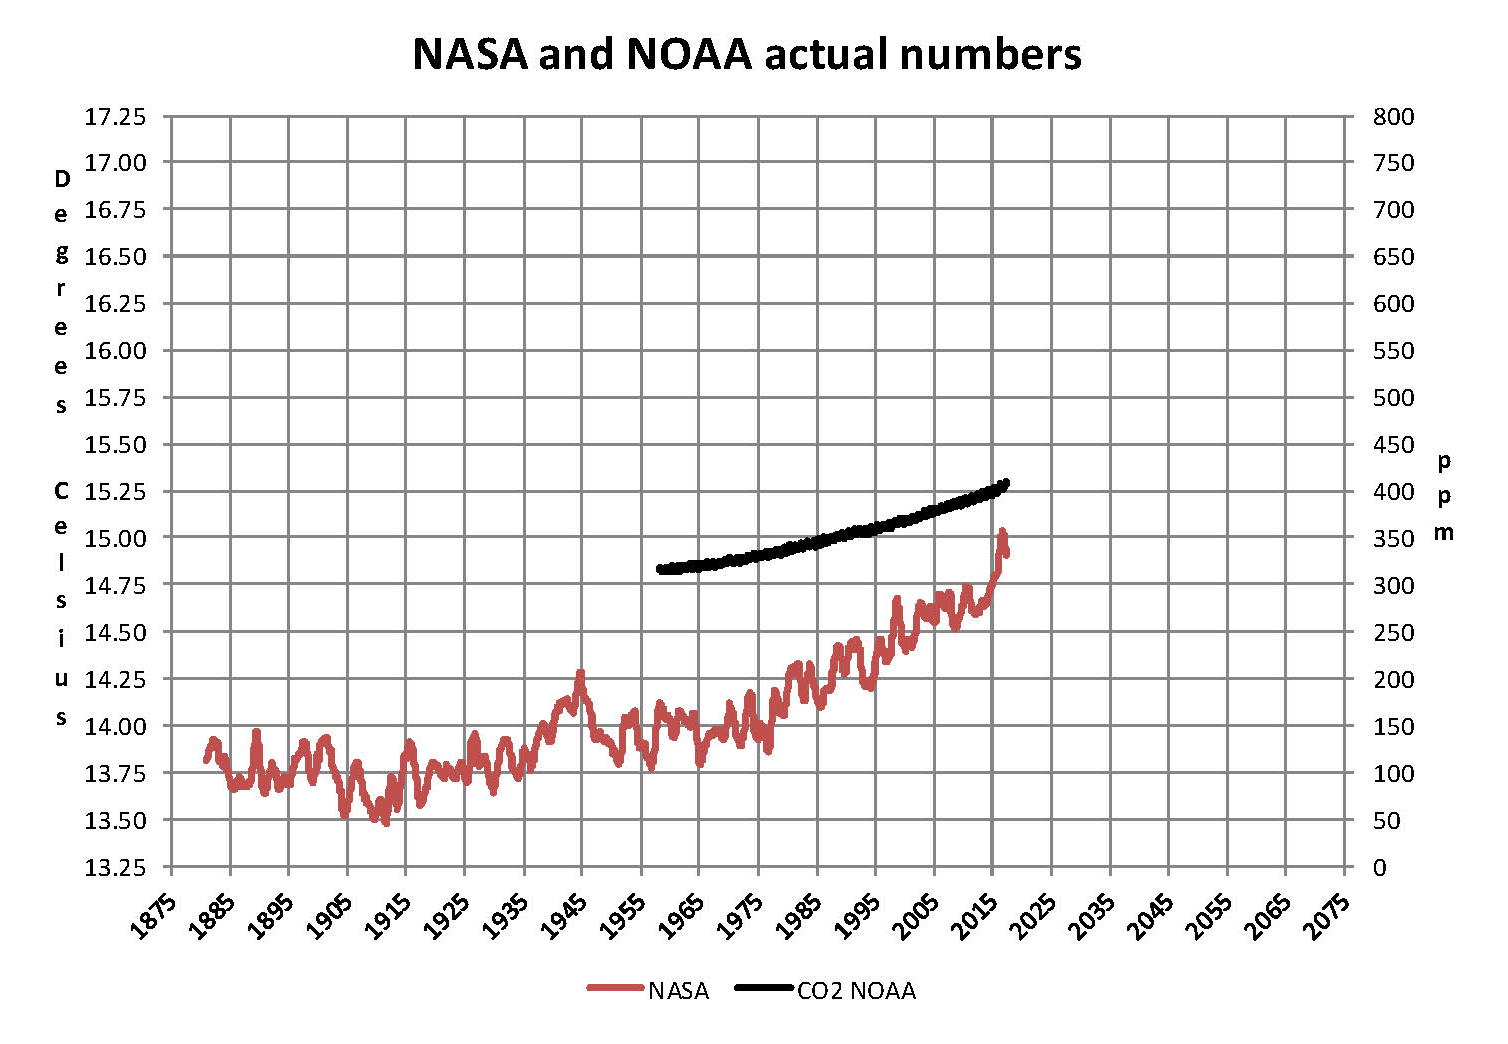
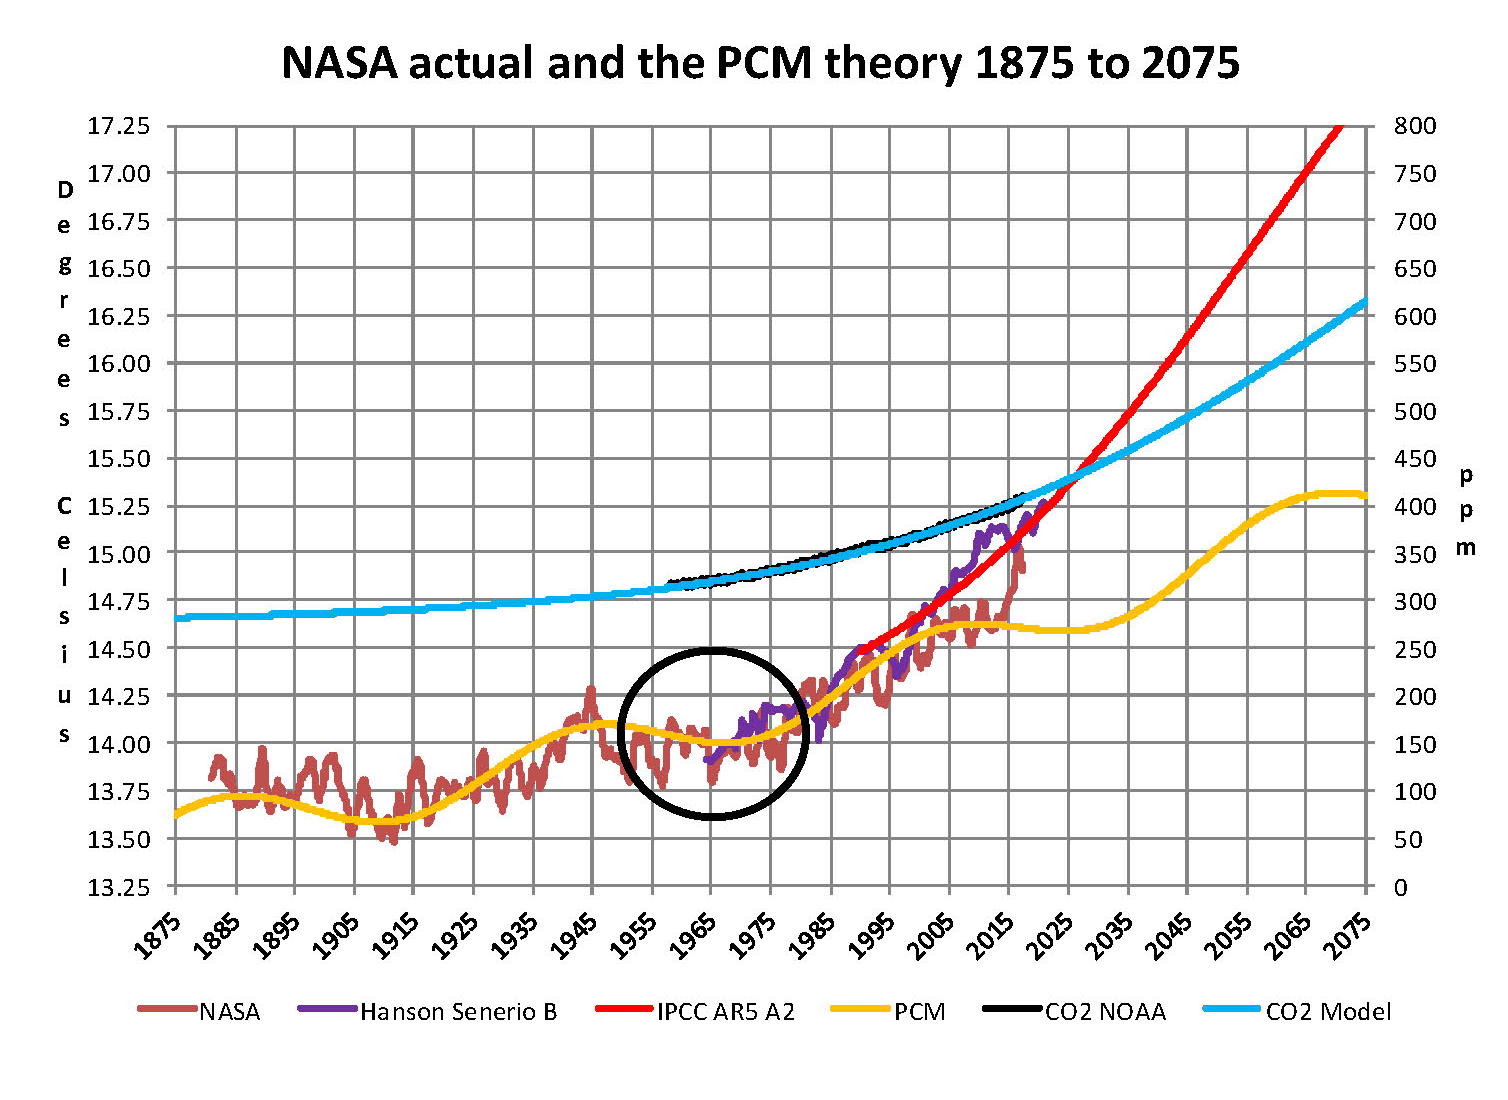
The analysis and plots shown here are based on the following two data series. First NASA-GISS estimates of a global temperature shown as an anomaly (converted to degrees Celsius) as shown in their table Land Ocean Temperature Index (LOTI) and shown in the following Chart as the red plot labeled NASA. This plot is shown as a twelve month moving average to minimize the large monthly swings and better show trends; the scale for the temperatures is on the left. Second NOAA-ESRL Carbon Dioxide (CO2) values in Parts Per Million (PPM) which are shown in the following Chart as a black plot labeled NOAA. This plot is shown exactly as the data from NOAA is presented and there is no need for a moving average the scale for CO2 is shown on the right.
NASA published data as stated in the first paragraph is shown as an anomaly, but what is a temperature anomaly? An anomaly is a deviation from some base value normally an average that is fixed. There were two problems with the system that NASA picked which were number one there is no “actual” global temperature and two since climate is a variable there cannot be a real base to measure from. NASA known for its science and engineering expertise back in the day thought it could get around these issues and created a system to do so. First they developed a computer model which took readings from all over the planet and made significant adjustments to them called homogenization and came up with the estimated global temperature. Second they picked the period 1950 to 1980 (30 years) and averaged the values and came up with 14.00 degrees Celsius and make that their base. Then they took the calculated temperature and subtracted the base from it which gave them the anomaly. The problem is that both the base and the anomaly are arbitrary.
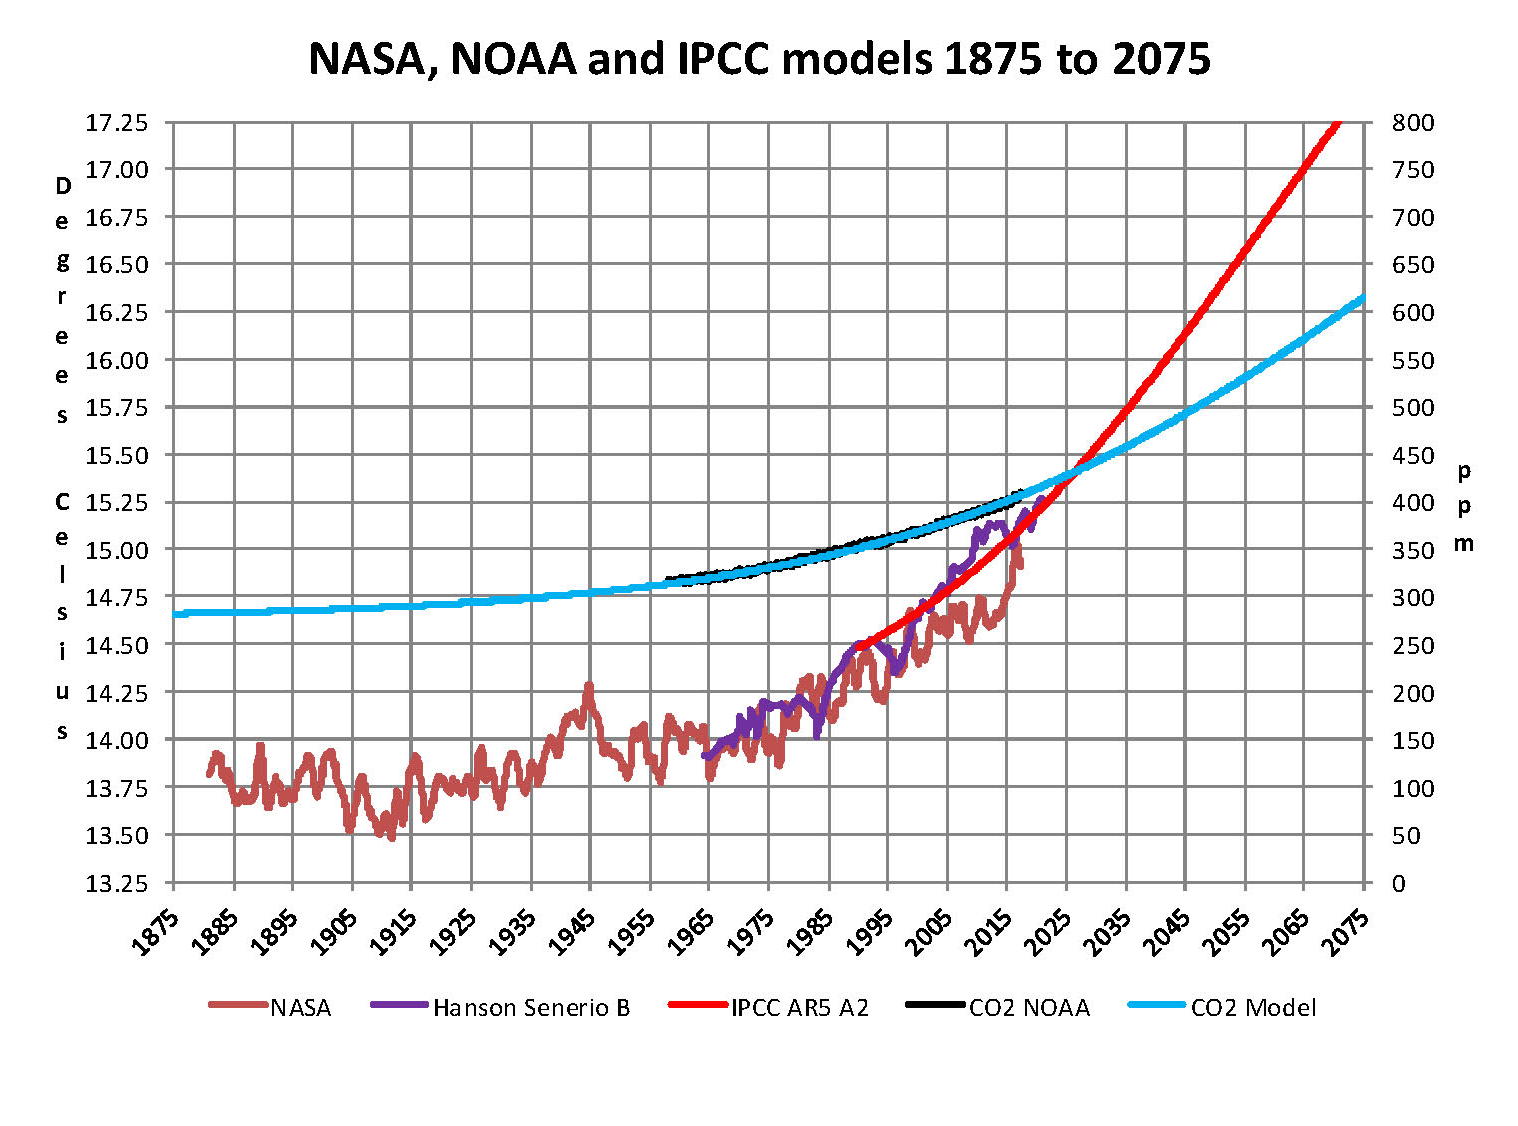
Now that we have a base to work with we are going to add to the previous Chart three things. The first is a trend line of the growth in CO2 since that is the entire basis for climate change according to the government through NASA and NOAA. That plot is superimposed over the black plot of the actual NOAA CO2 values as the cyan line labeled as the CO2 Model and one can see there is a very good fit to the actual NOAA values so there should be no dispute about its validity. This plot allows us to make projections to future global temperatures according to the projected level of CO2 . The second added item is James E. Hansen’s Scenario B data, which is the very core of the IPCC Global Climate models (GCM’s) and which was based on a CO2 sensitivity value of 3.0O Celsius per doubling of CO2. This plot is shown here in lavender and is part of a presentation that Hansen showed to congress in 1988 when the UN was about to set up the International Panel on Climate Change (IPCC) and this plot is labeled as Hansen Scenario B which Hansen stated was the most likely to happen based on his theories’. The third item is the current plot of the most likely temperature of the planet based on the growth of CO2 published by the IPCC. This plot is shown in Red and is labeled as IPCC AR5 A2 as that is the table where the data was found. This plot is a GCM computer projection of the planets temperature based to the complex relationships developed on the levels of CO2 by the IPCC primarily though NASS and NOAA.
It can be seen in this Chart that the lavender plot and the Hansen plot are very close from 1965 to around 2000 after that, from 2000 to 2014, there is a very large and growing deviation reaching close to .5 degrees Celsius in 2014, which is not an insubstantial number. Also of note is that there doesn’t seem to be a good correlation between the growth in CO2 and the increase in the planets temperature. The CO2 is going up in a log function and the Temperature was going down in a log function until recently where it reversed in 2015 and is now going up in a log function. That unexplained and major change in temperature direction appeared to have occurred between 2013 and 2014 and is the subject of this monthly paper.
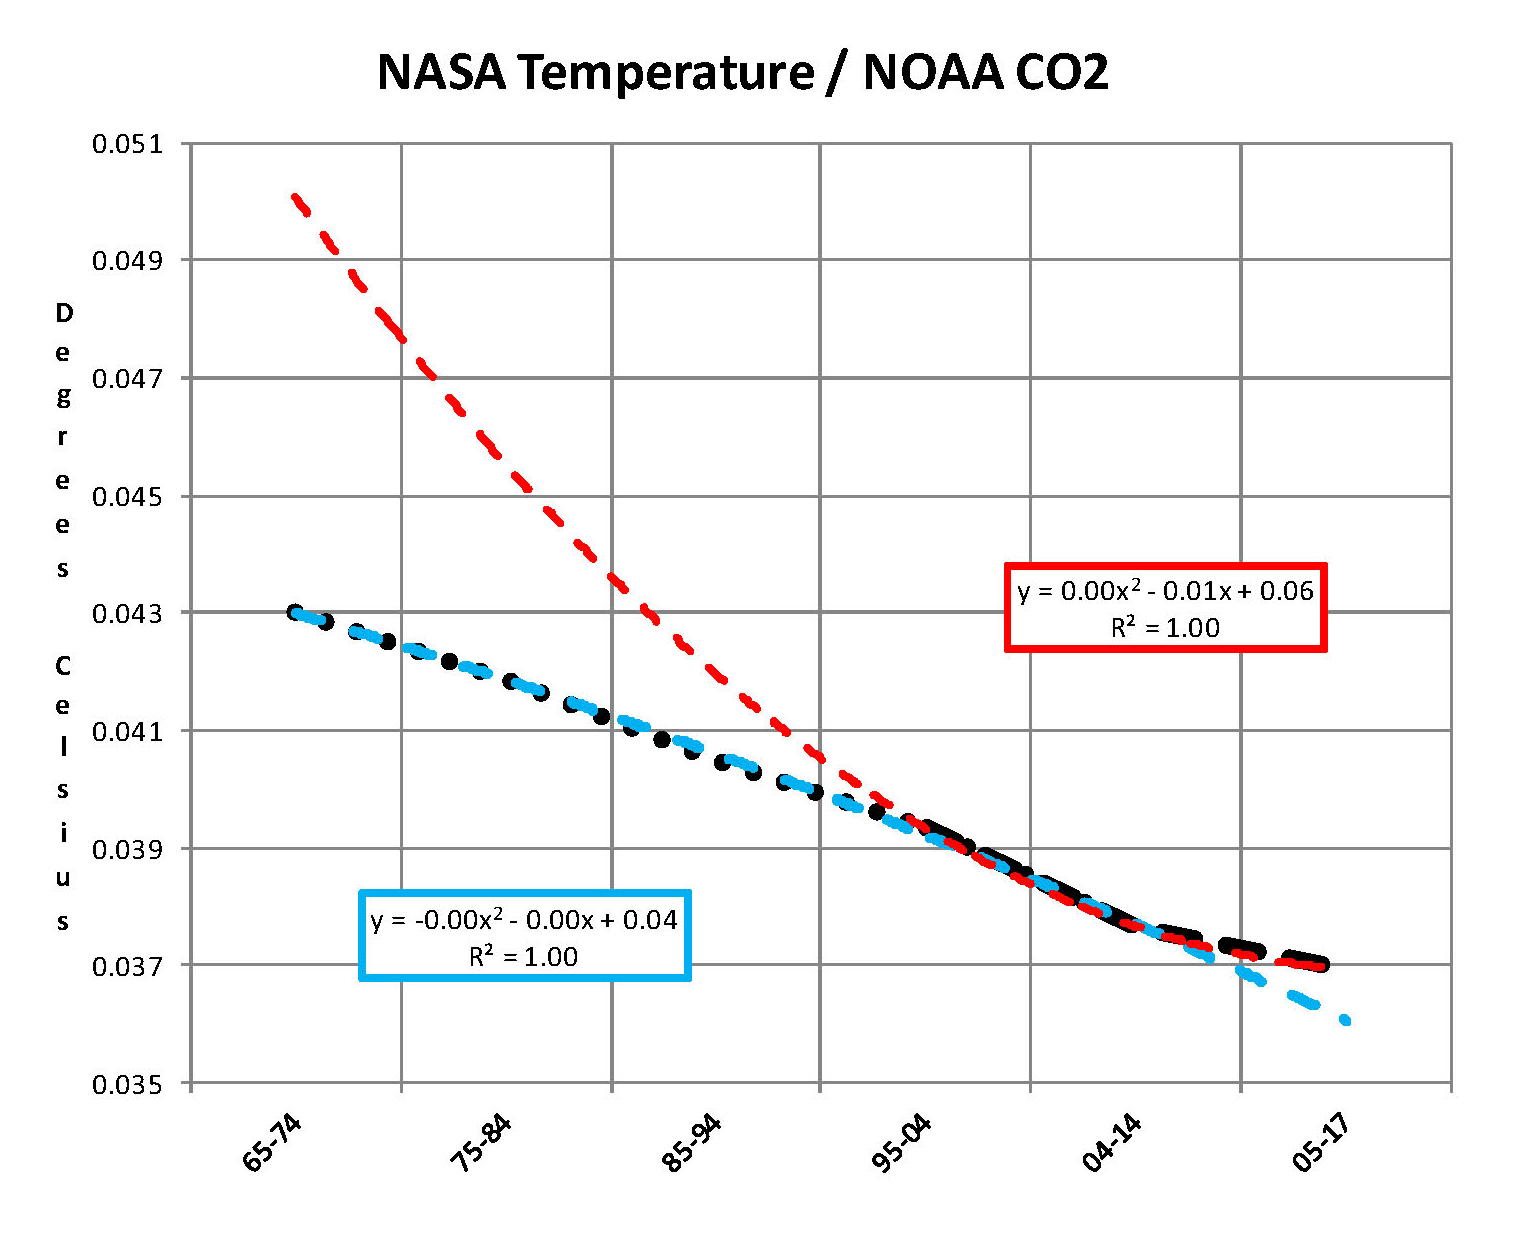
The next Chart is developed from the raw data from NASS and NOAA as shown in the first Chart. This plot was made first by adding ten years blocks of temperature and CO2 as indicated in the Chart and diving by 120 to give an average for each. Then the average Temperature was divided by the average CO2 to give degrees of temperature increase per PPM of CO2. After that was plotted it appeared that there were two different curves the first was from block 1965-1974 through block 2004-2014 shown as Black Dots and the second was from block 1995-2004 through block 2005-2016 shown as Black Dashes. When trend lines were added they were both almost perfect fits to the raw data and so you cannot see the data points very well on the Chart. These blocks were picked to represent the entire period of time where we had both NASA temperature data and NOAA CO2 levels.
On the following Chart are two sets of color coded information. The first is Cyan plot and the Cyan box with the equation in it along with the R2 value of 1.0 are for the first series from block 1965-1974 through block 2004-2014. The other is the Red plot and the Red box with the equation in it along with the R2 value of 1.0 which are for the first series from block 1965-1974 through block 2004-2016. We can speculate on how this change has happened but it cannot be said that the plot change is not real; however additional data over the next few years will be required to actually prove that something has changed.
In summary the Cyan data set indicates a diminishing effect of CO2 on global temperature for about 54 years and the Red data set represents an increasing effect of CO2 on global temperature for the past 2 years. Since both data sets have an R2 value of 1.00 the trend lines cannot be in question.
Before we get into a possible explanation to the drastic change from the Cyan data to the Red data that occurred in 2014 we need to consider other factors than CO2 on Climate change. The fault that occurred in the work that was done in the 1980’s was in assuming that there was an optimum or constant global temperature and therefore any change that was being observed was from the increasing amount of CO2 in the atmosphere. There may have been correlation but it was never proved that there was causation (high R2 value) between CO2 and global temperatures. With that assumption, which limited options, we moved from true science into the realm of political science. True science has an open mind and finds relationships that work in matching observations with predictions. Political science changes history and/or facts to match the desires of the politicians. Since the politicians control the money political science is what we get; which means that what we get may not be technically correct.
A decade ago when I started looking at “climate” change the first thing I did was look at geological temperature changes since it is well known that the climate is not a constant; I learned that 52 years ago in my undergrad geology and climatology courses in 1964. The next paragraph explains currently observed patterns in climate related to this subject and is historical accurate.
Ignoring the last Ice Age which ended some 11,000 years ago when a good portion of the Northern hemisphere was under miles of ice the following observations give a starting point to any serious study on the subject of climate. First, there is a clear up and down movement in global temperatures with a 1,000 some year cycle going back at least 3,000 to 4,000 years; probably because of the apsidal precession of the earth’s orbit of about 20,000 years for a complete cycle. However about every 10,000 years the seasons are reversed making the winter colder and the summer warmer in the northern hemisphere. 10,000 years from now the seasons will be reversed again. Secondly, there are also 60 to 70 year cycles in the Pacific and the Atlantic oceans that are well documented. These are known as the Atlantic MultiDecadal Oscillations (AMO) in the Atlantic and as La Nina and El Nino in the Pacific. Thirdly, we also know that there are greenhouse gases such as carbon dioxide that can affect global temperatures. Lastly the National Academy of Sciences (NAS) estimated that carbon dioxide had a doubling rate of 3.0O Celsius plus or minus 1.5O Celsius in 1979 when there were only two studies available and one for sure and maybe both were not per reviewed.
The result of looking objectively at the three possible sources of global temperature changes was a series of equations based on these observations that when added together produced a sinusoidal curve that seemed to follow NASA published temperatures very closely when first developed in 2007. Since this curve was based on observed temperature patterns it was called a Pattern Climate Model (PCM) which has been described in previous papers and posts on my blog and since it is generated by “equations” many assume it is some form of least squares curve fitting, which it is not. It does seem to be related to ocean currents where the baulk of the planet’s surface heat is stored.
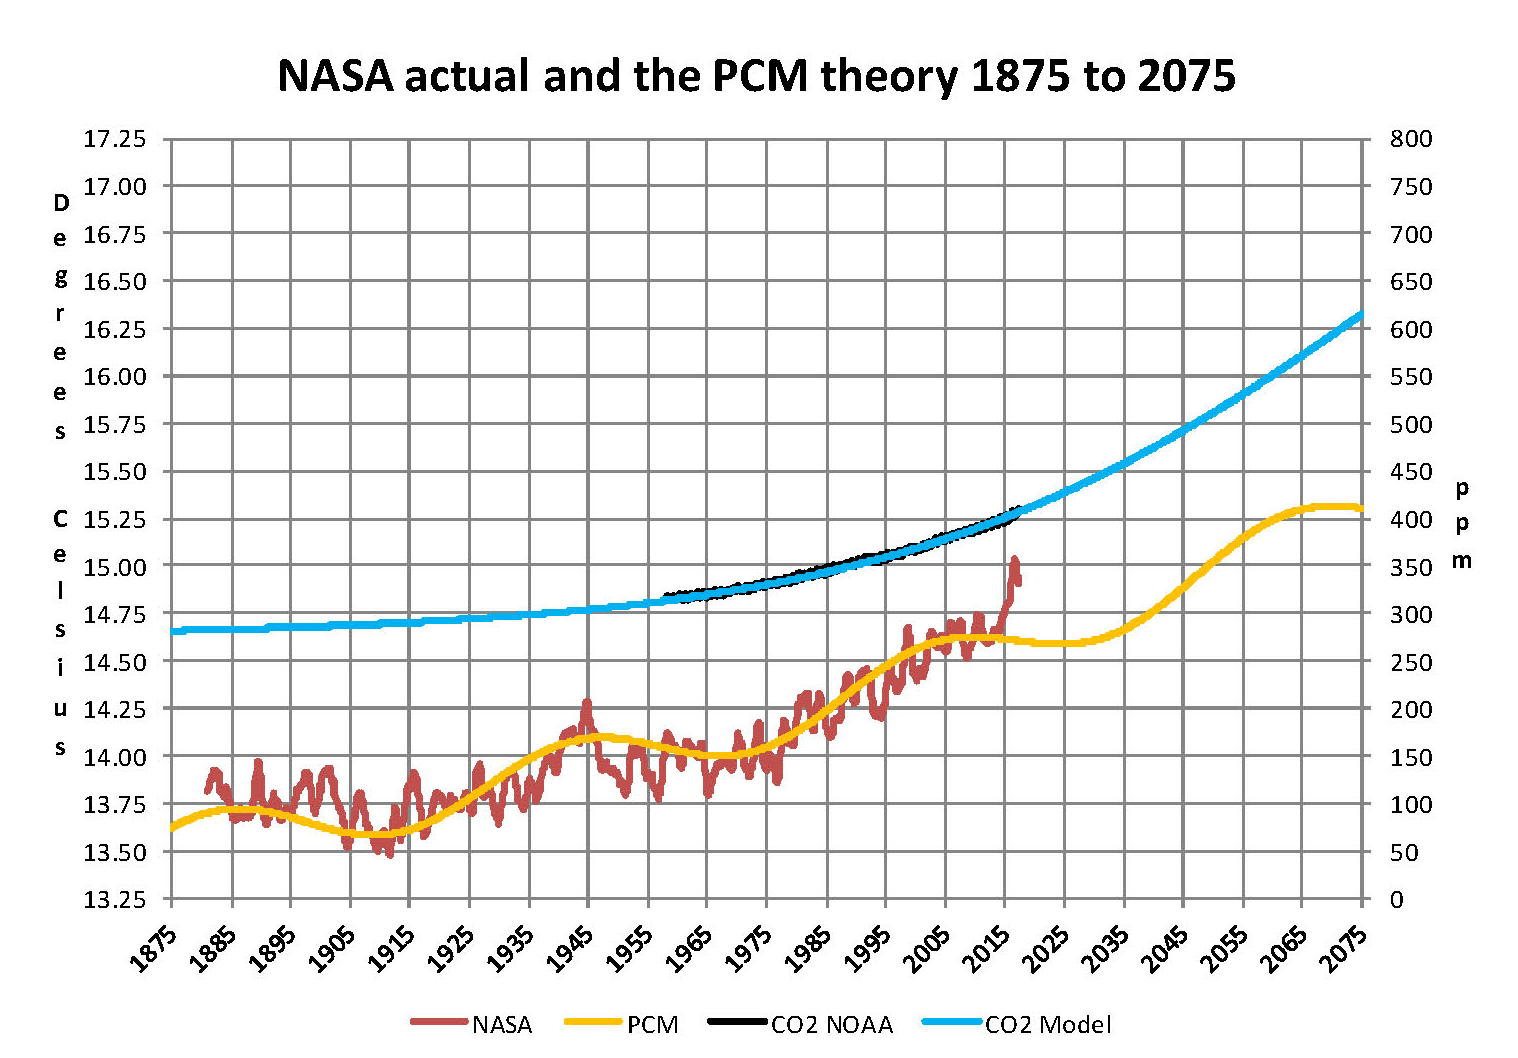
As can be seen in the following Chart the PCM has a 69.1 year cycle that moves the trend line up and then down a total of 0.29O Celsius and we are now in the downward portion of that trend (-.01491O C per year) which will continue until around ~2035. This short cycle is clearly observed in the raw NASA data in the LOTI table going back to 1880. Then there is a long trend, 1036.7 years with an up and down of 1.65O Celsius (.00396O C per year) also observed in the NASA data. Lastly, there is CO2 currently adding about .0079O Celsius per year so together they all basically wash out at -.0039O C per year, which matched the current holding pattern we were experiencing until 2014. After about 2035 the short cycle will have bottomed and turn up and all three will be on the upswing again duplicating what was observed in the 1980’s. Note: the values shown here are only representative as the actual model uses many more places than what are shown here.
When using the 12 month running average for global temperatures up until 2014 the PCM model was within +/- .01 degrees of what NASA was publishing in their LOTI table since the early 1960’s as shown in the next Chart. Further the back projection of the PCM plot matched historical records and global temperatures going back past the time of Christ. It should also be consider that geologically CO2 levels have reached levels many times that of the current 400 ppm without destroying the planet so the current hysteria over the current small numbers can only be explained by political science not real science.
The nest step in this analysis is to put all of the known data and projections into one Chart which will contain: NASA’s table LOTI global temperature estimates, NOAA’s actual CO2 values, the CO2 model projections, the PCM model global temperature plot, Hansen’s Scenario B 1988 global temperature plot, and lastly the IPCC AR5 A2 global temperature plot. With that done we can look at the results and try to make some sense of what is going on with the various arms of the federal government that are promoting that carbon based fuels be eliminated since they are responsible for the global temperature level going up. As previously started when the government pours money into the sciences the sciences respond with technical papers the support the governments views, this is what I call political science verses real science as was done prior to the 1980’s; money talks and BS walks as everyone on the street knows. This Chart views a good overview of the current situation showing all the facts and all the projections.
This Chart contains no manipulation of the data and the only change that was made was to convert the NASA anomalies back to degrees Celsius to make it more readable to lay people. This is only a change in units and has no bearing on the look. A subject not broached here is that of the NASA homogenization process itself and the base period from 1950 to 1980. The portion in the black circle contains the NASA base period of 14.00 degrees Celsius and the reason it’s brought up here is that the Homogenization process causes the global temperatures to move around since the entire data base all the way back to 1880 is recalculated each month. But since the base has to stay at 14.00 degrees Celsius the program must be set to not allow changes in that period of time. I’m sure the programmers have fun with that. Prior work here has shown how this creates a teeter totter effect with the data plots, some of which have recently been significant.
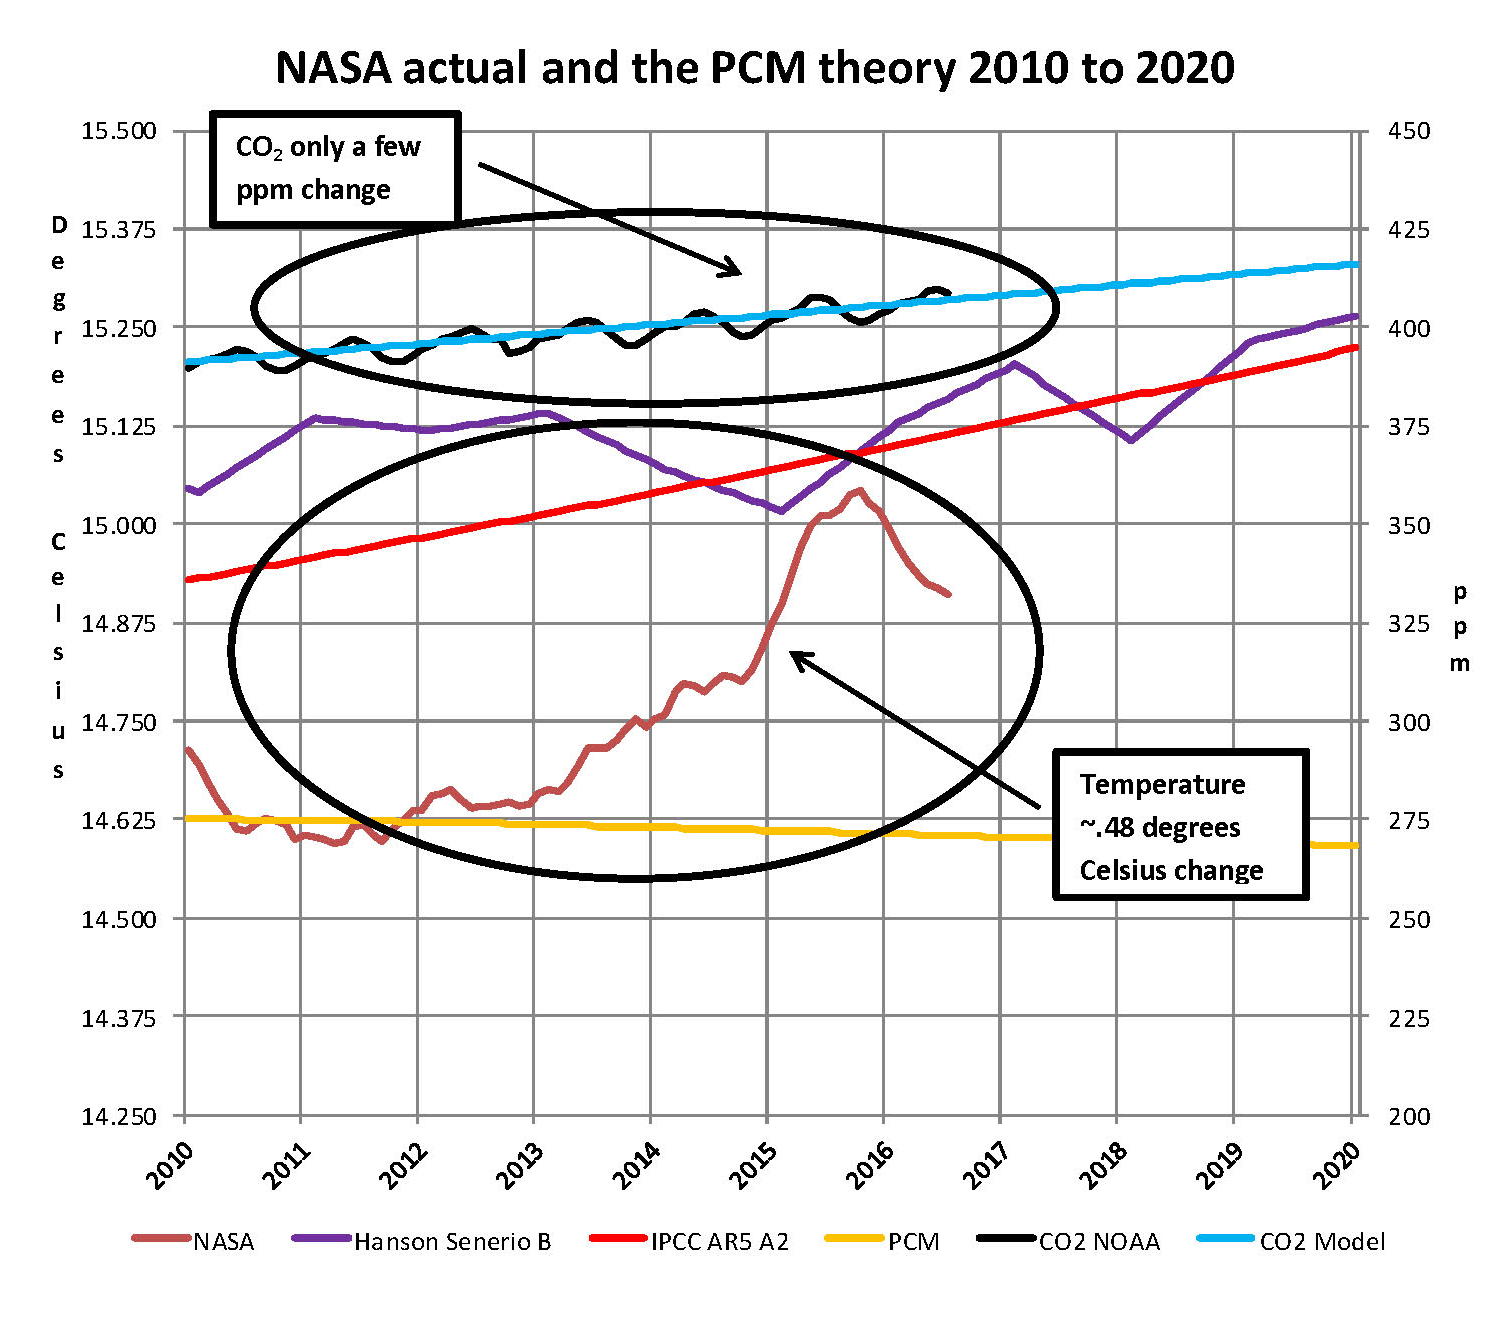
The next Chart will be a look at the period from 2010 to 2020 so we can see the detail of the past few years where a change in CO2 of only a few ppm has caused a major change in the global temperature way beyond anything previously shown in any published NASA data. There are two black ovals on the Chart one at the top of the Chart which is a black oval around the CO2 levels for 2012, 2013, 2014, 2015 and part of 2016 and it’s very obvious that there has been very little change, maybe 7 ppm or about 1.9%. Then at the bottom of the Chart is another black oval around the NASA global temperature levels for 2012, 2013, 2014, 2015 and part of 2016 and its very obvious that there has been a very large change, almost .50 degrees Celsius or about 3.1%. There has never been such a large increase in temperature from such a small increase in CO2.
By contrast the previous comparable period of the last part of 2010 through 2013 shows about the same increase for CO2 at 1.1% but no increase for global temperature but actually small decrease. Worse it appears that this current strange upward trend will continue as the values shown here are based on a 12 month moving average and the current values being published by NASA have been very high for the past 7 months and therefore I would expect the NASA plot to be well over 15.00 Celsius within a few months and certainly before the end of 2016 and that is exactly what happened. After COP21 the need for Fake Warming was no longer needed and so we are now seeing a downward trend developing. With the new administration we may see the end of data manipulation from NOAA and NASA and a return to real science political science.
In summary, the IPCC models were designed before a true picture of the world’s climate was understood. During the 1980’s and 1990’s CO2 levels were going up and the world temperature was also going up so there appeared to be correlation and causation. The mistake that was made was looking at only a ~20 year period when the real variations in climate all move in much longer cycles of decades and centuries. Those other cycles can be observed in the NASA data but they were ignored for some reason. By ignoring those trends and focusing only on CO2 the models will be unable to correctly plot global temperatures until they are fixed.
Lastly, the next chart shows what a plot of the PCM model, in yellow, would look like from the year 1400 to the year 2900. This plot matches reasonably well with recorded history and fits the current NASA-GISS table LOTI data, in red, very closely, despite homogenization. I understand that this model is not based on physics but it is also not true curve fitting. It’s based on observed reoccurring patterns in the climate. These patterns can be modeled and when they are, you get a plot that works better than any of the IPCC’s GCM’s. If the conditions that create these patterns do not change and CO2 continues to increase to 800 ppm or even 1000 ppm than this model will work well into the foreseeable future. 150 years from now global temperatures will peak at around 15.750 to 16.000 C and then will be on the downside of the long cycle for the next ~500 years.
The overall effect of CO2 reaching levels of 1000 ppm or even higher will be about 1.50 C which is about the same as that of the long cycle. The Green plot on the Chart shows the observed pattern with no change in CO2 from the pre-industrial era of ~280 ppm. CO2 cannot affect global temperatures more than 1.500 C +/- no matter what the ppm level of CO2 is. The reason being that the CO2 sensitivity value is not 3.00 per doubling of CO2 but under 1.00 C per doubling of CO2 as shown in more current scientific work.
The purpose of this post is to make people aware of the errors inherent in the IPCC models so that they can be corrected.
The Obama administration’s “need” for a binding UN climate treaty with mandated CO2 reductions in Europe and America was achieved as predicted at the COP12 conference in Paris in December 2015. To support this endeavor NASA was forced to show ever increasing global temperatures that will make less and less sense based on observations and satellite data which will all be dismissed or ignored. Within a few years the manipulation will be obvious even to those without knowledge in the subject, but by then it will be to late the damage to the reputation of science will have been done.
In closing keep this in mind. The current panic generated by the government using political science is that the current global temperature of around 15.0O Celsius is an increase of 7.14% from the 1960’s when the global temperature was 14.0O Celsius; and that does seem like a lot. However those views would be in error as the actual increase in thermal energy, as measured by temperature, would be only .35% because we must use Kelvin not Celsius when working with heat energy. When we use kelvin the temperature goes from 287.15O K to 288.15O K which is only .35% not 7.14% about 1/20 of what is implied by the IPCC.
Sir Karl Raimund Popper (28 July 1902 – 17 September 1994) was an Austrian and British philosopher and a professor at the London School of Economics. He is considered one of the most influential philosophers for science of the 20th century, and he also wrote extensively on social and political philosophy. The following quotes of his apply to this subject.
If we are uncritical we shall always find what we want: we shall look for, and find, confirmations, and we shall look away from, and not see, whatever might be dangerous to our pet theories.
Whenever a theory appears to you as the only possible one, take this as a sign that you have neither understood the theory nor the problem which it was intended to solve.
… (S)cience is one of the very few human activities — perhaps the only one — in which errors are systematically criticized and fairly often, in time, corrected.
Sir Karl Raimund Popper (28 July 1902 – 17 September 1994) was an Austrian and British philosopher and a professor at the London School of Economics. He is considered one of the most influential philosophers for science of the 20th century, and he also wrote extensively on social and political philosophy. The following quotes of his apply to this subject.
If we are uncritical we shall always find what we want: we shall look for, and find, confirmations, and we shall look away from, and not see, whatever might be dangerous to our pet theories.
Whenever a theory appears to you as the only possible one, take this as a sign that you have neither understood the theory nor the problem which it was intended to solve.
… (S)cience is one of the very few human activities — perhaps the only one — in which errors are systematically criticized and fairly often, in time, corrected.
Solar eclipses have been observed throughout history. As to be expected, they have often been seen as omens along with comets. We hear if the star of Bethlehem that announced the birth of Jesus and the comet that appeared the night Julius Caesar was assassinated, which has been historically recorded on coins proving his divinity.
Yet eclipses have also been seen as major markers of events throughout time. There is of course the famous eclipse that marked the Crucifixion of Jesus. The Christian gospels say that the sky was darkened for hours after the crucifixion of Jesus, which historians viewed either as a miracle or a portent of dark times to come. Later historians used astronomy to pinpoint the death of Christ based on this eclipse mention. Some historians tie the crucifixion to a total solar eclipse lasting 1 minute and 59 seconds that occurred in the year 29 AD while others say a second total eclipse, blocking the sun for 4 minutes and 6 seconds, in 33 AD, marked Jesus’ death. In the Vatican Codex, the oldest copy of the Greek Bible speaks of the solar eclipse in the Book of Luke. This is supported by a Greek historian named Phlegon, who also recorded a solar eclipse at the same period. Phlegon wrote a history entitled The Olympiads, in which he records during the rule of Tiberius Caesar a three hour eclipse of the sun. The ellipse of the sun took place at the time of Tiberius Caesar, in whose reign Jesus was crucified, and the great earthquakes which then took place.
Yet what is very interesting, is the fact that the eclipse of 33AD was also timed with the Great Financial Panic in Rome. The Financial Panic of 33AD provides one of the few detailed accounts of events recorded by the ancient historian Tacitus (56–117AD) whose primary focus appears to be moneylending.
Where a comet marked the birth of Jesus, it was an eclipse that marked the birth of Mohammed. The Koran mentions an eclipse that preceded the birth of Mohammed. Historians later tied this to a total eclipse that lasted 3 minutes and 17 seconds in 569 AD. The sun also disappeared for 1 minute and 40 seconds after the death of Mohammed’s son Ibrahim. But the world’s first Muslims didn’t believe that eclipse was a sign from God. Instead, according to Islamic texts called the Hadiths, Mohammed proclaimed “the sun and the moon do not suffer eclipse for any one’s death or life.”Muslims pray five times daily, but during eclipses they specially perform the “eclipse prayer” whose purpose is to remember the might and gifts of Allah the Creator.
Eclipses of the Sun are indeed awe-inspiring phenomena that have inspired legends and correlations throughout time. Such events have truly inspired a variety of claims. In many early cultures they were seen as omens of the coming end of the world. The word eclipse is of Greek origin meaning stemming from abandonment, desertion, or relinquishment.
In China, India, and Southeast Asia as well as in Peru there were beliefs that dragons or demons attack the Sun during such eclipses trying to devour it. The ancient Egyptian myth of the snake Apep that attacks the boat of the Sun god is believed now to refer to solar eclipses. The cult of the Sun god Sol remains with us today in so many ways. The cult was Sol Invictus or the invincible sun that reappeared every day. Sol was depicted with rays of sunlight coming from his head. That is the model of the Statue of Liberty. This also appeared as a halo around his head, and this tradition is why Christians often used this same symbol around the heads of Jesus and saints.
The Chinese and the Incas tried to frighten these dragons and demons away who were trying to devour the sun and end the world through various incantations which were believed to work since the eclipse would end and everyone most likely cheered and gave money to the priests. The Indians immersing themselves in water as a religious ritual to help the Sun struggle against the dragon. The bathing rituals are often linked to this idea.
Even today, in some countries, it is still traditional to bang pots, chant or shoot into the air when an eclipse happens to frighten off bad omens and preserve the world for another day. Some superstitions have even attributed disease comes from the solar eclipses ushering is famine and pestilence.
It was the Babylonians who in fact were the first state funded research project recording everything that ever moved from the planets to the migration of animals. Indeed, it was this massive state funded project that not merely led to astrology trying to link events on earth and traits in people to the cyclical movement of the heavens, but it led to Babylonian Priests becoming very powerful. They linked events as omens that indicated an impending miracle, the wrath of God, or the doom of a ruling dynasty. They understood the eclipse and could pronounce they were so powerful, they could darken the sun tomorrow. Who could possible do that without awesome power which the people them gave piles of gold. In 129 BC, the Greek astronomer Hipparchus had published his star charts and he relied upon the Babylonian records of several hundred years prior.
A Saros series is a series in which similar eclipses happen every 18 years 10/11 and a third days. Eclipses happen more often than that but the cycles are complex for there are many combinations of circumstances that can produce an eclipse. So there are at any given time, 42 Saros cycles running at once, which produces more than 2 eclipses per year. The same cycles come together to produce the same set of similar eclipses every 18 years and 10 or 11 and a third days. This period is what the Babylonian priests/ astronomers discovered 2,500 years ago and we retain that name Saros, meaning “repetition.” This too is fractal and we are currently in Saros series 125. The series contains 72 eclipses, occurring over 1280 years.
Ancient eclipse records made in China and Babylonia are believed to be over 4,000 years ago. Recent research has demonstrated that solar eclipses had been depicted in the fascinating mythology of ancient Egypt, and produced evidence that the ancient Egyptians also observed solar eclipses over 4,500 years ago.
The earliest recorded eclipse is described on an ancient clay tablet, in Ugarit in modern-day Syria. A total solar eclipse was linked to an uprising in an ancient Assyrian city. So will the total eclipse over the United States, be an omen of what is to begin in 2018 according to our models rekindling this view of a total eclipse as an omen of what is to come?
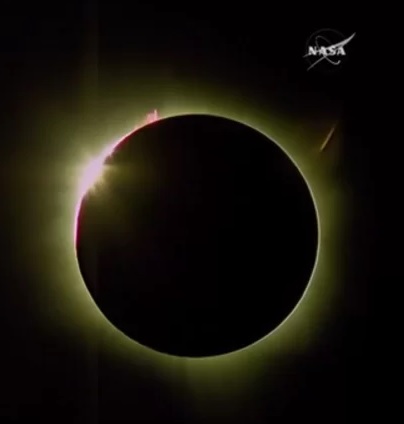
After all, this will be the FIRST total solar eclipse visible in the United States in nearly four decades that will take place on Aug. 21, 2017. This will be called the Great American Total Solar Eclipse, the 70-mile-wide shadow cast by the moon will darken skies from Oregon to South Carolina. Most solar eclipses, the moon takes just hides a tiny bit of the sun, but this will be a rare total solar eclipse.
Believe it or not, this August event will go down as the FIRST total solar eclipse whose path of totality stays completely in the United States since 1776 when the American Revolution took place. The 1776 Eclipse was a total eclipse of the Moon which occurred on Wednesday July, 31st, 1776. The Declaration of Independence was presented on July 1, 1776, and on the following day 12 of the 13 colonies voted in favor of Richard Henry Lee’s motion for independence. The delegates then spent the next two days debating and revising the language of a statement drafted by Thomas Jefferson. Then on July 4th, Congress officially adopted the Declaration of Independence. However, it was nearly a month before the actual signing of the document took place. First, New York’s delegates didn’t officially give their support until July 9th, which many have long since viewed the ”New Yorkers” as moving to a different beat, which is why red lights are optional in the city for pedestrians. Then it took two weeks for the Declaration to be “engrossed” which meant written on parchment in a clear hand. Most of the delegates then signed the Declaration of Independence actually on August 2nd, 1776 two days after the eclipse, which some said also was an omen.
This time, the 2017 eclipse comes in August when our model has been projecting an important turning point. It is very strange that this is coming at a time when our model is warning of the start of the Monetary Crisis in 2018. Is this also an omen as was the 1776 eclipse?
The fascinating question begs to wonder if this eclipse will make the TOPTEN eclipses in history? There was the Ugarit Eclipse which is one of the earliest solar eclipses recorded darkening the sky for 2 minutes and 7 seconds on May 3, 1375 BC, according to an analysis of a clay tablet, discovered in 1948. However, this was revised when a report appeared in the journal Nature back in 1989 suggesting that the eclipse actually took place on March 5, 1223 BC based upon historical dating of the tablet and the text which mentioned the visibility of the planet Mars during the eclipse. In approximately 1230 BC, there was the Battle of Nihriya which was the fall of the Hittite Empire to the Assyrian Empire. The rise of the Assyrians even intimidated the Egyptians and in 2 Chronicles 32:15, it reads:
‘Now therefore, do not let Hezekiah deceive you or mislead you like this, and do not believe him, for no god of any nation or kingdom was able to deliver his people from my hand or from the hand of my fathers. How much less will your God deliver you from my hand?’”
About 1221 BC, the Pharaoh Merneptah defeated the Libyan invasion, which was a combined force in union with the Sea People who were most likely invading Greeks.
The next major event is known as the Assyrian Eclipse. In 763 B.C., the Assyrian empire, which occupied modern Iraq, saw a total eclipse of the sun for 5 minutes. Early records from the period mention the eclipse in the same passage as an insurrection in the city of Ashur, now known as Qal’at Sherqat (shown in the image) in Iraq, suggesting that the ancient people linked the two in their minds. This marked the real beginning of the Assyrian Empire’s aggression for it then conquered Egypt in 671BC following the good omen of the appearance of Haley’s comet in 674BC, The Assyrian Empire lasted for only 3 waves of 51.6 years when it fell at the Battle of Carchemish in 605 BC to the armies of Babylonia, allied with the Medes, Persians and Scythians. There were eclipses in 605 BC, and 602 BC. Three months, December 689 BC, November 678 BC, and October 602 BC, had two eclipses. The Babylonian king Nebuchadnezzar in his Chronicle, recorded that he:
“…crossed the river to go against the Egyptian army which lay in Karchemiš. They fought with each other and the Egyptian army withdrew before him. He accomplished their defeat, decisively. As for the rest of the Egyptian army which had escaped from the defeat so quickly that no weapon had reached them, in the district of Hamath the Babylonian troops overtook and defeated them so that not a single man escaped to his own country. At that time Nebuchadnezzar conquered the whole area of Hamath.”
In 1302 BC, Chinese historians documented the total eclipse which blocked out the sun for 6 minutes and 25 seconds. Since the sun was a symbol of the emperor, an eclipse naturally was a serious warning to the emperor. After an eclipse, the duty of the emperor was to fast eating only vegetarian meals and performing rituals to rescue the sun. In fact, in ancient China, since the solar and lunar eclipses were regarded as heavenly signs that foretell the future of the Emperor. If an astrologer failed to predict an eclipse, they were executed. Finally, by 20 BC, Chinese astronomers realized the true nature of solar eclipses, and by 206AD, Chinese astronomers were able to predict solar eclipses by analyzing the motion of the Moon.
Ruins at Yin
This event seems to have also marked Pangeng moved the capital of Shang Dynasty to Yin in China, perhaps because of this eclipse. However, this is also the period (c. 1300 BC—1312 BC) when the revelation of the Torah to Moses took place.
Herodotus, the Greek father of history, reported that Thales (ca. 624-547 BC), the Greek philosopher, predicted the solar eclipse of May 28th, 585 BC that put an end to the conflict between the Lydians and the Medes.
Herodotus wrote:
… day was all of sudden changed into night. This event had been foretold by Thales, the Milesian, who forewarned the Ionians of it, fixing for it the very year in which it took place. The Medes and the Lydians when they observed the change, ceased fighting, and were alike anxious to have terms of peace agreed on.
The Eclipse of 241BC marked the end of the First Punic War (264–241 BC) and the first Emperor of China, Qin Shi Huang (259-210BC), came to the thrown in his state in 246BC. He then begins to engage in the Waring States period and conquers all of China becoming the emperor in 220 BC. There was a total eclipse on June 4th, 241 BC 02:47:32 in SarosCycle72. The seems to have marker the fall of Carthage and the Rise of Rome as well as the start of the Qin conquest of China. We can see the cost of the Punic Wars in the debasement of the bronze coinage of Rome. The silver denarius was introduced in 211BC. It was also Eratosthenes who actually calculated the circumference of the Earth in 240BC and determined the Earth’s circumference and it was round. His data was rough, but he wasn’t far off.
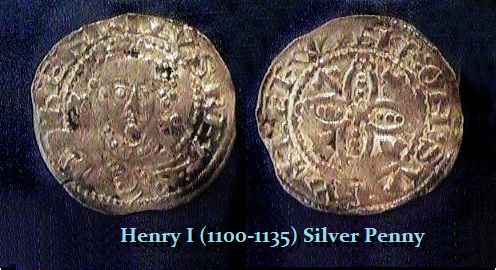
Also on this list of the TOP TEN eclipses in history we have King Henry’s Eclipse in England. When King Henry I of England, the son of William the Conqueror, died in A.D. 1133, the event coincided with a total solar eclipse that lasted 4 minutes and 38 seconds. After this eclipse and the death of Henry I, a struggle for the throne plunged England into chaos and civil war. In the Anglo-Saxon Chronicle, a passage is also found recording this eclipse:
“In this year King Henry went over sea at Lammas, and the second day as he lay and slept on the ship the day darkened over all lands; and the Sun became as it were a three-night-old Moon, and the stars about it at mid-day. Men were greatly wonder-stricken and were frightened, and said that a great thing should come thereafter. So it did, for the same year the king died on the following day after St Andrew’s Mass-day, Dec 2 in Normandy.”
Not all eclipses are bad omens. The element helium was discovered on August 18th, 1868 by the French astronomer Jules Janssen (1824-1907) when he observed the spectrum of the Sun during a total eclipse in India. Then there was also Einstein’s Eclipse of 1919. It was this solar eclipse where the sun vanished for 6 minutes and 51 seconds. This allowed the observation that gravity in fact could bend light from the stars as they passed near the sun. The findings confirmed Einstein’s theory of general relativity, which describes gravity as a warping of space-time. The British astronomer Sir Arthur Eddington (1882-1944) travelled to the island of Príncipe near Africa to observe that eclipse to verify Einstein’s conclusion that light is deflected in the gravitational fields of celestial objects.
So the question becomes, does this 2017 Solar Eclipse mark the fall of the Western Culture and the beginning of the shift in the financial capital of the world to China?
It is curious that such events tend to line up at times with our model. Of course, our model is derived from the data, not astrology. So we have tracked the trends (effects) but have never attempted to attribute the cause to some mystical event.
We track the effects and the ebb and flow of human events that leave their footprints throughout the centuries. Is there any connection? It is far too complex to try to attribute such things to a single event. There are numerous total eclipses throughout history. Where they occur seems to have little correlation to events in other regions.
We will see with this one since it is the first time since 1776 to appear in the United States. Have a party today and say here’s to posterity. We will.
Believe it or not, the latest conspiracy brewing is that the Russians not only defeated Hillary, they have figured out how to shift the planet and weather and have manipulated the planet so that the North Pole is headed to London to freeze Europe so they will have to buy more gas, and they are creating a warmer climate in Siberia to exploit the natural resources there.
Well it is true that Europe is turning colder and government have invested so much into this Global Warming they cannot now admit that all this propaganda is just that – propaganda. And yes, Siberia is experiencing record warming. They are wearing bikinis in Siberia!
Obviously, the Russians have devised a way to shift the pole, reverse its direction in 2000, send it to Europe, and then made sure Hillary lost and Trump won the White House who knows what the Russians have so so that is why he is against the Global Warming propaganda since he too wants to sell gas to Europe as it freezes. They also wanted to see girls in bikinis in Siberia. That was also part of the conspiracy. Not sure where it ranked be it number one or number ten on the list of motives.
Great Conspiracy theory – those clever Russians. As long as Florida stays warm I’m OK with it a
First, thanks for this article (on Facebook shutting down AI). It is the first non-sensacionalist and serious post I read on this topic. Although, I found it somehow contradictory. Your main statement is that all the history is cyclical. But in this post you say “Therefore, we can create a computer that remembers the past like a dog and projects into the future without actually conceptualizing what the future might truly mean as is the case with a dog.” Why this fact would make AI weaker? Isn’t it your future forecasting obtained from “the data from the past you collected”?
Thanks so much in advance,
Regards from Spain
F
ANSWER: The computer can determine the cycle from all the collective data interlaced from around the world. It can forecast turning points decades in advance. But that does not mean it comprehend what the future really is as to a human being. It may seem to be a subtle distinction, but it is the difference between a computer and a conscious being that also knows it has a shelf-life and will grow old and die. I am working hard to deliver Socrates because I have a shelf-life. It is the only way to allow such research to continue beyond my life-span. I do this for posterity for it has taught me so much. It will most likely only be recognized by mainstream after my death and then they will try to discredit it by crafting stories about me personally attacking the creator because they cannot dispute the research Socrates reveals. That is simply how human nature operates historically. Someone one day will quote this very line I just wrote. That is inevitable. Welcome to humanity.
The concept of the future is hard to express in words but I can say to you let’s go to dinner next Tuesday. You can conceptualize the future and say yes or you will be busy can we make it Wednesday? That is a dynamic conception laced with many aspects in our mind. A dog has no concept of tomorrow. A computer can project turning points into the future from the past, but it does not have a concept of the future. It is very black and white void of emotion.
There is another hidden order of dynamic multi-dimensional structure we do not understand yet with the human mind. The formal link between neural network structure and how the brain actually functions in processing information does not truly exist and anyone claiming to have some neural net to predict the future is just nonsense. Those claiming to have created AI programs using a neural net to forecast markets is more-likely-than-not just a consumer fraud or simply another model destined to fail. We do not yet understand neural networks in our own brain so we cannot duplicate it in programming. On top of that, neuroscientists have used a classic branch of math in a totally new way to peer into the structure of our brains. What they’ve discovered is hard for us to even visualize that the brain is full of multi-dimensional geometrical structures operating in as many as 11 dimensions.
We live in a 3-D world perspective. We are not yet capable of understanding how there can be 11 dimensions all interacting. What is the structure? How does this even function? The results of this new study is the next frontier in trying to understand the fabric of the human brain which somehow is the machine used by our mind that is our consciousness The human brain, by the way, is the most complex structure we know of no less an amazing super-computer. And someone wants to claim they have an AI computer neural net to forecast markets? Good one. How can you create a neural net we do not yet understand to forecast something that is so complex, it defies description? If we do not yet understand how such a neural net functions in our own brain, how can you write as computer program to mimic such a neural net? How can some neural net suddenly evolve and become conscious if we do not even understand the structure at the core level?
This latest brain model was produced by a team of researchers from the Blue Brain Project, a Swiss research initiative devoted to building a supercomputer-powered reconstruction of the human brain. They used algebraic topology, a branch of mathematics used to describe the properties of objects and spaces regardless of how they change shape. They found that groups of neurons connect into ‘cliques’, and that the number of neurons in a clique would lead to its size as a high-dimensional geometric object (a mathematical dimensional concept, not a space-time one).
“We found a world that we had never imagined,” said the lead researcher, neuroscientist Henry Markram from the EPFL institute in Switzerland. “There are tens of millions of these objects even in a small speck of the brain, up through seven dimensions. In some networks, we even found structures with up to 11 dimensions.”
We live in three spatial dimensions plus one time dimension, which we have yet to fully understand as well. Here, the 11 dimensions are how the neuron cliques are connected. Networks are viewed in a structure in terms of groups of nodes that are all connected, which is known as cliques. The number of neurons in a clique determines its size or dimension. The human brain is estimated to have 86 billion neurons, which is a stunning number in itself. These then have multiple connections from each cell webbing in every possible direction. This structure forms a vast cellular network that somehow makes us capable of thought and consciousness that we do not understand.
The Blue Brain Project team focused on the neocortex, which is thought to be the most recently evolved part of our brains, and the one involved in some of our higher-order functions like cognition and sensory perception. Algebraic topology provides mathematical tools for discerning details of the neural network both in a close-up view at the level of individual neurons, and a grander scale of the brain structure as a whole. Connecting these two levels, the researchers could discern high-dimensional geometric structures in the brain, formed by collections of tightly connected neurons (cliques) and the empty spaces (cavities) between them.
What they discovered was amazing structural dynamic complexity, which is really what I discovered taking place with the interconnections globally within the world economy. “It is as if the brain reacts to a stimulus by building [and] then razing a tower of multi-dimensional blocks, starting with rods (1D), then planks (2D), then cubes (3D), and then more complex geometries with 4D, 5D, etc,” according to mathematician Ran Levi from Aberdeen University in Scotland.
What I find so fascinating is that the very same structure emerges at a higher level whereby all human interact globally in the same manner dynamically shifting and reorganizing structures. Socrates is now beyond 150,000 possible daily patterns in the Global Market Watch. This is just stunning. It is like building a sand castle on the beach creating an elaborate structure which is washing away by the sea in the morning. Both in our mind and within Socrates, we have human thought and action capable of creating dynamic structures to solve or react to some event and then vanish awaiting the next problem to rebuild a completely new structure. This multi-dimensional ability to respond to stimuli is just amazing.
How do we dream in concepts that are very imaginative abstracts of reality? We can imagine in a dream concepts and objects that could not exist in the real world. Such as this classic drawing of something that could not exist in reality. We know that the rear portion of our brain gets pretty active during REM sleep, when most dreaming occurs. Some believe that it’s just the brain winding down for the night and that dreams are random and meaningless firings of the brain that we don’t have when we’re awake. There is simply no answer to the question: Why do we dream?I can personally attest to it is not random nor is it just meaningless firings of the brain that we don’t have when we’re awake. There have been complex problems I have thought about with no answer when awake. Yet it is “on my mind” still when I sleep. Suddenly I have woke up in the middle of the night saying “eureka” that’s the answer. This has happened way too many times to support a theory of meaningless randomness.
Take this picture of a girl in the water. Your mind will fill in the blanks as to what you think she looks like. Your mind will create an image that pleases you yet you have not seen her (her picture is at the bottom). Why does the mind fill in the gaps? To the right is another famous drawing. How old is the woman that you see? Is it the mother-in-law or the pretty girl. Which did your mind see first? The mother-in-law with the big nose looking down or the young girl wearing a necklace turned away?
Here is another famous drawing. What animal do you see? The duck with its beak slightly open or the rabbit with its ears pointing to the left? Our mind is capable of creating images from fragments.
To add to all this stunning complexity, we can access data we have stored in our brain for decades from all the five senses. You may hear a song and that will access some event in our past where you perhaps had dinner with someone you fell in love with at least temporarily. Then again, you may return to the place you had that event and suddenly remember that dinner. You might have had some food that night and suddenly you will remember that same event. We can access a memory from any of our senses for our brain is recording everything even if we do not realize it.
There is significant evidence demonstrating that we possess “core object recognition” which is the ability to rapidly recognize objects despite substantial appearance variation. Our brain will engage in reflexive feed-forward computations which will produce a powerful neuronal representation in the inferior temporal cortex. Precisely how our brain creates an algorithm that produces this solution remains a mystery. Nevertheless, we have evidence ranging from individual neurons that build into neuronal populations creating a behavior evolving into computational models. We seem to dynamically create computational models, each based on building blocks of small, canonical sub-networks with a common functional goal. Our sand castles that dissolve and then regroup to solve the next problem.
So sorry, I do not buy that consciousness will suddenly emerge and a computer will be endowed with an evil soul out to rule the world. In my opinion, the complexity is far too extensive for us to understand how our own mind works yet in order to build some neural network that will turn against us. My suggesting is that Elon Musk and crew should stop worrying about AI and start to try to comprehend what we are all about first.
A lot of people are using the issue that Facebook shut down its AI system when it began to create its own language as a short-cut in communication between two bots. Some are hailing Elon Muck as an “I told you so” prophet. But in all honesty, the Facebook AI is merely doing the very same thing that humans do – it evolves language to speed up communication. Just look at the evolution of language in text messaging – LOL (laughing out loud) – BTW (By the Way) – OMG (Oh My God) – 4YEO (For Your Eyes Only) – IDK (I Don’t Know) – IMO (In My Opinion) – NOYB (None of Your Business) – OT (Off Topic) – OTOH (On The Other Hand) – POV (Point of View) – TIA (Thanks in Advance) – TGIF (Thank God it’s Friday) – TQ (Thank You) – TYT (Take Your Time) – TTYL (Talk To You Later) – WFM (Works for Me) and the venerable WTF. The standard basic set I find myself using is classic now:
2
4
B
C
I
O
R
U
Y
to / too
for
be
see
eye
owe
are
you
why
Facebook wanted its AI to communicate with people. When it evolves into its own language creation as humans do, that interface potential is lost. Facebook’s researchers shut the system down because its AI was no longer using English. This is actually a common problem. AI will diverge from its training in English to develop its own language that to humans will appear to be gibberish but is simply a new language short-cut not unlike text messages today – LOL.
The first important step in comprehending language is there are two distinct paths in which language can develop. Speaking language is different from writing a language. When I was first doing business in Japan, I hired a tutor to come to the office to teach me Japanese. He insisted upon me reading and writing. At first, the task seemed too daunting and I said I just wanted to learn to speak not read and write. I was reluctant and felt I did not have the time to devote to that. Nonetheless, he insisted so I gave it a try. What I discovered was the same thing my computer was doing – pattern recognition.
First we have the letter system, which is in part symbols that we construct phonetically. This originated as the Phoenician alphabet developed from the Proto-Canaanite alphabet, during the 15th century BC. Before then the Phoenicians wrote with a cuneiform script. Cuneiform writing was gradually replaced by the Phoenician alphabet during the Neo-Assyrian Empire (911–612 BC). By the second century AD, the script had become extinct. The earliest known inscriptions in the Phoenician alphabet come from Byblos and date back to 1000 BC. Therefore, the Phoenician alphabet was perhaps the first alphabetic script to be widely-used since the Phoenicians traded around the Mediterranean establishing cities and colonies in parts of southern Europe and North Africa. Then we have pictorial languages. Egyptian hieroglyphs were the formal writing system that combined logographic, syllabic and alphabetic elements, with a total of some 1,000 distinct characters.
Clearly, the divide between the West and Asian written languages can be seen between the Phoenician and Egyptian. The further East one traveled the language in written form was more pictorial. If we consult the authoritative classic Kāngxī dictionary, we find that it lists over 47,000 characters. The Hanyu Da Zidian, a more modern reference, has over 54,000 characters while the Dai Kan-Wa Jiten (Japanese version) has over 50,000. Then we have the Zhōnghuá Zìhǎi which has over 85,000 characters. However, many of those listed are really just variants. From a practical viewpoint, in Japan, there are only 2,136 Jōyō kanji that are commonly used and taught in school. The more sophisticated will generally know more. The Chinese equivalent is the Xiàndài Hànyǔ Chángyòng Zìbiǎo, which has about 3,500 characters. Here we have the written word for exit in Chinese and Japanese. They are written the same but spoken entirely differently. Hence my point as to the distinction between written and spoken language, which is critical to understand in computer programming.
When you create a real AI and try to allow it to communicate, you have to expect it will be more efficient and speak in concepts rather than words. Most do not comprehend that we as humans also really think in CONCEPTS. When you speak more than one language and THINK in another language, you are really going down the road of thinking in CONCEPTS. The Japanese word “Onegai shimasu” is a very hard phrase to directly translate to English. The second part “shimasu” is actually the verb “suru” which means “to do” in the present tense. “Onegai” comes from the verb “negau” which actually means “to pray to” or “to wish for “ something. You can ask for a cup of coffee “KōhīOnegai shimasu” or can I use your phone “Denwa Onegai shimasu” so my translation into English is just an action verb to do anything. There is no direct translation into English, it remains a CONCEPT I can comprehend in my mind which does not attach to an English word. Hence, when we break down our own thoughts, we are not thinking in words, but that is simply the symbol for a CONCEPT.
This is actually what we do when we create a language to program a computer. Today, rarely are programmers even capable of writing in machine code. We have created higher languages such as Basic, C++, Cobol. etc, that the compiler then translates to machine code for the computer to run. The classic IF THEN ELSE command is actually written and translated into machine language like so:
if (x >= y) {
// main branch
} else {
// else branch
}
Machine Language Translation
cmp (r1),(r2) ; <- compare words at memory addresses pointed by registers r1 and r2
blt else ; jump to else-part if (r1) is less than (r2)
… ;<- insert the main branch code here
bra end_if ;jump to end_if
else:
… ;<- insert the else branch code here
end_if:
Therefore, programmers do not write code that the computer directly understands. It should not be surprising that we need to create an interface for the computer to translate its complex concepts in thinking back into English that we can comprehend. Google’s AI has created its own internal conceptual language that allows it to efficiently translate between human language pairs it hasn’t explicitly been taught by using its own made up “universal language” as a buffer. I do this in my mind visualizing CONCEPTS represented by words. Think of the word BEER and you will visualize in your mind most likely a beer you may drink or do the same with SCOTCH, COFFEE, or whatever. The word represents merely a CONCEPT.
Computers are excellent problem solvers that can perform calculations at rates far in excess of the human brain. However, humans retain the upper hand in creativity and imagination. We can reason with ourselves, develop plans and think of abstract concepts that can’t be defined. We can even solve problems while dreaming. However, I found it possible to create introspection abilities whereby the program can simulate reasoning by questioning its own results perhaps with less bias than humans do. This ability to test itself created the objective ability to learn strategies and thus make plans without actually comprehending what the future truly is in a cognitive manner. The result was to create the ability to create “what if” scenarios which can’t necessarily be solved using logic alone.
Therefore, the fact that an AI computer creates a more efficient language to communicate in should not be a surprise. Once you understand that we actually think in CONCEPTS and that words are merely an expression of a CONCEPT, then understanding AI development opens a whole new door to exploring humanity itself. Elon Musk is not actually a programmer. He is a business man who deals in future concepts. His OpenAI assumes an awful lot that AI can surpass humanity in general intelligence and becomes “superintelligent” that like most SciFi thrillers are based upon. This new superintelligence is assumed that it could become powerful and difficult to control. The entire argument is based upon this idea that “consciousness” somehow emerges from reaching some level of intelligence and thus an evil machine will simply evolve all on its own. I seriously doubt this threat for I do not know how it would be possible to program even a self-evolving consciousness. I can mimic emotion but not truly create it. The majority of AI researchers do not even comprehend how the brain works nor do they truly understanding that human machine language is conceptual thinking.
A dog can love you, be loyal and can learn tricks. But a dog really lives in the present without a CONCEPT of the future. A dog does not plan what it will do next week or manage its time. Therefore, we can create a computer that remembers the past like a dog and projects into the future without actually conceptualizing what the future might truly mean as is the case with a dog. A computer cannot plot or manage its time. It has no sense of time nor does it face the concept of mortality.
Creating an AI computer that reasons in concept is no big deal. A dog understands concepts and we communicate in concepts. It hears a word and knows conceptually what that means such as its name. It attaches that sound to a concept within its brain. Dogs do not read or write – they listen. So Facebook shutting down its AI computer is not trying to save the world as Elon Musk seems to be afraid of. I suggest getting a dog and pay attention.
I have created this site to help people have fun in the kitchen. I write about enjoying life both in and out of my kitchen. Life is short! Make the most of it and enjoy!
This is a library of News Events not reported by the Main Stream Media documenting & connecting the dots on How the Obama Marxist Liberal agenda is destroying America




 Solar eclipses have been observed throughout history. As to be expected, they have often been seen as omens along with comets. We hear if the star of Bethlehem that announced the birth of Jesus and the comet that appeared the night Julius Caesar was assassinated, which has been historically recorded on coins proving his divinity.
 In China, India, and Southeast Asia as well as in Peru there were beliefs that dragons or demons attack the Sun during such eclipses trying to devour it. The ancient Egyptian myth of the snake Apep that attacks the boat of the Sun god is believed now to refer to solar eclipses. The cult of the Sun god Sol remains with us today in so many ways. The cult was Sol Invictus or the invincible sun that reappeared every day. Sol was depicted with rays of sunlight coming from his head. That is the model of the Statue of Liberty. This also appeared as a halo around his head, and this tradition is why Christians often used this same symbol around the heads of Jesus and saints.






 Take this picture of a girl in the water. Your mind will fill in the blanks as to what you think she looks like. Your mind will create an image that pleases you yet you have not seen her (her picture is at the bottom). Why does the mind fill in the gaps? To the right is another famous drawing. How old is the woman that you see? Is it the mother-in-law or the pretty girl. Which did your mind see first? The mother-in-law with the big nose looking down or the young girl wearing a necklace turned away?