Chicago Still Getting Snow


Chicago still just got 2.5 inches of snow cancelling numerous flights. Snowing this late in the season is concerning on our models. As I have warned, the winters will get longer and the summers shorter. This can cause severe reduction in the production of food in the years ahead. The snow over the weekend at Chicago O’Hare International Airport broke the record for the date of 0.2 of an inch set in 1950

100% Reliable Climate Predictions


Published on Apr 27, 2019

SUBSCRIBE 20K
Climate models have done a terrible job predicting climate. But one thing which is extremely predictable is that data will be tampered with to create warming where there is none. Links here : https://realclimatescience.com/2019/0…


Why Has Global Warming Paused? – William Happer


Published on Feb 23, 2016

SUBSCRIBE 31K
William Happer Princeton University September 27, 2013 More videos on http://video.ias.edu

Dr. William Happer, Ph.D., Keynote 3, ICCC10


Published on Jul 2, 2015

SUBSCRIBE 13K
William Happer, Ph.D., accepts the 2015 Frederick Seitz Memorial Award from S. Fred Singer of the Science and Environmental Policy Project (SEPP) and gives the Dinner Keynote at The Heartland Institute’s Tenth International Conference on Climate Change on June 11, 2015. To watch all presentations from this conference and others, visit ClimateConferences.Heartland.org


Princeton Physics Professor Discredits Anthropogenic Climate Change Theory


Published on Jan 3, 2017

SUBSCRIBE 5.5K
Physics Professor William Happer discredits the negative effects of CO2 on the planet and whether or not climate change is man-made. He also goes into detail of why the United Nation’s models are incorrect despite their overwhelming confidence that significant warming is taking place due to human activity. *The views expressed by the interviewee(s) in this video do not necessarily reflect the views of The New American or any of its affiliates.* More news at: http://www.thenewamerican.com/ Facebook: http://www.facebook.com/TheNewAmerican Twitter: https://twitter.com/NewAmericanMag

NYC Bans Hot Dogs Adopting New Green Deal


OK. New York City can’t pay its bills and politicians think chasing Amazon out of town because they wanted a $3 billion tax break actually saved $3 billion when that was predicated on them paying some taxes, has now moved to ban hot dogs to save the environment? Mayor Bill de Blasio approved a complete insane $14 billion Green New Deal on Monday, April 22, to combat climate change. He has ordered cuts in purchases of red meat by 50% in its city-controlled facilities such as schools, hospitals, and prisons. What they don’t tell you is the Fed feed inmates meat that is marked “NOT FIT FOR HUMAN CONSUMPTION”because the FDA compel producers to send a portion of every lot of food for testing. However, the FDA may test one box and the rest goes to prisoners to reduce costs.

Mayor de Blasio has also declared he wants Meatless Mondays in all NYC schools. He publicly stated: “It is a difficult plan. It is a necessary plan…. Estimates that tell us that we have only 12 years to get it right. Let’s be clear, we have until 2030 to change things fundamentally, or our lives won’t be the same.” So banning hot dogs will now stop Global Warming or else we will all die in 12 years.

NYC is running a deficit so Mayor de Blasio’s administration spends more than it takes in and he forgets he is not the federal government. Raising taxes has only resulted in a mass migration from NYC and when interest rates diverge and begin to rise for the peripheral sovereign markets such as state and municipal governments, NYC may go off the edge once again. Many analysts are concerned about his deficit spending. In February 1975, New York City entered a serious fiscal crisis. Under mayor Abraham Beame, the city had run out of money to pay for normal operating expenses. It was unable to borrow more due to the hard times and faced the prospect of defaulting on its obligations led it into declaring bankruptcy. It took just 43 years (86/2) to return to the same position of deficit spending. The New Green Deal is really absurd. It demonstrates he is living in a fantasy world where he sees deficit spending without end as no problem. After all, federal governments all do that with no problem. The different is, they have the power to create more money – Mayor de Blasiodoes not.

Still Snowing in the Heart of America – The Longer Winter & Shorter Summer Cycle


COMMENT: Well you said this winter would be long and the summer shorter. It is still snowing herein the heart of America. It looks like your computer is correct again. Instead of funding research for billion dollars to pretend there is global warming, they should just subscribe to Socrates. Would save a heap of money.

RG

REPLY: Of course you are right. However, the hand out billion grants so they can get studies to justify raising taxes to bring in $100 billion. They are not interested in the actual reliable forecast. There is no juice in that for them. They want more revenue. Unfortunately, if this summer is also short and winter returns rapidly in the fall, buy some electric-underwear. We are in for colder periods ahead into 2024.

A More Sophisticated Version Of AOC


A Technical Study in the Relationships of Solar Flux, Water, Carbon Dioxide and Global Temperatures, March 2019


From the attached report on climate change for March 2019 we have the two charts showing how much has the global temperature actually gone up since we started to measure CO2 in the atmosphere? To show this graphically Chart 8 was constructed by plotting CO2 as a percent increase from when it was first measured in 1958, the Black plot, the scale is on the left and it shows CO2 going up about 30.0% from 1958 to February of 2019. That is a very large change as anyone would have to agree.  Now how about temperature, well when we look at the percentage change in temperature from 1958, using Kelvin (which does measure the change in heat), we find that the changes in global temperature (heat) are almost un-measurable. The scale on the right side had to be expanded 10 times (the range is 40 % on the left and 4% on the right) to be able to see the plot in the same chart in any detail. The red plot, starting in 1958, shows that the thermal energy in the earth’s atmosphere increased by .30%; while CO2 has increased by 30.0% which is 100 times that of the increase in temperature. So is there really a meaningful link between them that would give as a major problem? The numbers tell us no there isn’t.

The next chart is Chart 8a which is the same as Chart 8 except for the scales which are the same for both CO2 and Temperature. As you see the increase in energy, heat, is not visually observably in this chart hence the need for the previous chart 8 to show the minuscule increase in thermal energy shown by NASA in relationship to the change in CO2. Based to these trends, determined by excel not me, in 2028 CO2 will be 428 ppm and temperatures will be 15.0o Celsius and in 2038 CO2 will be 458 ppm and temperatures will be 15.6O Celsius. This is what the data shows no matter what the reasons are, so I have no idea how the IPCC gets to predict that the world will end in ten or twenty years.

The full 37 page report explains how these charts were developed and why using NASA and NOAA data are used with out change to prove that The New Green Deal is not required and any attempt to compliment that plan will be a world wide disaster.

Click on the link below for the full report that you can download.

BLACKBODY TEMPERATURE 2019-03

Study of the Blackbody Temperature of Earth, Written first in 2017 update monthly


The purpose for this paper

This paper is not meant to be a peer-reviewed work; but it is meant to give a foundation for a more serious study of the subject matter presented here which is of determining the basis of developing a global temperature. The key is the base which what is the base temperature of the planet and, of course, it is  the solar radiation received from the sun. Therefore, the energy absorbed by the planet must equal the energy emitted by the planet and we can calculate this using the Stefan-Boltzmann Law the the result is called the blackbody temperature. The energy flux emitted by a blackbody is related to the fourth power of the body’s absolute temperature. In the case of the earth use means and averages that temperature is -18.8 degrees Celsius but wait the current temperature around 14.6 degrees Celsius today that is a difference of 33.4 degrees Celsius; where did that come from. The answer is that is the greenhouse effect. and at least 85% of that is form the water in the atmosphere making water the primary green house gas by far.

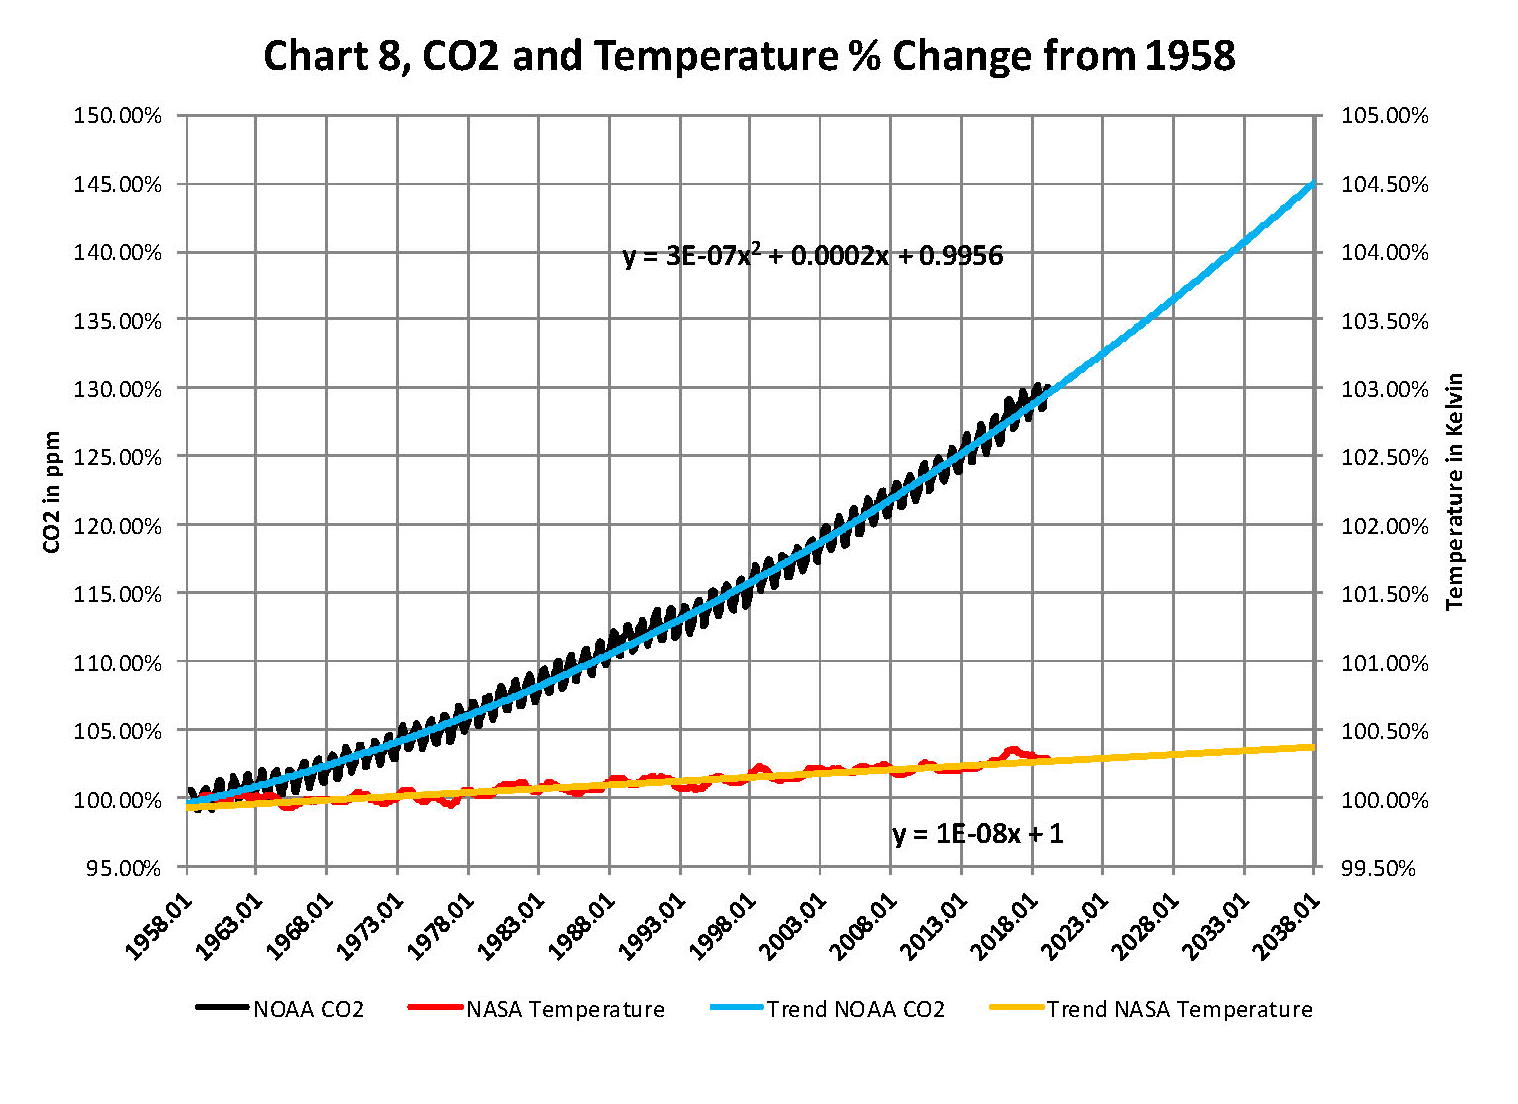
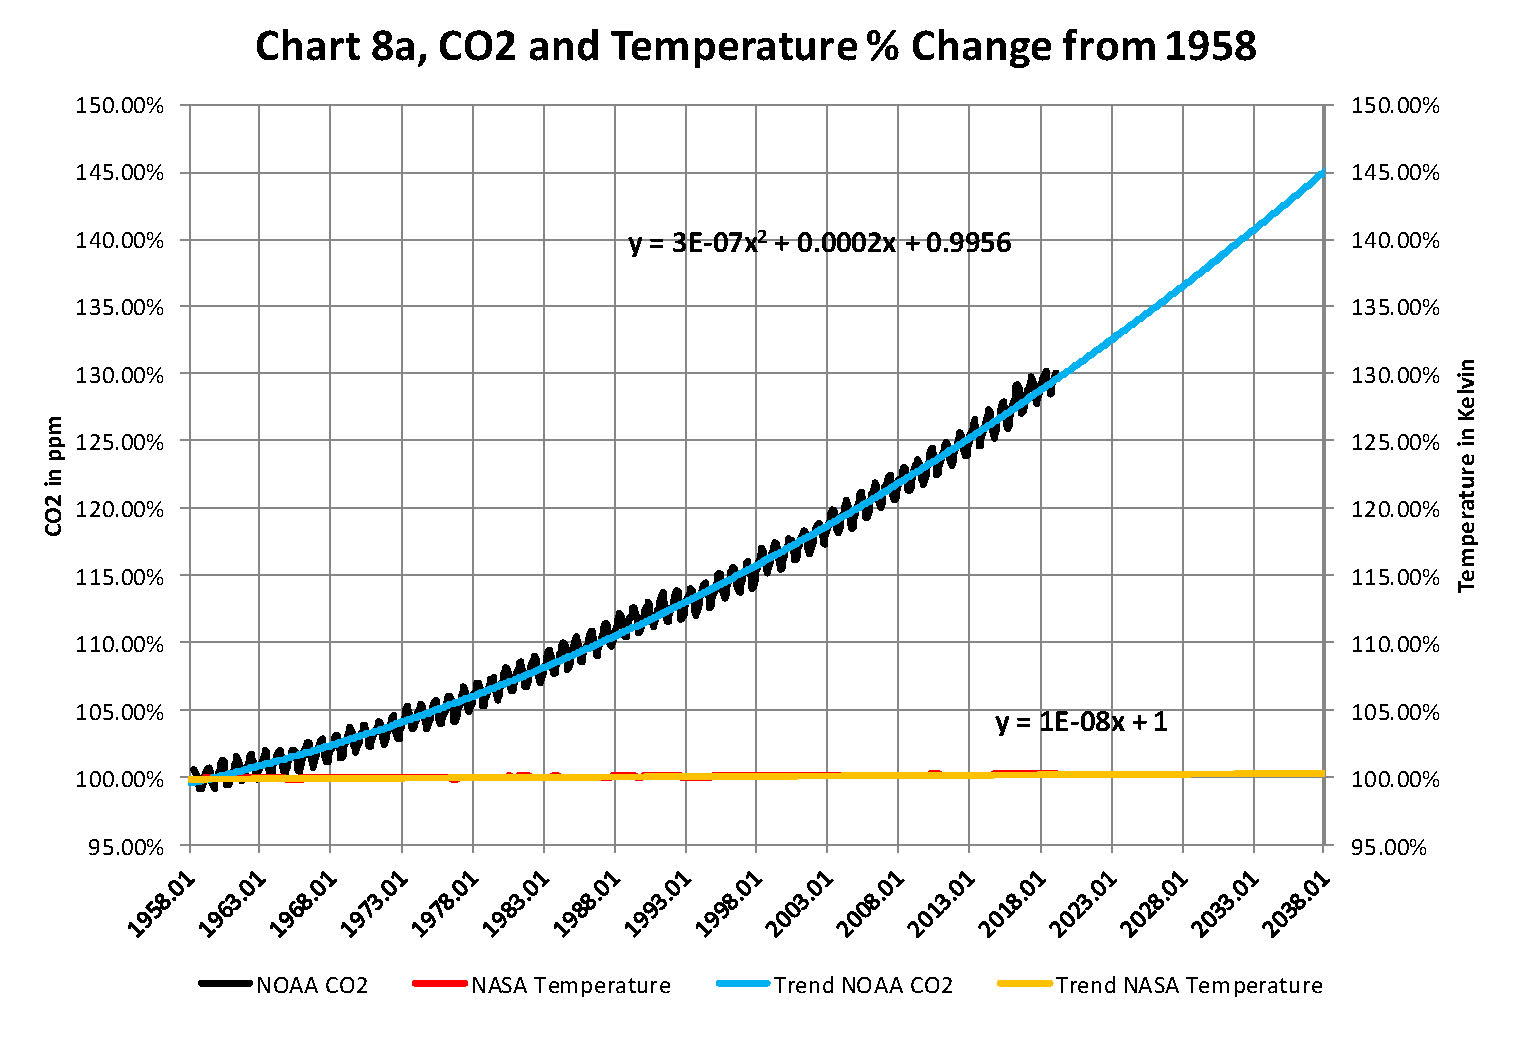
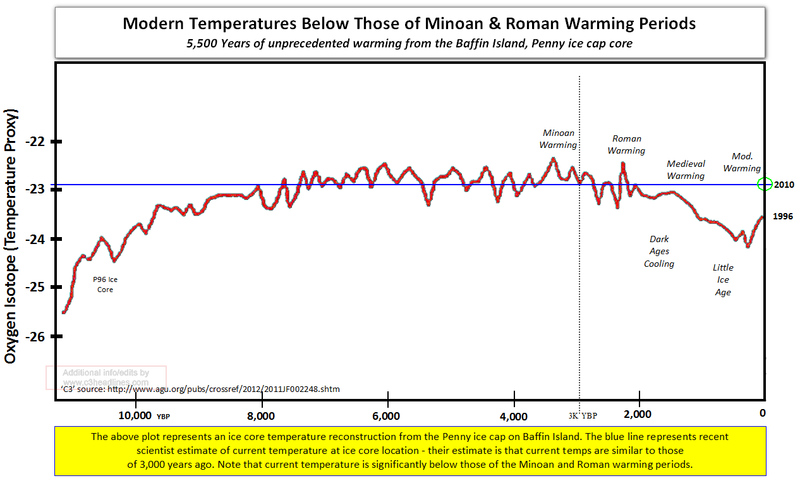
This paper has been written to show the read the basics of the science of determining the key variables that make up earth the temperature. What you will find is that the planet has been very stable over time and that its currently much cooler than it ever has been.  The following chart is developed from ice core and is onlyu one of many that show the same thing.

There are three areas of interest.

1) The amount of thermal energy that reaches the planet from the sun.
2) The amount of thermal energy that is initially absorbed by the planet.
3) The process on the planet that ‘temporarily’ holds thermal energy on the planet.

In this paper I will give a frame work for determining all three aspects.

Part One, the blackbody temperature of the planet
Part Two, the planetary greenhouse effect
Part Three, the probable range of temperatures on the planet

Appendix

NASA Table Land Ocean Temperature Index (LOTI) April 2008
NASA Table Land Ocean Temperature Index (LOTI) current to the date of this paper

The link below will allow you to download the paper, if you want, and at no cost.

BLACKBODY TEMPERATURE PAPER