When Did Global Warming Theory Begin?


Back in 1967, the International Global Atmospheric Research Program was established, mainly to gather data for better short-range weather prediction, but included climate. The following year, this was the beginning of biased studies which suggested that a possibility of a collapse of the Antarctic ice sheets would raise sea levels catastrophically. They put forth the idea that a big enough rise in global temperatures would eventually melt the world’s glaciers. They then pointed to a retreat of mountain glaciers since the 19th century claiming this was very apparent in many regions. This trend, they argued with linear logic, would release enough water to raise the sea level a bit. They argued that starting during the 1960s, several glacier experts warned that part of the Antarctic ice sheet seemed unstable. If the huge mass slid into the ocean, which did not happen, the sea-level rise would wreak great harm, perhaps within the next century or two. They completely failed to point out that there had historically been cycles in climate and even the poles were not at the same location but have flipped and moved about the Earth.

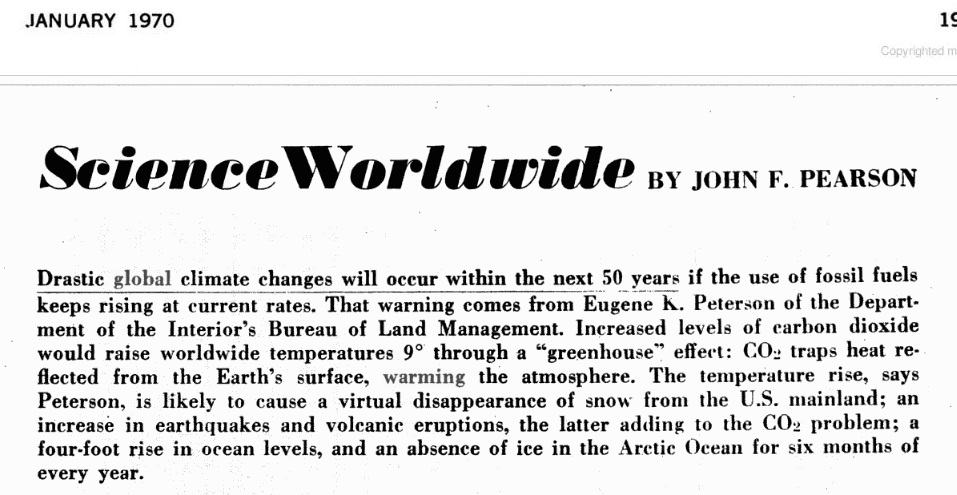
We find one of the early articles that predicted the average temperature would be 9 degrees hotter by now appeared in 1970. The publication was Popular Mechanics back in January 1970. The analysis was very seriously flawed as always because they take whatever trend is in motion and project it out without end. They completely fail to comprehend that there is any cycle within anything. This is the greatest trap in forecasting. The entire Global Warming trend has been created with this very dangerous and stupid method of linear forecasting.

All of these forecasts are indistinguishable from looking at the Dow Jones Industrials and observing it has risen 5% per year since 2009 and therefore, it will never correct once again and it will continue to advance by 5% every year into the endless future. This type of analysis simply does not qualify as any valid method of analysis by taking whatever trend is in motion and forecasting it will never end. That analysis was set in motion following 1967.

We have run our models on this movement of blaming humans for climate change. Unfortunately, this crazy analysis will not reach its peak until 2032. Governments will continue to embrace it as an excuse to raise taxes. So it looks like as government needs money, they do not care about the environment. They will use this climate change as the excuse to impose new types of taxes as if lining their pockets with other people’s money will save the planet – it is only to save their power.


Under Water Wonder of the World


COMMENT: Hello Martin and Friends,

I recently found this article about an ancient Indian burial ground found off the coast of Venice, Florida. It’s 7,000 years old.

This is another piece of evidence suggesting that rising ocean waters are not a modern phenomenon and a cyclical event like you suggested.

Have a nice day,

R

Dallas

ANSWER: Oh yes. There are the Seven Wonders of the Undersea World. One of the more spectacular sunken cities is that in China, the ancient city, which is hidden 130 feet underwater. This is popularly known as the Lion City, which was once Shi Cheng – the center of politics and economics in the eastern province of Zhejiang.

There is the ancient city of Alexandria in Egypt which is also under water. Then there are the ancient roadways underwater off the coast of Bermuda. There are numerous examples of sunken cities.

There is the ancient Etruscan city of Spina, which also sunk. There are many Italians with the name of Spina which refer to their original origin. Spina was an Etruscan port city, established by the end of the 6th century BC. It was a lost city until 1922 when it was discovered when drainage schemes in the delta of the Po River were carried out. This is the same lagoon that eventually became the location of Venice. Spina was a major international trade center whose main trading partner was Athens. For almost two thousand years the city laid forgotten under the mud of the Po lagoon. The excavations have thus brought to light an impressive wetland settlement, with regular Greek-style urban planning, including rectangular blocks and houses, entirely realized with timber and logs much as we see in Venice itself. Obviously, the technology dates back much further than most suspected. The ancient city of Spina was known for its trade, but it sank below the water and its location became lost. Today, they blame the sinking of Venice on Global Warming without ever mentioning that the previous city had sunk as well without Global Warming caused by humans.

The Etruscans lost power with the revolution in Rome and the beginning of the Roman Republic in 509BC which rejected the Etruscan kings. Then soon afterward, the Etruscan naval supremacy also collapsed when the ships of the ambitious Hieron I of Syracuse inflicted a devastating loss on their fleet off Cumae in 474 BC. This was the final blow to the Etruscan cities of Campania. The name Spina is found in Sicily, for it is clear that most inhabitants of Spina appear to have migrated to Sicily following their defeat by Hieron I.


“Ice Age Conundrum: Factors Contributing…” w/ Cogent Randall Carlson in the Classroom


Catastrophe at 12,900 BP (excerpt from Cosmic Grail series) w/ Randall Carlson (2015)


“IceAge Shift:10,000-yr Collection of Clues to decode a Holocene Mystery” w/ Randall Carlson (2008)


Visit http://awarestate.com/exclusive to receive direct email announcements about new articles, books, classes, online appearances, videos, etc… In Randall’s engaging circuitous speaking style, he loops around linking various fascinating factors to foster comprehension of real, natural, sudden and serious climatic shifts, including: how the ‘Little Ice Age’ gave clues that there was a ‘Big’ ice age; that catastrophic events tend to erase evidence of prior catastrophes; the difficulties with explaining glacial/inter-glacial cycles; the message of the Greenland ice cores; societies that don’t adapt go extinct like during the literally ‘Dark’ Ages; the ‘Titanic Effect’ and preparing for the inevitable next catastrophe; what effect the entire nuclear arsenal would have on Antarctica; the unresolved ‘Energy Paradox’ and other simultaneous shifts that comprise the ‘Holocene Mystery’

A Funny Thing Happened on the Way to Global Warming


Steven F. Hayward, Pepperdine University This lecture is part of Hillsdale College’s 2014 CCA series. To learn more about Hillsdale College and the CCA programs, visit http://www.hillsdale.edu/outreach/cca

25 NASA Scientists Question ‘Man-Made Global Warming’


Here we see four former NASA scientists trash the global warming hysteria. Dr Hal Doiron Leighton Steward Tom Wysmuller Walter Cunningham Back in the days when NASA was a genuine scientific organisation, and did real science, such as moon trips, these four men worked there.They represent a group of 25 former NASA scientists / astronauts, who now run the climate realist website; http://www.therightclimatestuff.com/ and wrote this report for policy-makers in 2013; Doiron, H. H. (2014). BOUNDING GHG CLIMATE SENSITIVITY FOR USE IN REGULATORY DECISIONS. It can be found here; https://wattsupwiththat.files.wordpre… Using data and logic, here they throw cold water on the hysterical CO2 fanatics who are crying and whining about the coming fictitious ‘climate catastrophe’. The 25 former NASA scientists also sent the incoming President, Donald Trump, this report on climate science in November, 2016; http://nebula.wsimg.com/1ca304a328496…

California Counties Suing Exxon Commit Securities Fraud?


The Global Warming Conspiracy is desperately trying to destroy the world and end modern society as we know it. Of course, it is California countries who have argued in court bring a lawsuit against Exxon claiming that by 2050, their towns will be destroyed and under water. Exxon has pointed out that they have no problem selling $8 billion worth of debt.

San Mateo’s 2014 and 2016 bond offerings represented to investors that the county “is unable to predict whether sea-level rise or other impacts of climate change or flooding from a major storm will occur.”

When selling debt, they say there is no definitive risk and yet when they are trying to sue for more money they state they will be wiped off the planet and thus that is Securities Fraud.

These lawsuits are getting out of control. Congress need immediately to change the law that loser pays all legal fees racked up by their opponent. These lawsuits are frivolous and highly dangerous. The oil industry should shut down all gasoline stations in any county, city, or municipality that files such a suit. Then we will see the people throw out these greedy politicians in a matter of days.

California, which lacks public transport, should be shut down immediately. All energy companies should suspend all sales of all fossil fuels in California INSTANTLY. That is the only way to show how this nonsense will impact society. STOP selling all fuel in California until the people throw these greedy politicians out of office.

Definitive Prove That CO2 Will Not Harm the Planet


The title to this post is !00% true despite what anyone can or will say and it’s actually very easy to prove. Chart 8 below, from another paper, shows this in a simple easy to understand Chart. Chart 8 was constructed by plotting CO2 as a percentage increase from when it was first measured in 1958 the Black plot, the scale is on the left and it shows CO2 going up about 28.5% by January of 2018. That is a large change as anyone would agree. This chart was creating using the exact values as shown on The NOAA-ESRL website which showed CO2 at 407.98 PPM for January 2018. No changes were made to the raw CO2 numbers. The blue trace shows the trend line of CO2 and the equation for the trace is also shown. By the end of 2018 CO2 will be 30% higher then it was in 1958 when the first reading were taken. So this is a hard fact.

Now how about temperature, well a global temperature is an abstraction since we have the north and south poles which are almost always frozen and receive almost no energy from the sun and then we have the equatorial region which is either steaming jungle or uninhabitable desert and which receives the bulk of the energy from the sun.  Add to that, that only half the planet receives the energy from the sun while the other half is always in the dark. So even though there really is not one global temperature NASS-GISS has found a way to create one though very complex algorithms which they call Homogenization and they publish that value every month in their Land Ocean Temperature Index (LOTI) table. The value for January 2018 was 14.78 degrees Celsius; although they show it as a deviation from a base of 14.0 or 78, its not my system.

Because of the Homogenization process, itself, there is a large monthly swing in temperature so I use a 12 month moving average to minimize the sometimes wild swings in the numbers. Then to measure the heat content of the atmosphere we have to convert Celsius (C) to Kelvin (K); engineers and scientists will under stand this and it is required to get a absolute value not a relative one. With that done we can make a plot of the change in heat in the atmosphere as a percentage change from 1958 so we can match the global temperature to the increase in CO2.

When we look at the percentage change in temperature using the proper units Kelvin we find that the changes in global temperatures are almost un-measurable. The temperature red plot, also starting in 1958, shows that the thermal energy in the earth’s atmosphere has varied by less than +/- .17%; while CO2 has increased by 28.5% which is over 80 times that of increase in temperature. So is there really a problem here? The yellow trace is a linear trend line of the global temperature in K and the equation for it is also shown.

In summary we have in Chart 8  shown why large increases in CO2 are not increasing the temperature of the planet by any meaningful amount. The problem, intentional or not, goes back to physics and how we show information. It’s critical that when we talk to non scientists that information is properly displayed. And nowhere is this more important than when we are discussing temperature.  When we talk about weather and local temperatures its going be in Celsius (C) in the EU or degrees Fahrenheit (F) in America e.g. for the base temperature that NASA uses it’s 14.00 C or 57.20 F; but these are both relative measures and do not tell us how much heat (thermal energy) is there. To know that we must use Kelvin (K) and that would be 287.150 K and all three of those numbers 14.00 C, 57.20 F, and 287.150 K are exactly the same temperature, just using a different base. But if the current temperature is 15.00 C that is a 7.1% increase in C, a 3.1% increase in F and a .35% increase in K; so which one is real? The answer is .35% because Kelvin is the only one that actually measures the total energy!

Lastly, it is critical that the reader understand that CO2 IS NOT A POLLUTANT!!!! It is a requirement for life to exist on the planet and more is good not bad. CO2 levels would actually be better if they were twice to three times what they are now as plants would grow faster and bigger. Further, by some crazy means we actually reduced CO2 to much below half of where it is now we would start killing off all the plants on the planet and with no plants there are no animals including humans so be very careful in what you actually do with what you think you know!

Passion of purpose does not constitute correctness of thought!


Climate Change Conspiracy Against us All


800,000-year Ice-Core Records of Atmospheric Carbon Dioxide (CO2)

QUESTION: Are you saying that CO2 is not a pollutant and we should not be concerned about rising levels?

OD

ANSWER: Correct. CO2 levels have been much higher than currently over the millennia. The Global Warming crowd has an agenda and the core of that is to reduce the population. They remain influenced by the Malthus theory and have been hell-bent on stopping population growth.

Over the past 100 million years, we have been in a decline in CO2 level dropping from 500 ppm to 200 ppm with an average of about 300 ppm. They refuse to address any of the historical evidence no less the cycle of life itself.

Humans exhale typically consists of 40,000 ppm to even 50,000 ppm of CO2. Should we be fined or extinguished because we are a major contributor to COs levels? Those who are demonizing CO2 as a “pollutant” fail to explain that in a room filled with people CO2 levels can commonly reach 2000 ppm with no apparent ill effects. Even the US Navy sets its limit for CO2 in submarines at 5000 ppm to avoid any measurable effect on sailors. NASA also sets similar limits for humans in spacecraft at the same basic level.

If you measure CO2 level where crops are growing or in a rain forest, they drop drastically because the plants suck it up for that is what they thrive on to live. If you want to lower CO2, then plant more crops and trees.

Thomas Malthus (1766-1834) had predicted that we would run out of food which started this entire theory about curtailing population growth which is really behind the whole Global Warming movement. In his 1798 book An Essay on the Principle of Population, Malthus observed that an increase in a nation’s food production improved the well-being of the populace. However, the improvement was temporary because it led to population growth, which in turn restored the original per capita production level.

In other words, mankind had a propensity to utilize food abundance for population growth rather than for maintaining a high standard of living, Malthus saw this as the doom of humanity.

The flaw in Malthus’ work is the same in the Global Warming crowd. They are completely ignorant of a cycle and take whatever trend they see and project that it will linearly continue to the end.

Food Supply & Population

There have been countless investigations into the food supply and the population growth of animals. What has been revealed is that as food supply declines, so does the birth rate. Malthus’ observation that an increase in food supply led to an increase in population was correct, but only one side of the cycle. The Global Warming crowd ignores the fact that CO2 levels used to be measured in thousands of ppm instead of hundreds. In fact, the temperature does not even correlate very well with CO2 levels. During ice ages in the Ordovician period, some 450 million years ago, when the CO2 levels were several thousand of ppm this did not result in temperatures 10 times greater than today.


  •  P.C. Quinton and K.G. MacLeod, “Oxygen isotopes from conodont apatite of the midcontinent US: Implications for Late Ordovician climate evolution,” Palaeogeography, Palaeoclimatology, Palaeoecology, 2014, 404: 57–66.