Climate Change & Democrats Refuse to Vote


Despite all the outrageous rhetoric from AOC and her New Green Deal, Majority Leader Mitch McConnell brought the Green New Deal resolution up for a vote without any hearings after a brief floor debate. He wanted the world to see that shutting down all air transportation and ending anything with fossil fuels would not go well with the American people. So McConnell gave the Democrats in the Senate their chance to show the world just how extreme they have become.

Yes, McConnell wanted to allow the Democrats to show everyone their agenda as environmental radicals. The Democrats blinked and voted “present, so they refused to go on record for this New Green Deal that would have no doubt been used in 2020 against them. However, with this stunt, they are claiming that they can be for it or against it since they refused to vote. How will a voter even know what they stand for? Do you vote for a person who then wants to end all air travel? One would think that is a fairly radical proposal that warrants a clear response.

A Technical Study in the Relationships of Solar Flux, Water, Carbon Dioxide and Global Temperatures, February 2019


From the attached report on climate change for February 2019 we have the two charts showing how much has the global temperature actually gone up since we started to measure CO2 in the atmosphere? To show this graphically Chart 8 was constructed by plotting CO2 as a percent increase from when it was first measured in 1958, the Black plot, the scale is on the left and it shows CO2 going up about 30.0% from 1958 to February of 2019. That is a very large change as anyone would have to agree.  Now how about temperature, well when we look at the percentage change in temperature from 1958, using Kelvin (which does measure the change in heat), we find that the changes in global temperature (heat) are almost un-measurable. The scale on the right side had to be expanded 10 times (the range is 40 % on the left and 4% on the right) to be able to see the plot in the same chart in any detail. The red plot, starting in 1958, shows that the thermal energy in the earth’s atmosphere increased by .30%; while CO2 has increased by 30.0% which is 100 times that of the increase in temperature. So is there really a meaningful link between them that would give as a major problem? The numbers tell us no there isn’t.

The next chart is Chart 8a which is the same as Chart 8 except for the scales which are the same for both CO2 and Temperature. As you see the increase in energy, heat, is not visually observably in this chart hence the need for the previous chart 8 to show the minuscule increase in thermal energy shown by NASA in relationship to the change in CO2. Based to these trends, determined by excel not me, in 2028 CO2 will be 428 ppm and temperatures will be 15.0o Celsius and in 2038 CO2 will be 458 ppm and temperatures will be 15.6O Celsius. This is what the data shows no matter what the reasons are, so I have no idea how the IPCC gets to predict that the world will end in ten or twenty years.

The full 37 page report explains how these charts were developed and why using NASA and NOAA data are used with out change to prove that The New Green Deal is not required and any attempt to compliment that plan will be a world wide disaster.

Click on the link below for the full report that you can download.

BLACKBODY TEMPERATURE

Greenland Glacier has been Growing for the past 2 years & it will Probably end up 3 for 3 when this season ends


COMMENT: Mr. Armstrong; It is clear that your computer is really amazing. I was just ready how the Greenland Glacier is expanding, not melting. What you have accomplished by seeking to eliminate yourself is really a major contribution to society.

Job well done, sir.

PH

REPLY: Thank you. A number of people have read the same article and have been sending it in. I would like to also thank all the people who have dome sone and your comments. It is so important to eliminate bias. I moved to Florida trying to find Global Warming. To me, it is just stunning how people do not understand that everything has a cycle from weather to why we must eventually die. The Greenland glacier 2012 was retreating about 1.8 miles back in 2012 annually. However, as the climate has been getting colder nor for the third year, interestingly enough, the Greenland Glacier has begun to grow in mass once again.

This is NOT a forecast I want to see happen. I hate cold. So I do not enjoy even having to say see I told you so. Wish I was wrong on this one.

World In Midst of Carbon Drought (w/ Prof. William Happer, Princeton University)


SUBSCRIBE 1.9K
We’re in a carbon drought. That is according to Professor William Happer of Princeton University. The renowned physicist says when it comes to carbon dioxide, there’s more good than bad. He goes on to say most of carbon dioxide’s effect has already happened. He points to the logarithmic dependence of temperature on carbon dioxide levels. Happer says the unique properties of carbon dioxide mean that current levels would need to double for another one-degree increase in temperature and they’d have to double again for another one degree rise.

Princeton physicist: There’s a ‘cult’ building around climate scientists


Published on Feb 17, 2017

SUBSCRIBE 506K
Princeton physics professor William Happer explains why he describes some climate change scientists as a ‘cult.’


Climate Change, Midwest Floods & Food Shortages


The Great Flood of 1927, flooded the lower Mississippi River valley in April 1927.  It was one of the worst natural disasters in American history. More than 23,000 square miles of land was submerged, hundreds of thousands of people were displaced, and around 250 people died. The flooding impacted areas in Arkansas, Illinois, Kentucky, Louisiana, Mississippi, Missouri, Tennessee, Texas, Oklahoma, and Kansas.

Following that Great Flood of 1927, we then see the climate swing dramatically in the opposite direction into the extreme drought that led to the Dust Bowl of the 1930s. The Dust Bowl was a period of severe dust storms that greatly damaged agriculture in the Midwest prairies during the 1930s. The Dust Bowl was a severe drought that came in three primary waves, 1934, 1936, and 1939–1940. The entire event actually complied with our Economic Confidence Model when many regions of the high plains experienced drought conditions for eight years.

Unfortunately, the global warming people are already out in force and blaming this on moms driving the kids to soccer matches. They always pretend these are catastrophic events never before seen. Cars were not really in wide use until post-1940s. They could care less about history or truth. The cycle is very clear. This major flooding which may destroy at least 6 billion bushels of wheat is a prelude to what is coming.

Long before there was the Global Warming crowd, there were the record-setting heat waves and drought of the 1930s that contributed to the Great Depression and wiping out agriculture that was employing 40% of the civil workforce at the start of the century. There were runs of extreme temperatures which broke all records. There was a stretch of 11 days straight in July with temperatures over 100. The two worst years were 1930 and 1936.

Today, they would be demanding action and 11 days over 100 degrees Al Gore would be yelling this proves he is right. Of course, back then, there were no fleets of cars to blame no less soccer moms.

This is all part of the cycle. We have extreme floods now, then swings of heat during the summer to create droughts, then the climate turns down and progressively moves into a colder pattern.


Aurora Borealis Warning the Climate May Turn Sharply Colder into 2032


There may actually be a confirmation that we are heading into a much colder climate. The Aurora Borealis, also known as the Northern Lights, can now be seen in the UK. Normally, the Northern Lights can be seen only extremely north as in Alaska. Sir Edmund Halley (1656 – 1742), the man who discovered Halley’s Comet, was a friend of Isaac Newton. He was asked to speak about the unusual events that were taking place in the sky. He addressed the British Royal Society, stating:

The Royal Society, having received accounts from very many parts of Great Britain, of the unusual lights which have of late appeared in the heavens ; were pleased to signify their desires to me, that I should draw up a general resation (sic) of the fact, and explain more at large some conceptions of mine I had proposed to them about it, as seeming to some of them to render a tollerable [sic] solution of the very strange and surprizing [sic] phænomena thereof.

During the period of Halley’s investigation, the Little Ice Age dominated the decades and it bottomed around 1680. The Aurora Borealis actually expands and moves further south during periods of a colder climate. The Northern Lights being visible in the UK is not a good sign for climate change. This may be warning that we are headed back to a prolonged colder climate. Solar cycle 14 had the record high for sunspots during February in 1906. The annual peak took place in 1957 with 190 sunspots taking place that year. Based upon our models, the ideal low was most likely 1686/1687. From the 1957 high, the collapse to just 10 sunspots per year took place in 1964 — 7 years later.

Just before the Mini Ice Age, sunspot activity peaked during 1787 at 132 (mean) and crashed for 11 years into 1798, dropping to just 4 sunspots. If we continue to witness this declining trend from the 2000 high where there are virtually no sunspots, we appear to be vulnerable to a significant decline at least into 2032.

Climate Change: Real – Fake – Exaggerated?


QUESTION: I find it interesting that you are against human-induced global warming yet you confirm that climate change is natural. You seem to be in the middle of these arguments. You warned that solar activity was declining and there was a risk of going into a mini ice-age, but you did not seem to place high odds on that one. So can you elaborate on this since you seem to be the voice of reason?

GR

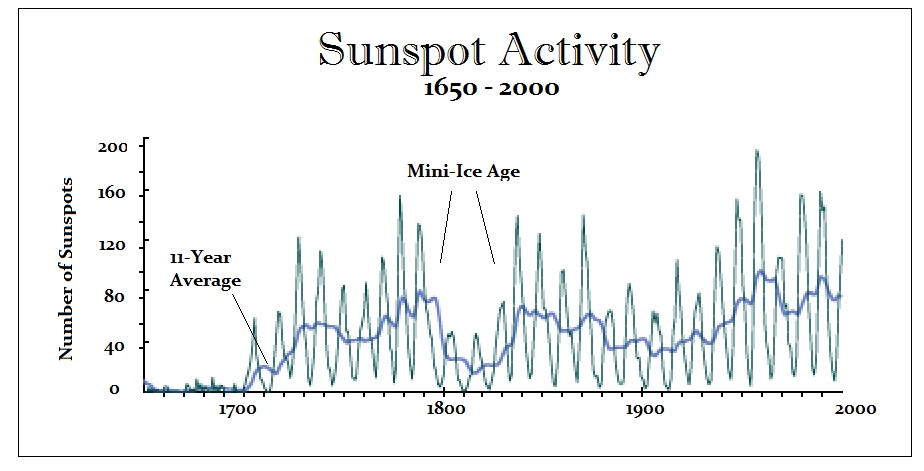
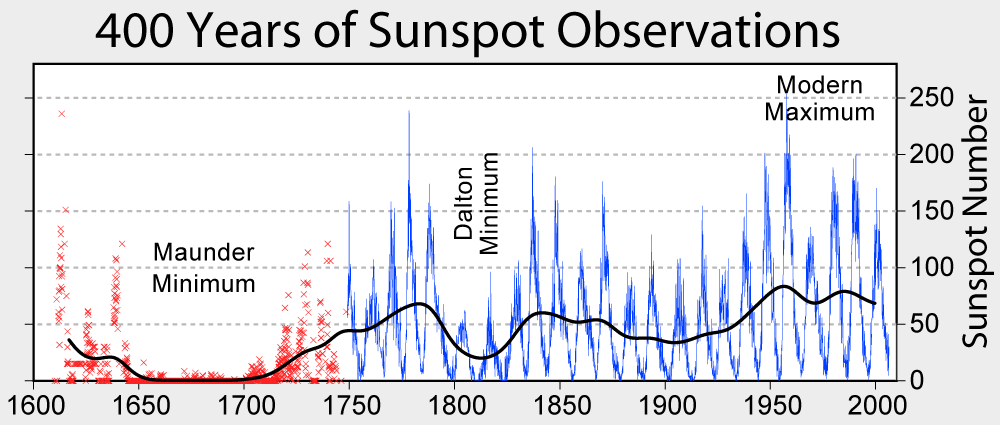
ANSWER: Sunspot activity has declined on schedule. February was an incredible month void of sunspots. This is clearly contributing to the extremely cold weather we are having. Cyclically, between 1645 and 1715, there was a prolonged collapse in sunspot activity known as the Maunder Minimum. Indeed, that was a period where sunspots all but disappeared. This coincided with the “Little Ice Age,” which was a period from 1500 to 1850 in the northern hemisphere. It was so cold, Viking settlers even abandoned Greenland.

I have stated many times that a major error in analysis is the attempt to reduce a problem to a single cause and effect. This topic of climate change is no different. Many scientists have strongly suggested that the Maunder Minimum caused the Little Ice Age. As I have shown, correlating everything that took place revealed that during solar minimum there is also an increase in volcanic activity and earthquakes.

You will read that scientists seem to be debating between the two rather than comprehending that EVERYTHING is absolutely connected. We cannot reduce everything to a single cause and effect. Therefore, in order for me to confirm that we are heading into a new ice age requires more volcanic activity in addition to a prolonged solar minimum.

The sunspot cycle is also called the Schwabe cycle, and currently we are moving toward the end of cycle 24. It does appear using long-term cycle analysis that cycle 25 will probably be at the very least a quieter cycle than we are concluding here with cycle 24. There’s been this steady decline, so we are indeed heading into what could be a prolonged solar minimum.

There have been several protracted solar minimums since 1000 AD:

  1. Oort minimum (1040–1080 AD)
  2. Medieval Minor minimum (1150–1200 AD)
  3. Wolf minimum (1270–1350 AD)
  4. Spörer minimum (1430–1520 AD)
  5. Maunder minimum (1620–1710 AD)
  6.  Dalton minimum (1787–1843)

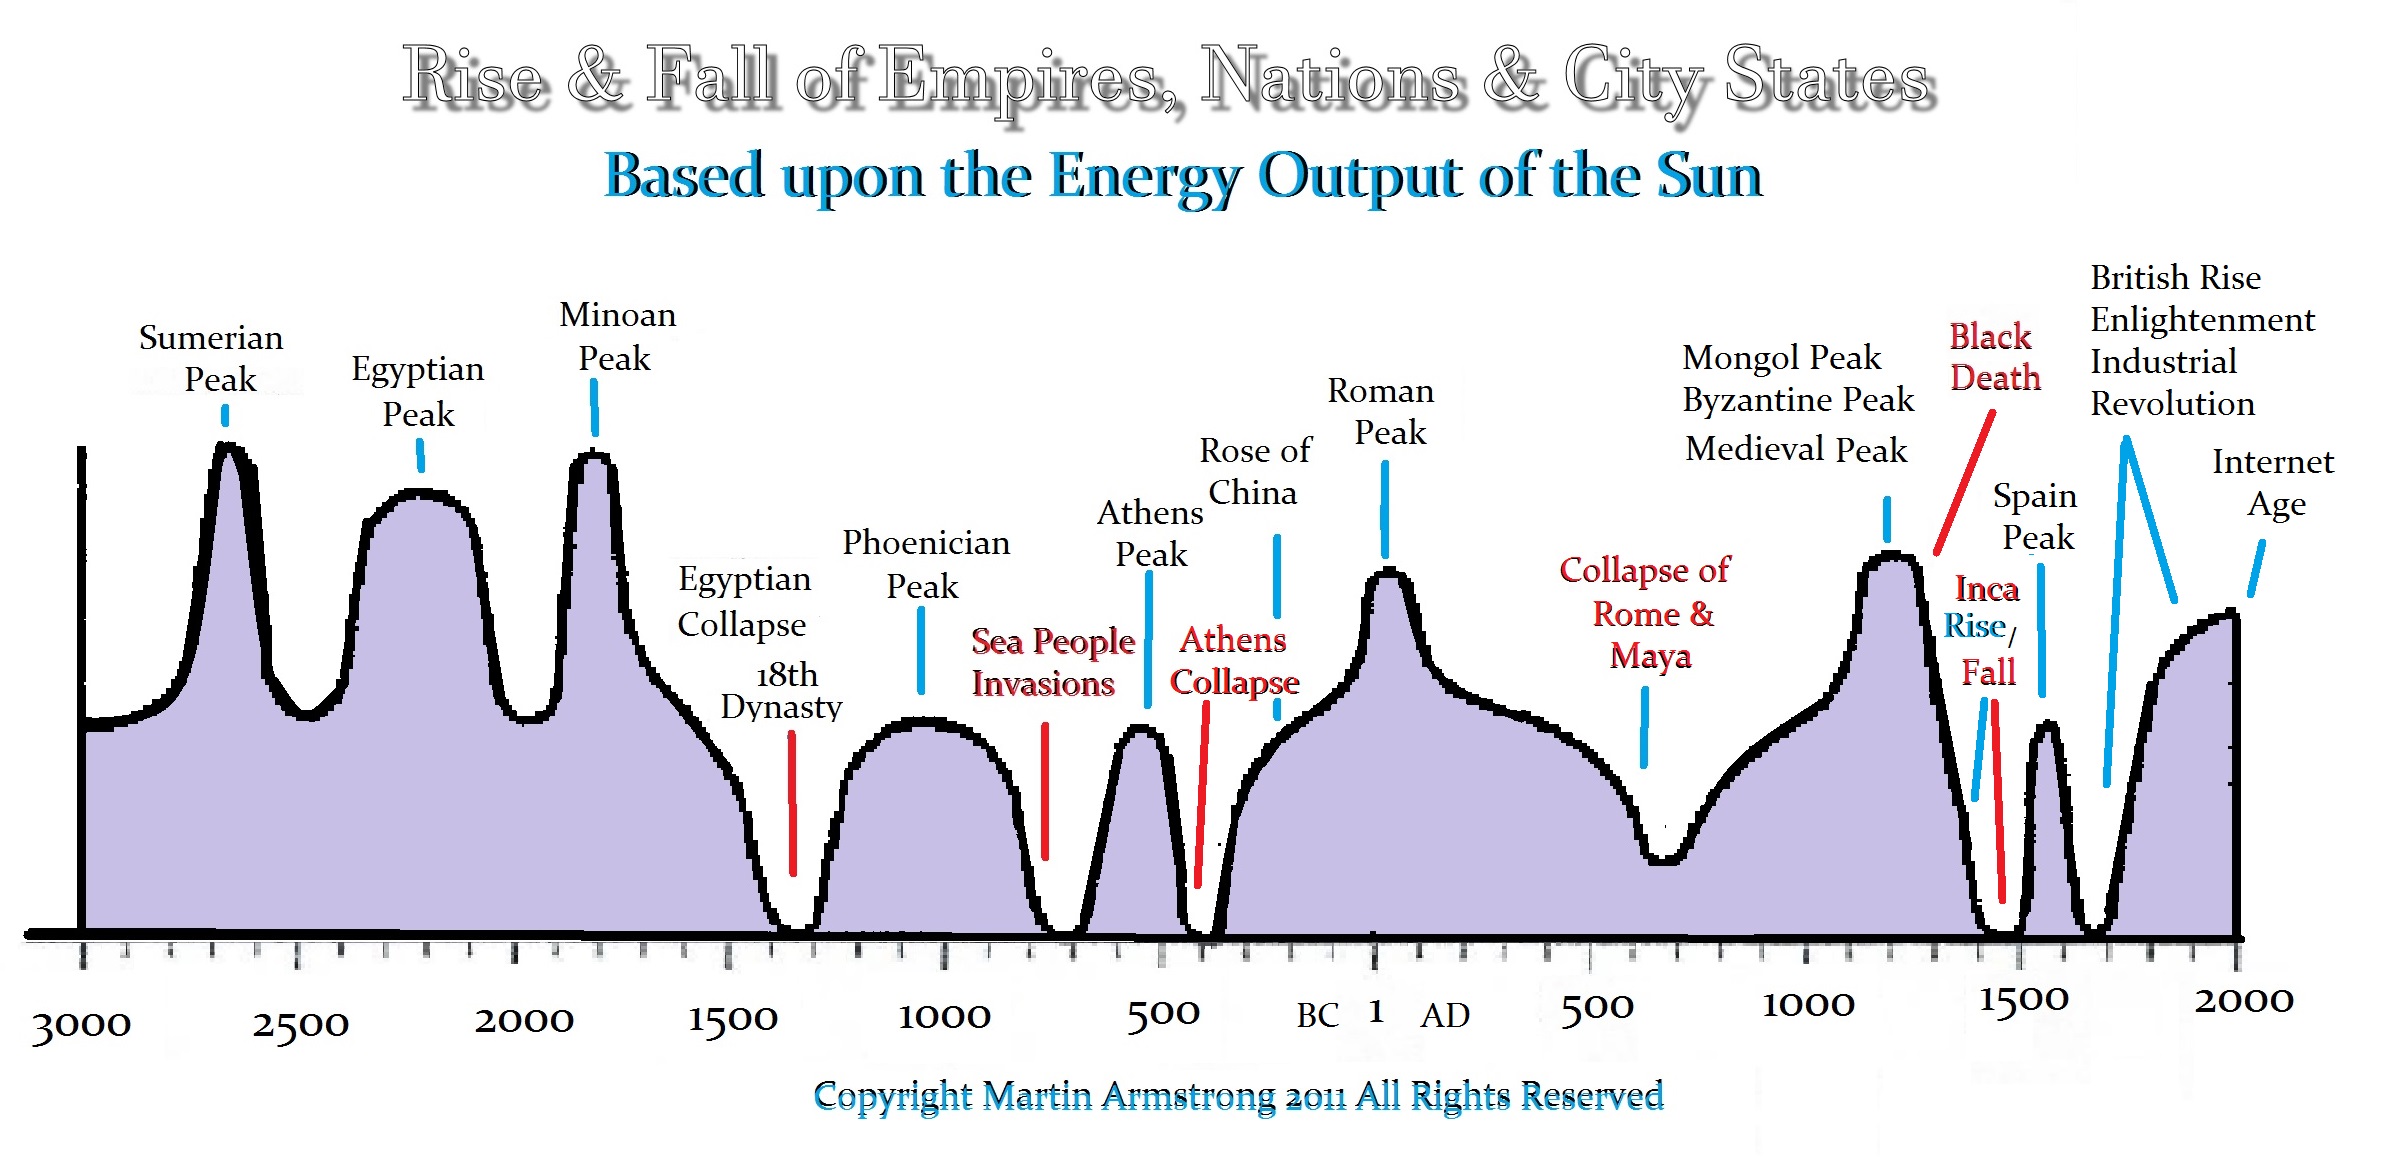
This post-Dalton minimum peaked strangely with the Economic Confidence Model on 1989.95. The peaks in solar activity have been declining with each wave subsequent to that turning point. It is now declining faster than ever previously know for nearly the last 10,000 years. Pretend scientists claim climate change it due to human activity. They were predisposed to arrive at that conclusion and not offer legitimate analysis whatsoever. Society expands during warming cycles and contracts during periods of global cooling.

I have also warned that if next year is colder than the 2018/2019 winter, and if this summer ends up with an expansion of drought, then besides keeping an extra supply of canned goods, the short-term cycle would warn of a further cold period into 2024/2025. The problem here is that if governments can blame humans, then they can tax us. When something is natural, there is no one to tax or blame except Acts of God. So YES, there is always climate change, but humans do not create it. There is far more complexity to this than a single cause and effect. REAL analysis cannot take place when the objective is always to reduce it to a single cause and effect.

50 to 1 Project – Marc Morano Interview


Published on Aug 29, 2013

SUBSCRIBE 3.8K
http://www.50to1.net – Topher interviews Marc Morano, accused ‘criminal against humanity’ and alleged ‘central cell of the climate denial machine’ and gets an insiders look into the politics and collateral damage caused by clumsy political responses to fears about climate change.


Lord Christopher Monckton – The Economics Behind Windmills


Published on Feb 5, 2018

SUBSCRIBE 21K
Lord Christopher Monckton joins us on stage for a quick talk to discuss the economics behind windmills and the problems behind them.