
Armstrong Economics Blog/Agriculture
Re-Posted Mar 6, 2019 by Martin Armstrong
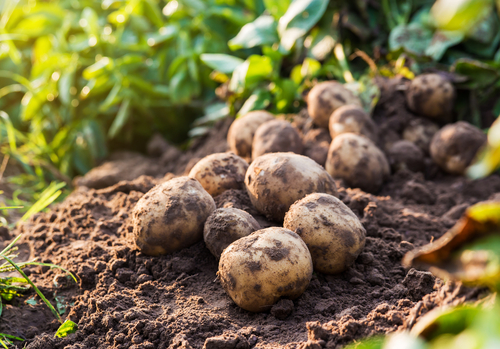
I am in Europe ahead of the May elections as the crisis begins to build. It appears that the powers that be may be talking about Global Warming to justify more taxes, but behind the curtain, these freezing winters are having their impact. The potato crop in Germany has hit a historic low due to the severe summer drought. The yield is down 25-30% and it may be worse after processing. As a result, seed potatoes are not sufficiently available and it is now expected that this will reduce the 2020 crop as well.
The indexes put out by the banks on commodities were told to remove agricultural products from their indexes. The belief is if we do not pay attention, then nobody will notice the rise in prices. There are clearly concerns that food prices are going to rise.
2019 is Breaking All Records for Cold – The Real Threat is a Global Freeze
Armstrong Economics Blog/Climate
Re-Posted Mar 2, 2019 by Martin Armstrong
QUESTION: Global cooling….you talk a lot about global cooling in the colder winter this year. But what effect does it have on the future summer temperatures and growing of crops?
GL
ANSWER: This type of climate change has the potential to be very profound. 2019 is already setting new records for cold and snowfall. In the center of the USA, the snowfall has risen to more than double that of 2000. There are many influences it has produced historically and the summer crop seasons grow shorter and dryer. Historically, this results in starvation in some areas but primarily malnutrition. That sets the stage for the rise of disease and plagues.
The Black Death was preceded by the Wolf Global Cooling where temperatures dropped by nearly 20% from the Medieval Warming period. As temperatures decline, the crop cycle shortens. In fact, so many people died during the 1300s that this brought an end to feudalism because there was a shortage of labor.
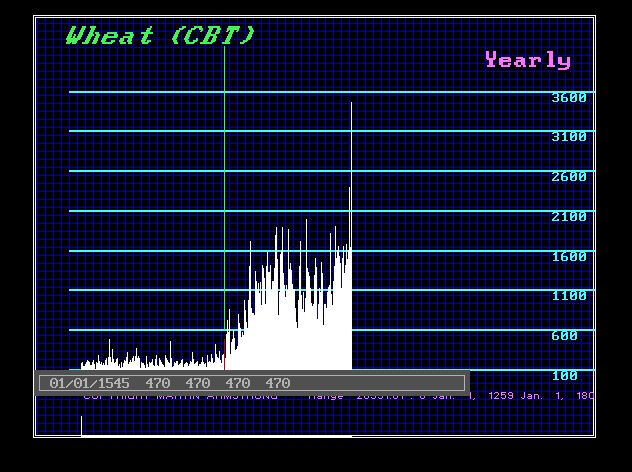
The Little Ice Age followed the Wolf Global Cooling. We can see that the price of wheat began to break out in 1545. Keep in mind that our model was created by pulling in everything we could get our hands on and correlating the entire world. When our model is showing Global Cooling and a pending bull market in the price of food, it is something rather important enough to put on the agenda. During the 1700s, even Thomas Jefferson and John Adams commented on how the ground froze to a depth of 2 feet. Nothing will grow under such conditions.
Founder of Green Peace calls AOC a “Little Twit”
Armstrong Economics Blog/Climate
Re-Posted Mar 1, 2019 by Martin Armstrong
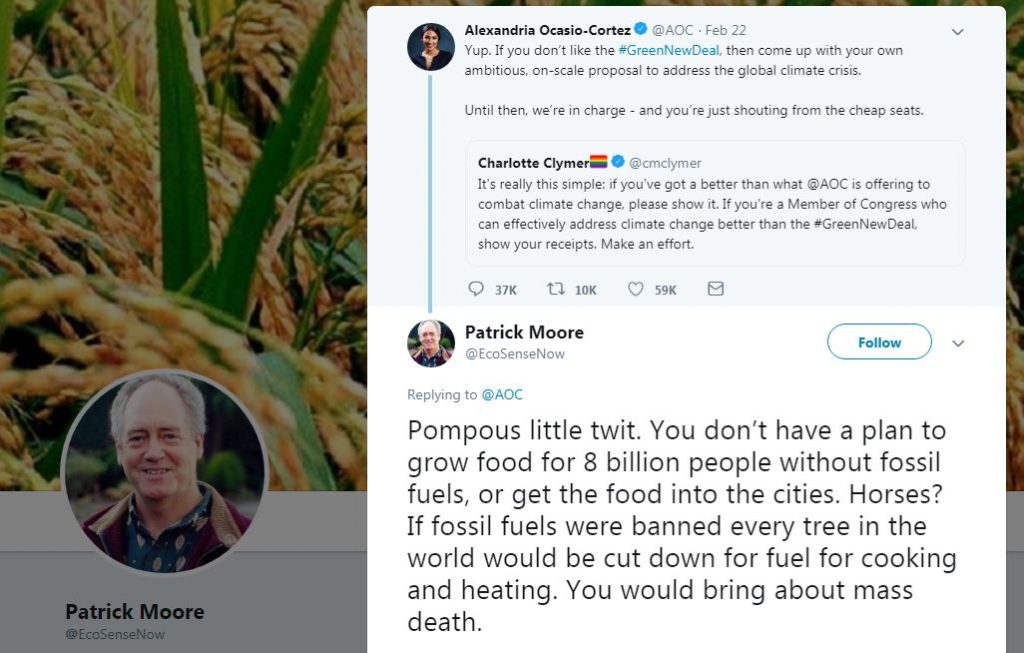
There are some sensible Democrats who seem to afraid of coming out to criticize AOC. The real question becomes, will she take the Democrats down in flames? We will have to start running the models for 2020. The assumption here is that this is all human-induced. Nobody ever heard of nature or cycles.
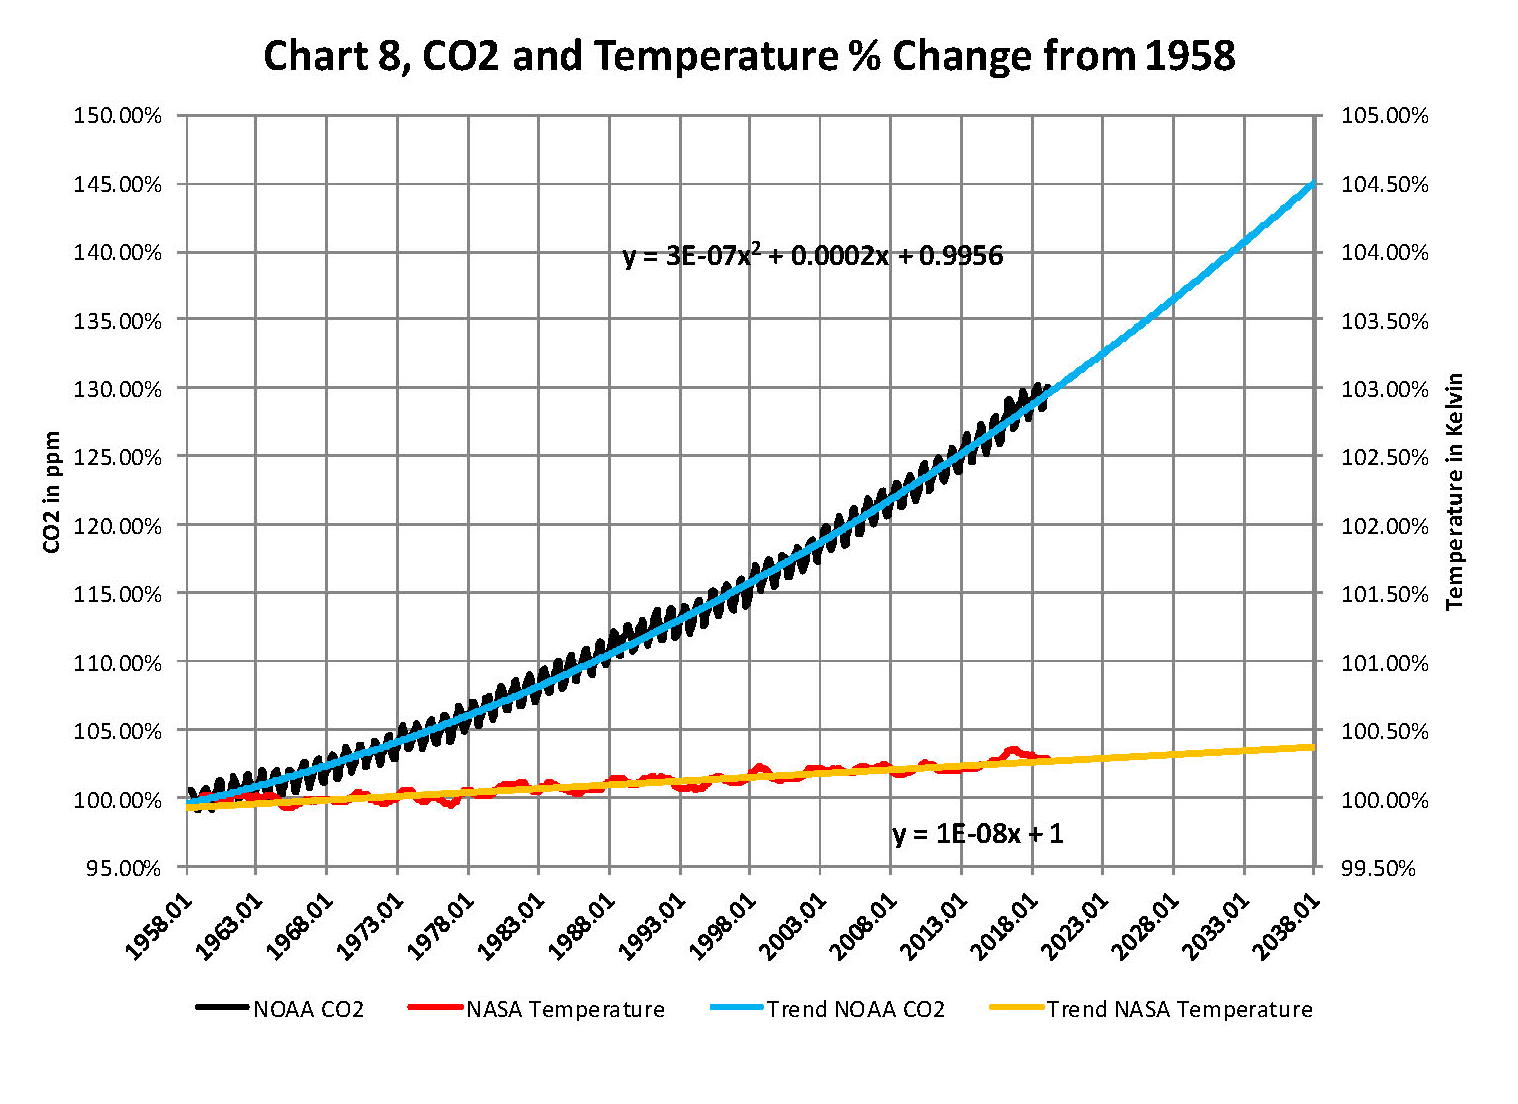
A Technical Study in the Relationships of Solar Flux, Water, Carbon Dioxide and Global Temperatures, January 2019
From the attached report on climate change for January 2019 we have the two charts showing how much has the global temperature actually gone up since we started to measure CO2 in the atmosphere? To show this graphically Chart 8 was constructed by plotting CO2 as a percent increase from when it was first measured in 1958, the Black plot, the scale is on the left and it shows CO2 going up about 30.0% from 1958 to October of 2018. That is a very large change as anyone would have to agree. Now how about temperature, well when we look at the percentage change in temperature from 1958, using Kelvin (which does measure the change in heat), we find that the changes in global temperature (heat) are almost un-measurable. The scale on the right side had to be expanded 10 times (the range is 40 % on the left and 4% on the right) to be able to see the plot in the same chart in any detail. The red plot, starting in 1958, shows that the thermal energy in the earth’s atmosphere increased by .30%; while CO2 has increased by 30.0% which is 100 times that of the increase in temperature. So is there really a meaningful link between them that would give as a major problem? The numbers tell us no there isn’t.
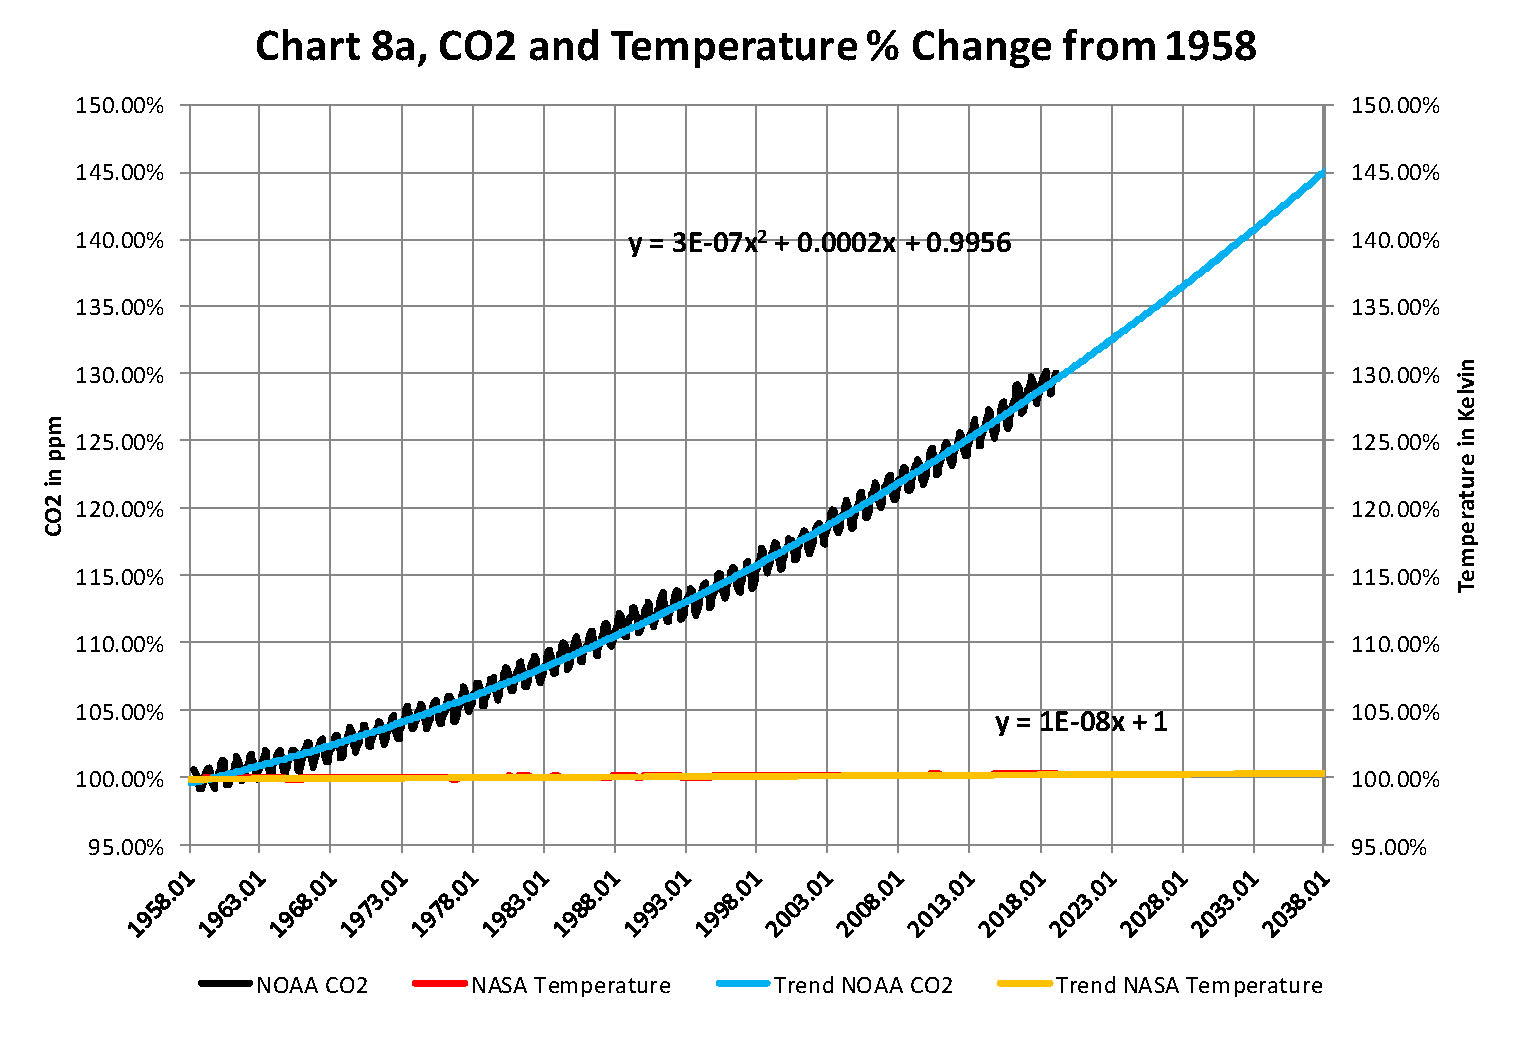
The next chart is Chart 8a which is the same as Chart 8 except for the scales which are the same for both CO2 and Temperature. As you see the increase in energy, heat, is not visually observably in this chart hence the need for the previous chart 8 to show the minuscule increase in thermal energy shown by NASA in relationship to the change in CO2. Based to these trends, determined by excel not me, in 2028 CO2 will be 428 ppm and temperatures will be 15.0o Celsius and in 2038 CO2 will be 458 ppm and temperatures will be 15.6O Celsius. This is what the data shows no matter what the reasons are, so I have no idea how the IPCC gets to predict that the world will end in ten or twenty years.
Click on the link below for the full report that you can download.
The Green New Deal
Unstoppable Solar Cycles – Full Video
Published on Aug 19, 2015
“Basic Physics” At NASA
Published on Feb 7, 2019
Is The Global Temperature Record Credible?
Published on Nov 4, 2018
Is this the Coldest Winter in 83 years?
Armstrong Economics Blog/Climate
Re-Posted Feb 26, 2019 by Martin Armstrong
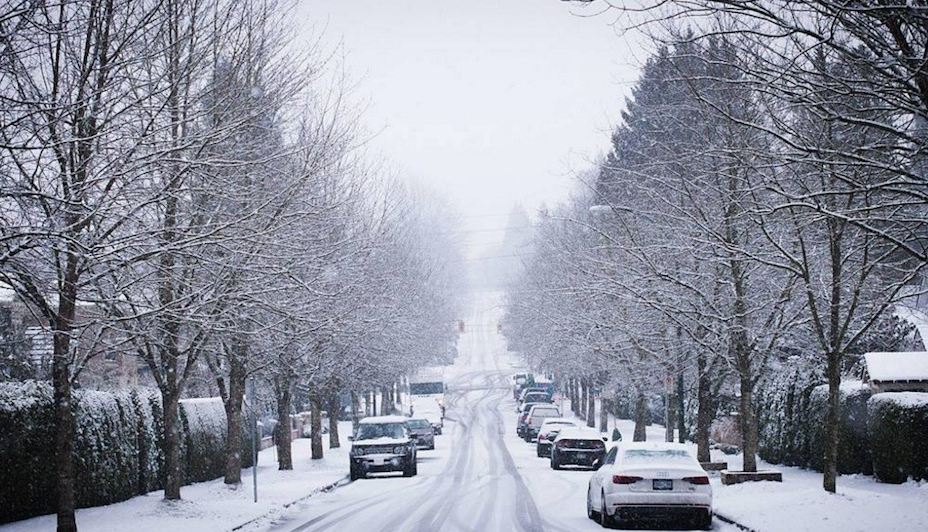
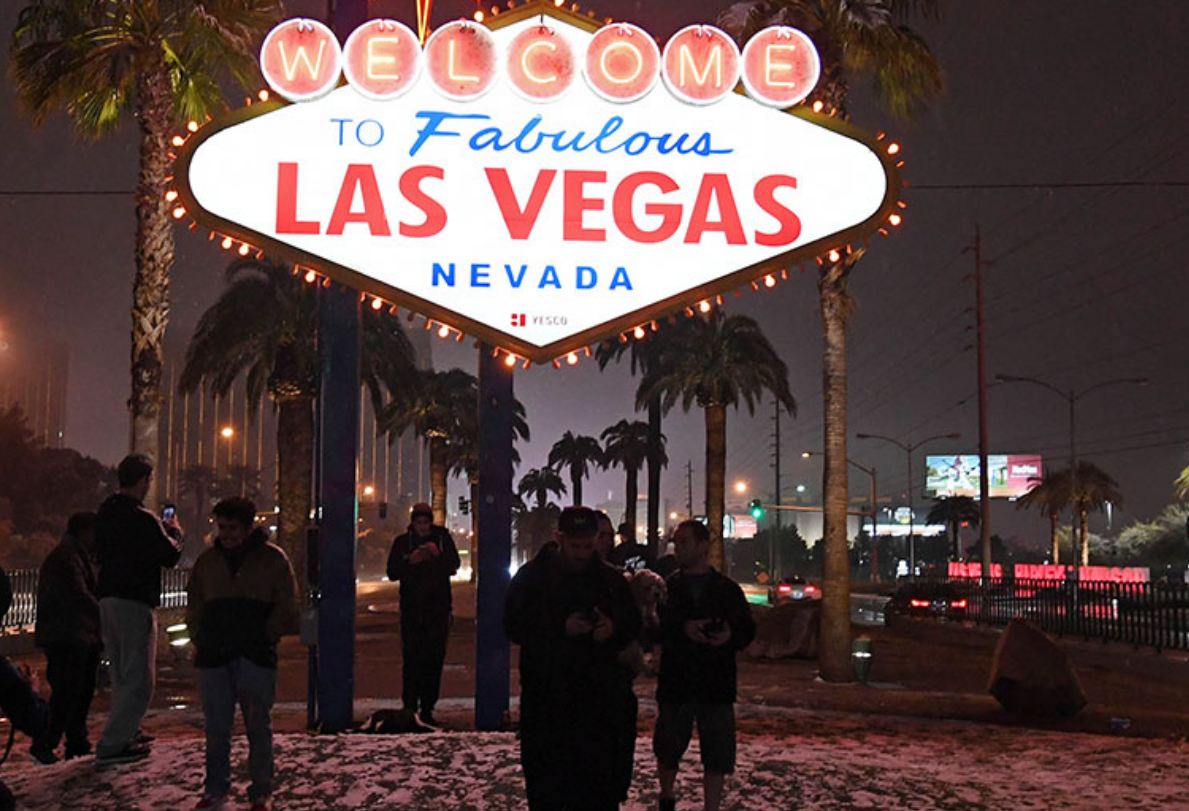 Vancouver, where it rarely snows, has had five snow storms this year. It has even been reported that snow has fallen in Las Vegas and Los Angeles. Now that is an extremely rare event by itself in addition to Vancouver.
The winter cold has been severe this year. It appears that we are heading toward this trend in the next 8.6-year cycle if we see this unfold against next year. Given the outlook for food prices into 2024, something just does not look normal on the economic front.
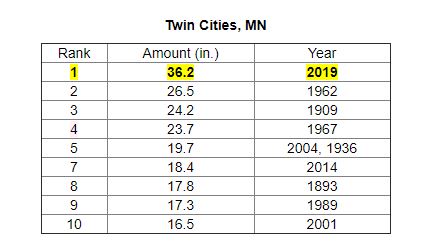
Meanwhile, it is now official. February has been the COLDEST month in 83 years! The global climate pattern is now transitioning from a global warming cycle, which peaked in 1998 on a long-term basis and 2015 on a short-term basis, to a global cooling long-term and short-term cycle. Both the Arctic and Antarctic entered the next global cooling cycle in 2015 and have been dramatically cooling during the past 3 years. In the UK, according to the Central England Temperature (CET), a record of monthly mean temperatures dating back to 1659, December 1890 was marginally colder, with a mean of -0.8°C. The data is available that demonstrates this is a cycle and it predates the Industrial Revolution.
In Arizona, the temperatures have broken even a 122-year previous record low.
Toilet Paper Causes Climate Change
Armstrong Economics Blog/Climate
Re-Posted Feb 25, 2019 by Martin Armstrong
It didn’t take long. They keep looking at every possible aspect to blame for climate change, so now it is toilet paper. The latest study says the largest U.S. makers of at-home tissue products—Procter & Gamble Co., Kimberly-Clark Corp., and Georgia-Pacific—all use only virgin fiber in their major brands with no recycled content. The U.S. consumes more toilet paper per capita than other countries, which is contributing to climate change because we use pulp from Canada’s northern forests that absorbs man-made greenhouse gases. So just use your fingers and wash your hands, or not, depending on who you have to shake hands with.
