I have literally followed you for years (well before your nightmare at MCC in NYC). I am simply amazed at what you and Socrates have accomplished.
I only know of one person in America that made the bold prediction shown below. I am amazed, along with all your clients, that you are able to reliably forecast so many issues. Keep on doing what you’re doing and thank you from the bottom of my heart!
BC
Spokane, WA
REPLY: I moved to Florida because of the forecasts of Socrates. What I am trying to show is that a computer, with a database, can forecast the correct trends in everything from weather and climate, to markets, politics, and war. Anyone who knows me, I hate cold weather. I have roamed in the Valley of the Kings when it was about 120 degrees. Everyone else stayed in the hotel, but I traveled that far and I was not about to stay in the hotel. But I have also been to Edmonton when it was -40 below and they could not shut off the cars or they would never start and you could not talk because your teeth would hurt.
So you can bet on one thing. None of these forecasts were ever made with a personal bias. I just hate cold. Turning to global cooling was not something I wanted to see.
Culling humanity by means of GMO food and poisonous vaccines isn’t enough for Bill Gates. Now he wants to block out the sun in his quest to solve global warming, also known as ‘climate change.’
Due to a solar minimum (no sunspots) and a dipping polar vortex, North America and Europe are currently experiencing record cold temperatures. Maybe we are seeing climate change, but it’s the opposite of the global warming fears that Bill and China Joe are pitching. We could be seeing the start of a mini ice age, similar to what happened in the middle ages. How convenient that science, now a wholly-owned subsidiary of Bill Gates, omits the sun from their climate change equations. Data is always skewed to blame human activity, just as Gates and the Illuminati have ordered.
Gates wants to scatter fine dust particles in the upper atmosphere to block the sun’s rays, thus cooling the Earth. I don’t recall anyone voting for such a dangerous scheme, but the oligarchs do what they want. Their political toadies love to spout the slogan ‘Our Democracy,’ while removing our liberties, but in reality it’s all about ‘Their Oligarchy’ and what they want while the masses have no say. Gates and his fellow 1/10th of one percenters do not have to follow laws or morals. Those are meant for their subjects—the powerless serfs.
People such as Gates get what they want. Along with the homunculus doctor, Fauci, he intends to get even richer while peddling under-tested and very harmful potions that get jabbed into the arms of millions. Gates, who is neither a doctor nor scientist, wants to rake in even more cash by cornering our food supply. We’ll be forced to pay Gates billions of bucks while he forces us to eat his poisonous GMO foods. Gates now owns more farmland than anyone else in the world. He’ll probably buy more and it somehow ties in with his evil plans to block out the sun. Maybe he’ll make sure the sun only reaches his properties.
Bill Gates should be tried for crimes against humanity, but who is able to mete out such long overdue justice? Unfortunately the mega-billionaire globalist oligarchs control our justice system, our politicians, corporate media, social media, and our education system. Apparently everyone will meekly stand by and watch a squeaky-voiced computer nerd runs his genocidal game plan.
Bill Gates wants to ‘save the planet’ for himself and his Big Club of mega-billionaires by killing off billions of human beings.
Biden shut down the Keystone Pipeline from Alberta, but what people do not realize is the environmentalists are out for blood. They are pushing to shut down pipeline #5 that supplies a large portion of Michigan homes the energy to stay warm. Line 5 supplies 65% of the propane demand of the upper portion of the state and 55% of Michigan’s statewide propane needs. Overall, line 5 transports up to 540,000 barrels per day (bpd) of light crude oil, light synthetic crude, and natural gas liquids (NGLs), which are refined into propane.
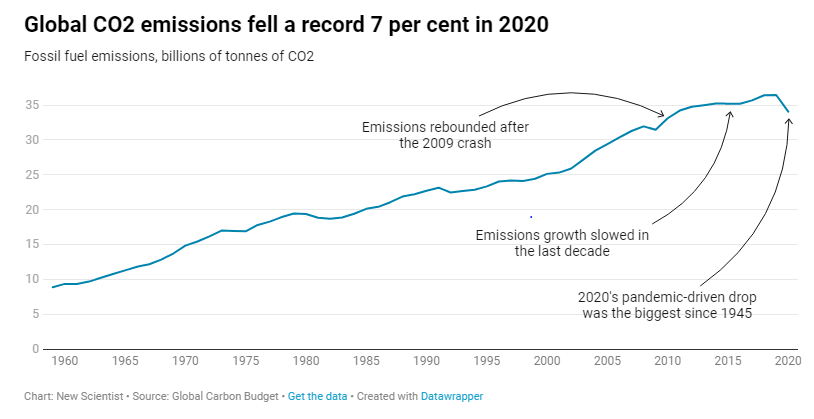
Despite the propaganda, we are not headed into global warming, but global cooling. Even Punxsutawney Phil predicted six more weeks of winter this season. It won’t be an ice age, hopefully, and if that took place it would be post-2032. But each winter is getting colder, and yet these people have dropped the global warming label and switched it to climate change so they can now claim that any storm or record snowfall is caused by CO2. These lockdowns have NOT been about the virus, but to reduce CO2. Indeed, shutting down the economy and preventing manufacture did reduce CO2 emission, but not that drastically.
Shutting down the world economy only reduced CO2 by 7%. Even Bill Gates knows that solar panels and windmills will just not service even keeping up the internet. He is pushing nuclear power to be expanded. What is not being widely reported is that as the temperatures collapsed, so did the wind. In Britain, they had a sudden energy crisis as the windmills stopped because of no wind and temperatures plummeted. As was reported, the BBC’s Roger Harrabin responded on Twitter that “we need solutions.” He expressed that it was foolish to think that shifting to renewables will save the day. Living in Florida, I needed a hedge against storms so you put in a backup generator that runs on gas, not electricity which will typically go down in a hurricane as trees fall and take down power lines.
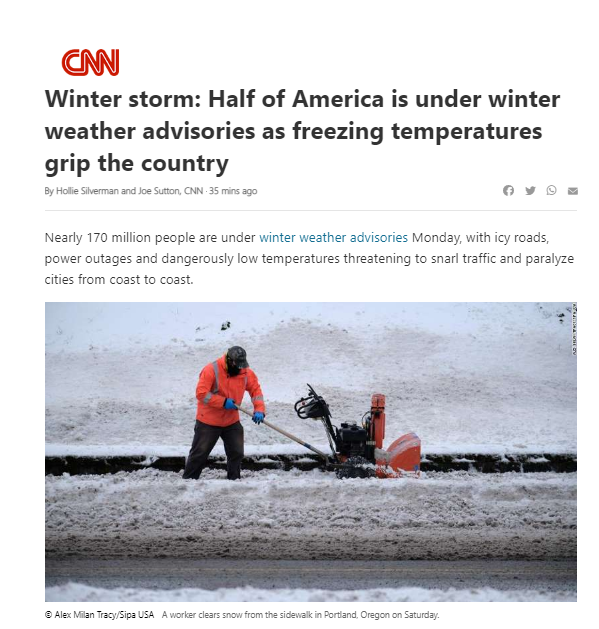
So as the climate turns colder and the snowstorms get worse, as we see in NYC this week, the environmentalists will NEVER admit that they are wrong and that there are natural cycles in climate. Cutting off energy will lead to a rise in deaths in the colder regions as fossil fuels are shut down.
Carbon Dioxide CO2 is not making “ANY” dangerous changes to the global temperature!
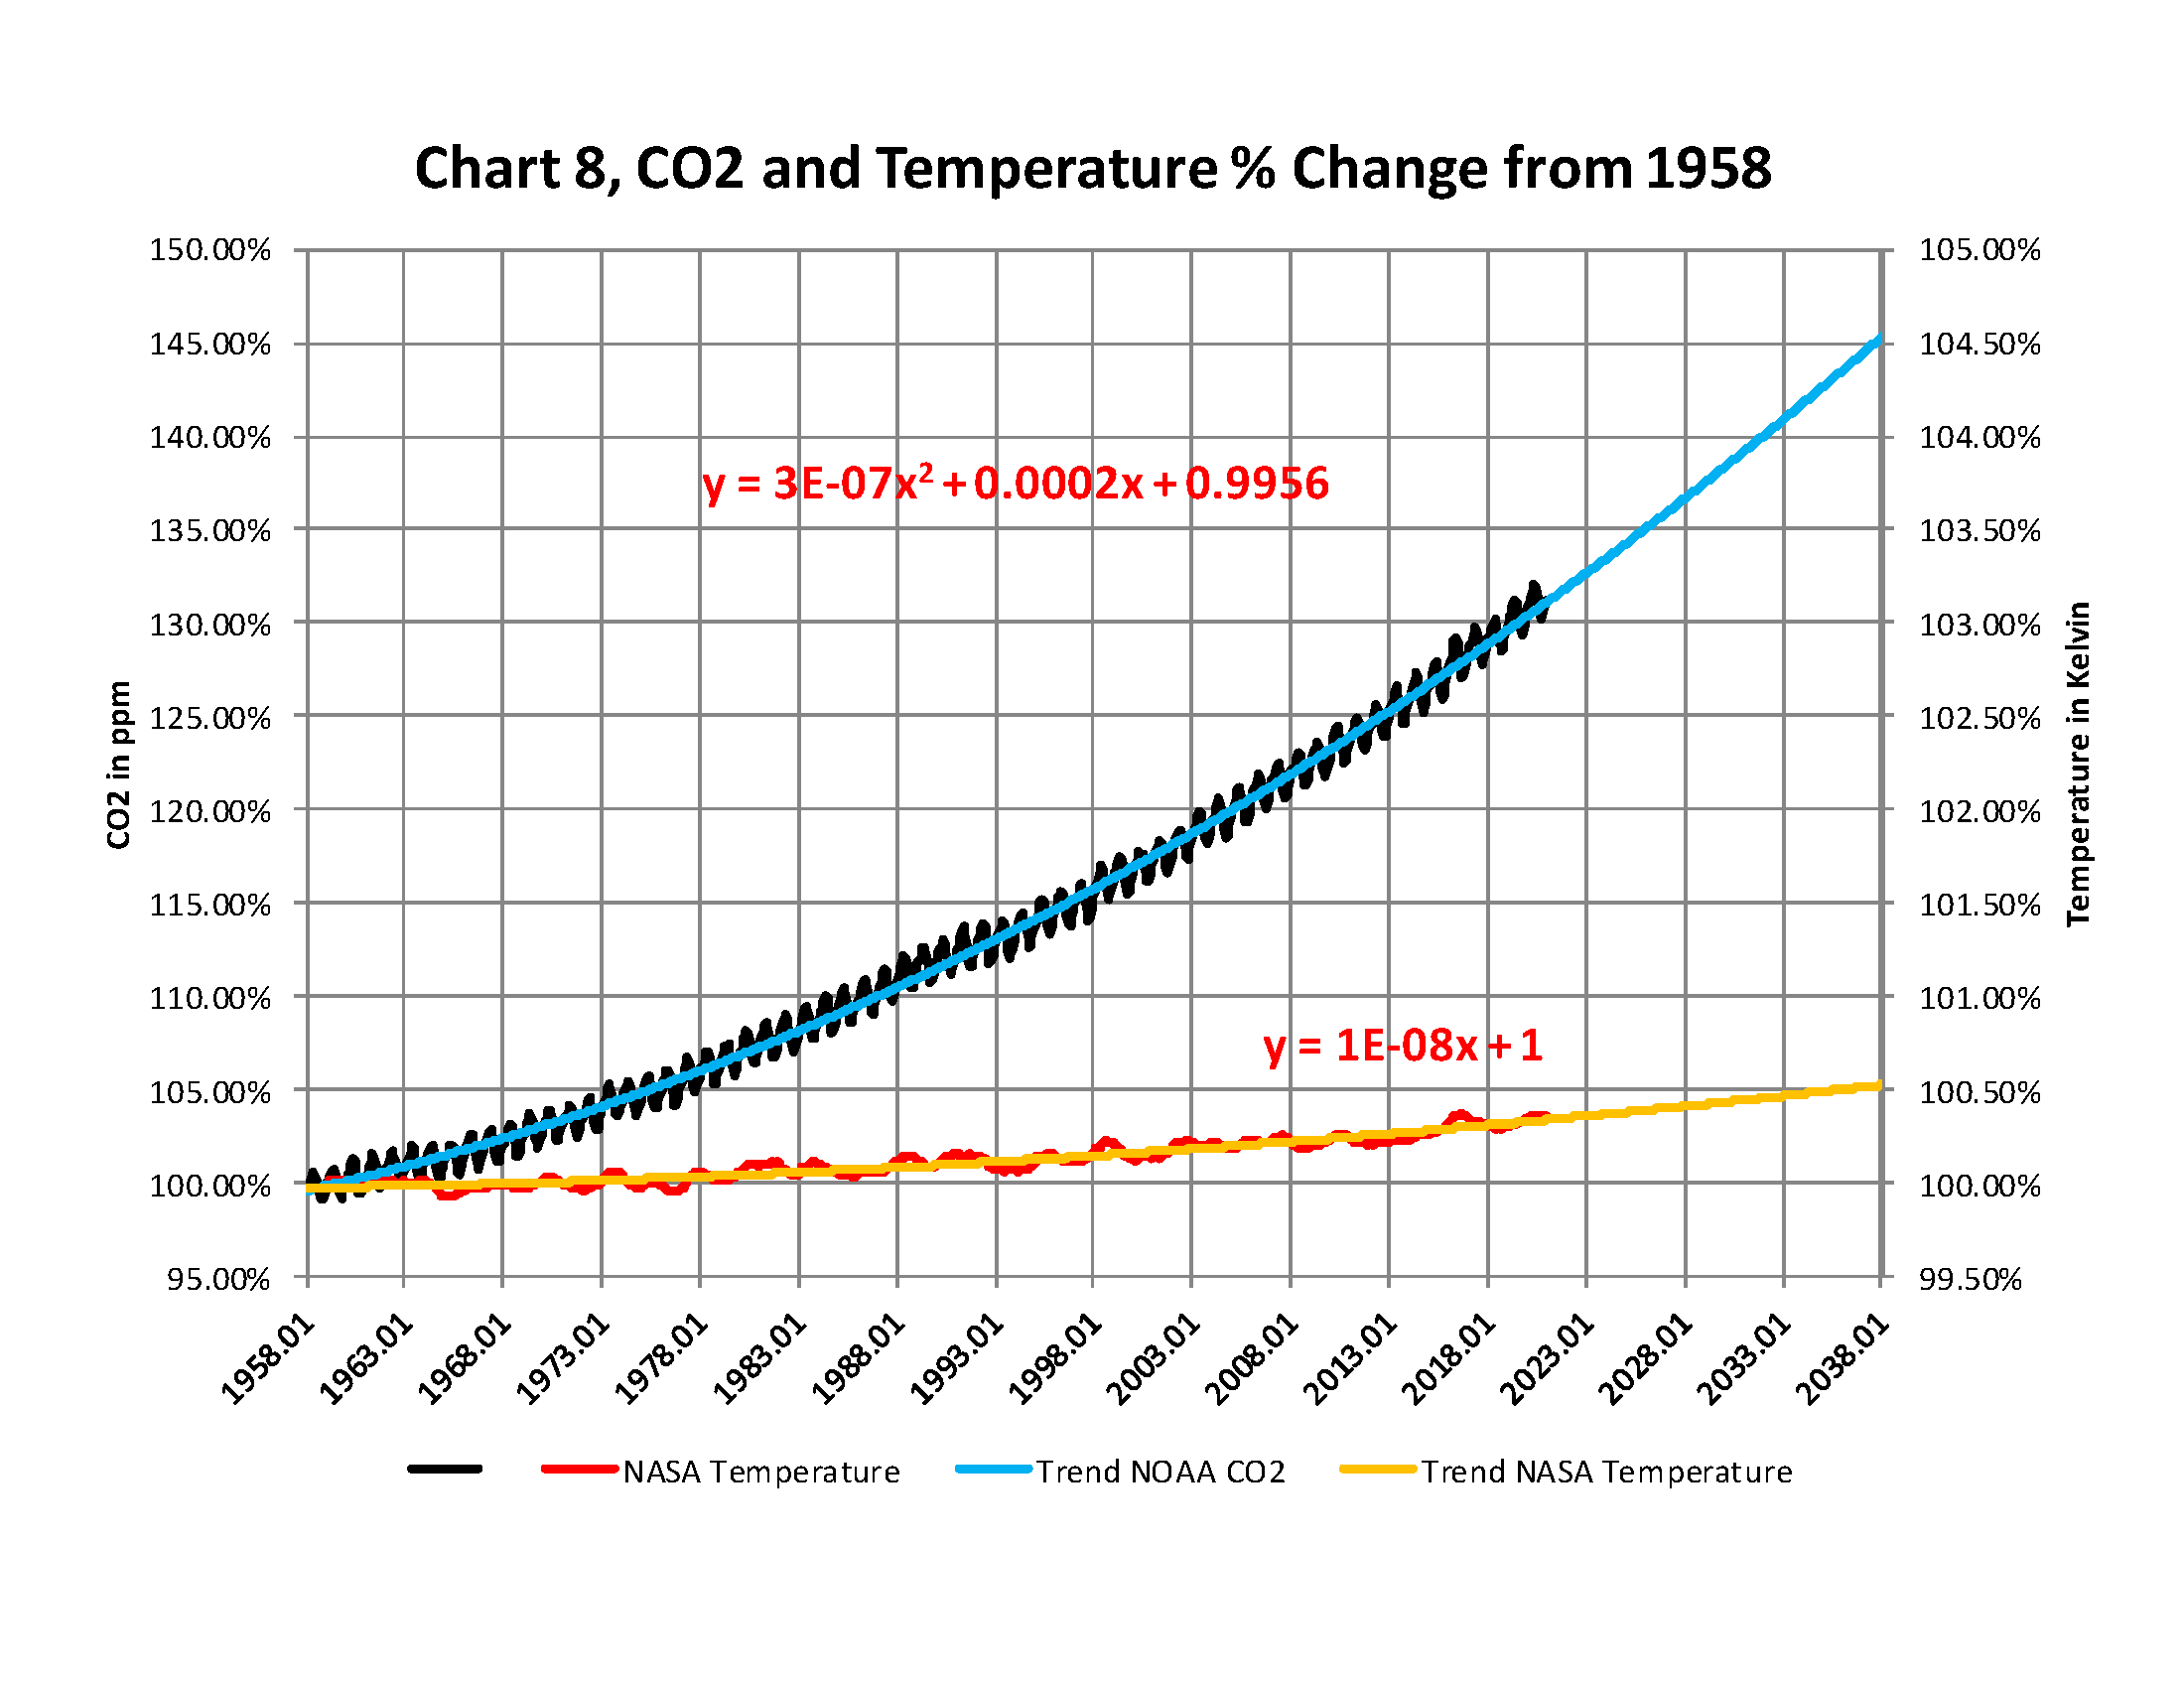
From the attached report on climate change for December 2020Data we have the two charts showing how much the global temperature has actually gone up since we started to measure CO2 in the atmosphere? To show this graphically Chart 8 was constructed by plotting CO2 as a percent increase from when it was first measured in 1958, the Black plot, the scale is on the left and it shows CO2 going up by 32.0% from 1958 to December of 2020. That is a very large change as anyone would have to agree. Now how about temperature, well when we look at the percentage change in temperature from 1958, using Kelvin (which does measure the change in heat), we find that the changes in global temperature (heat) are almost un-measurable. The scale on the right side had to be expanded 10 times (the range is 40 % on the left and 4% on the right) to be able to see the plot in the same chart in any detail. The red plot, starting in 1958, shows that the thermal energy in the earth’s atmosphere increased by .40%; while CO2 has increased by 32.0% which is 80 times that of the increase in temperature. So is there really a meaningful link between them that would give as a major problem? The numbers tell us no there isn’t.
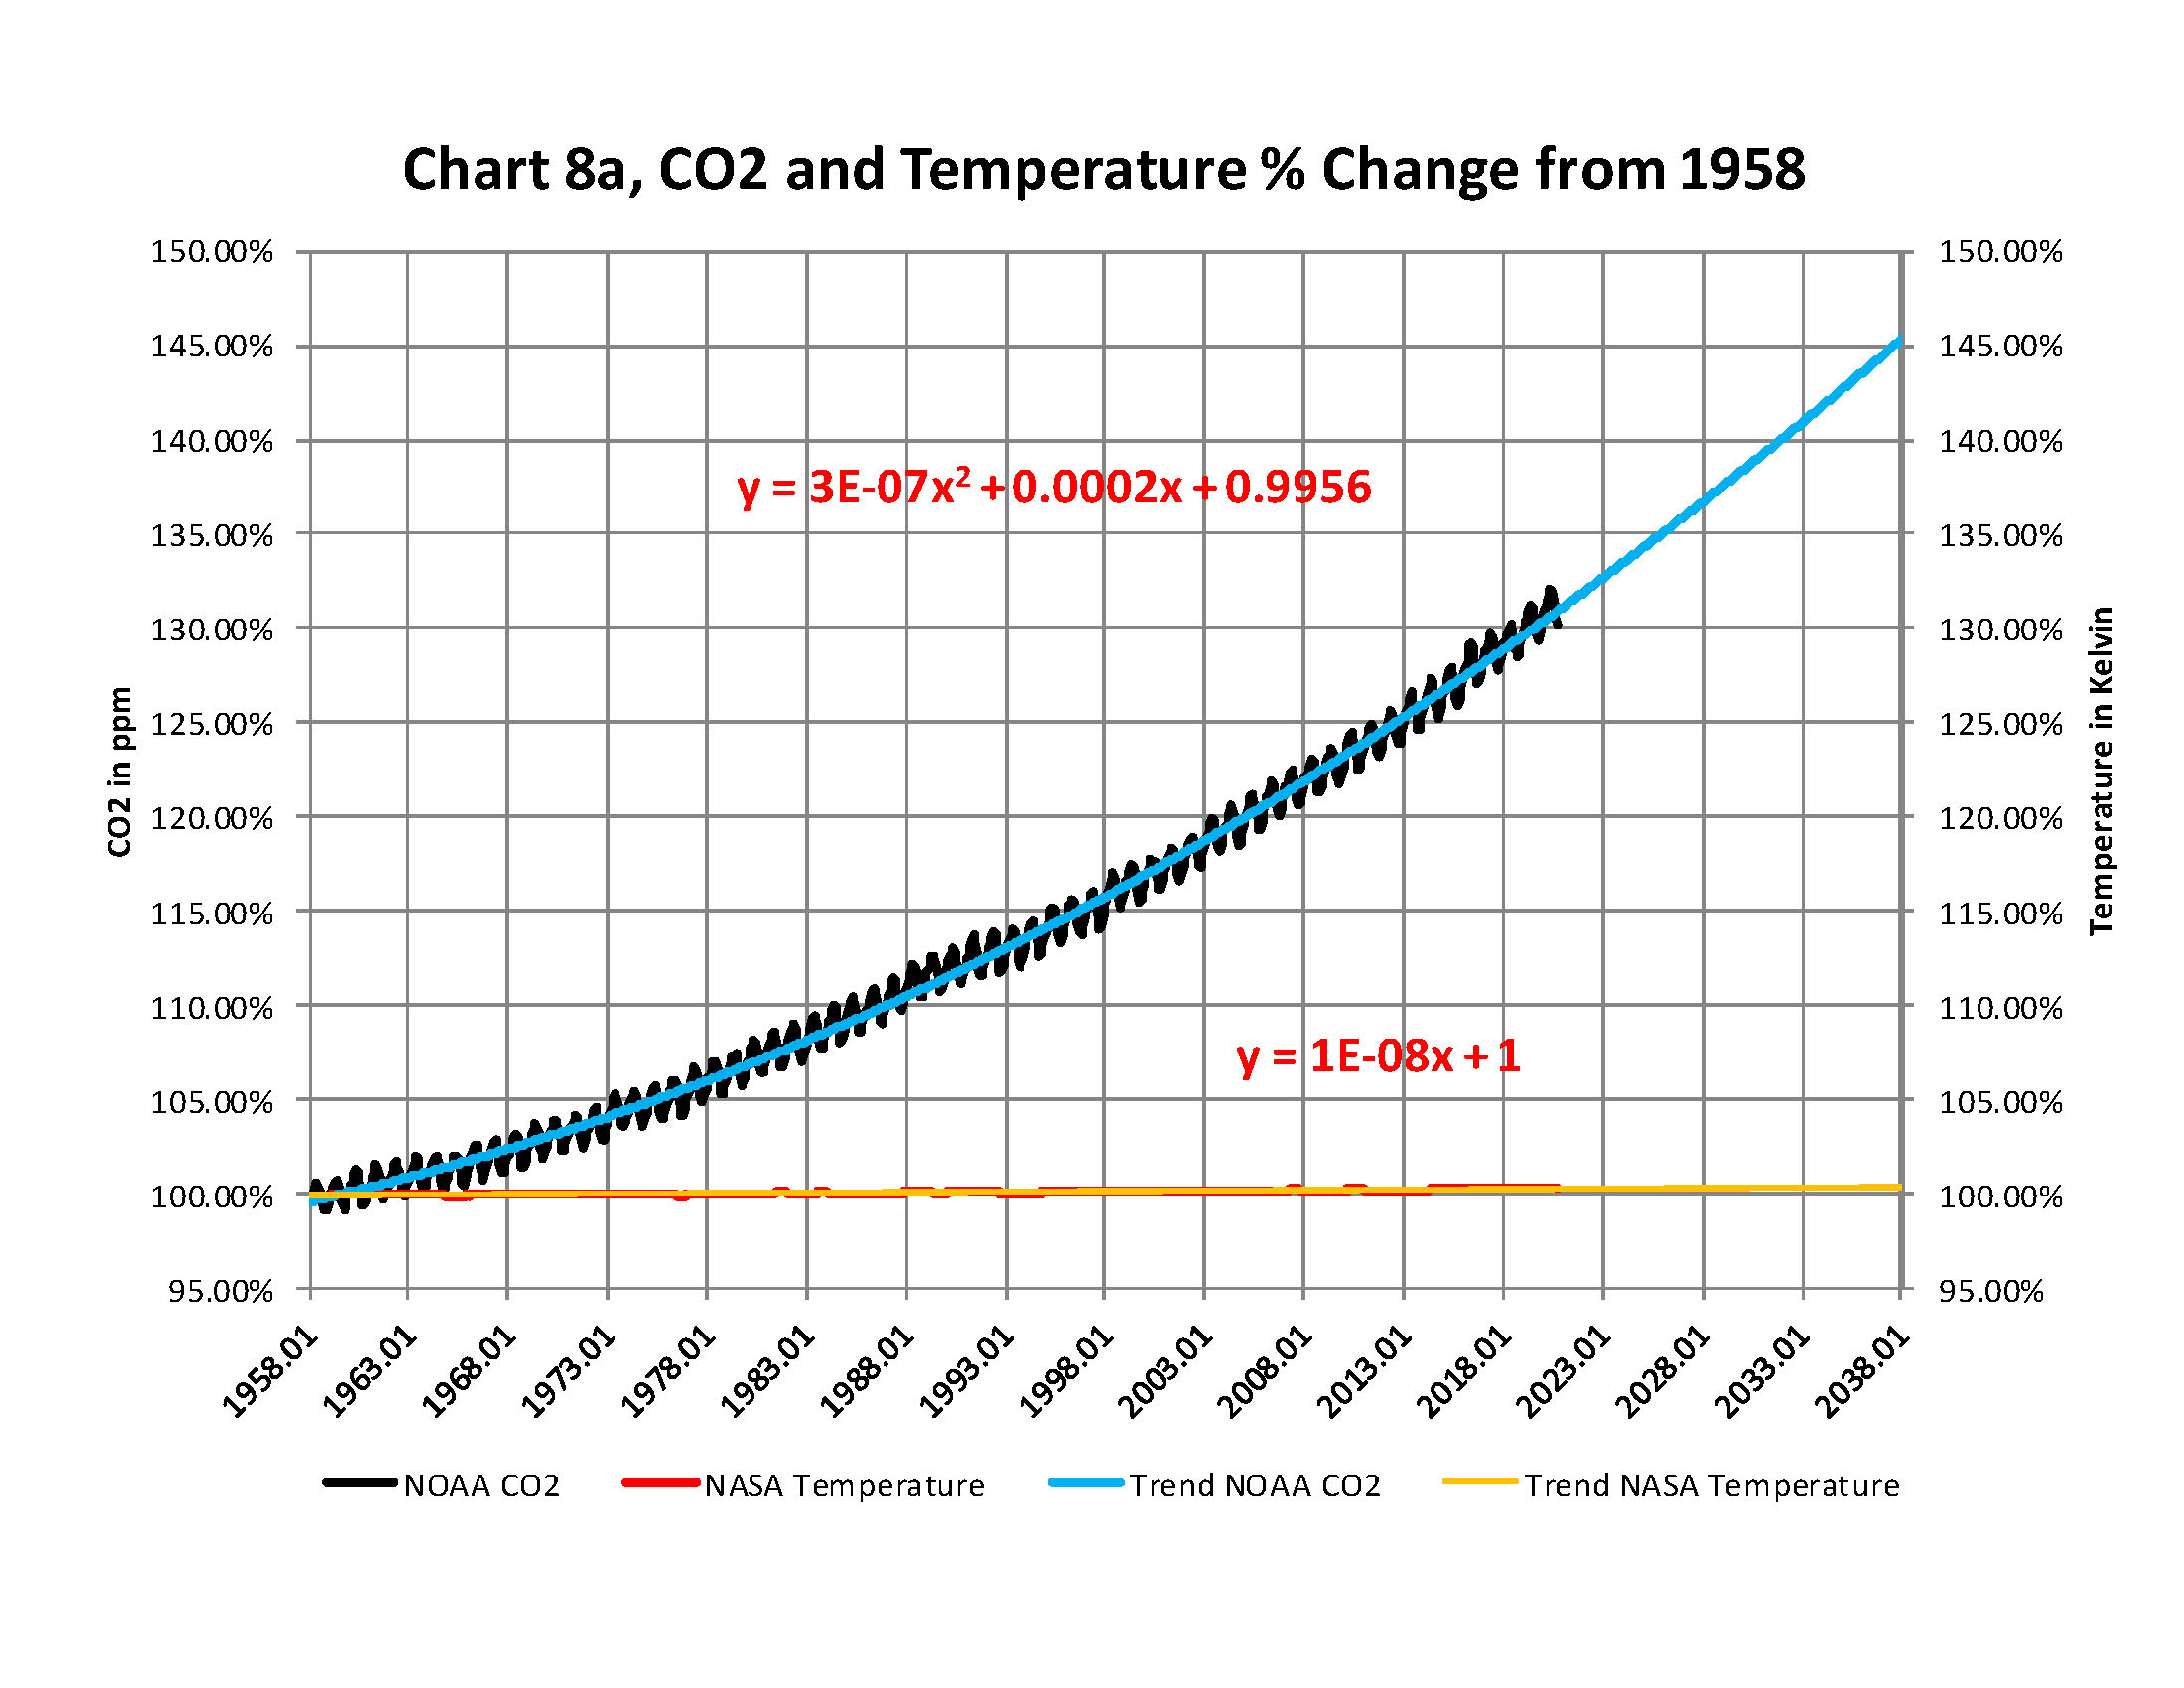
The next chart is Chart 8a which is the same as Chart 8 except for the scales which are the same for both CO2 and Temperature. As you see the increase in energy, heat, is not visually observably in this chart hence the need for the previous chart 8 to show the minuscule increase in thermal energy shown by NASA in relationship to the change in CO2. Based to these trends, determined by excel not me, in 2028 CO2 will be 428 ppm and temperatures will be a bit over 15.0o Celsius and in 2038 CO2 will be 458 ppm and temperatures will be 15.6O Celsius. This is what the data shows no matter what the reasons are, so I have no idea how the IPCC gets to predict that the world will end in ten or even twenty years.
The full 40 page report explains how these charts were developed and why using NASA and NOAA data that are used without change to prove that The New Green Deal is not required and any attempt to complete that plan will be a worldwide disaster.
Click on the link below for the full report that you can download.
For this old geologist the change from carbon causing cooling to causing global warming with no change in its place in the periodic table has been fascinating
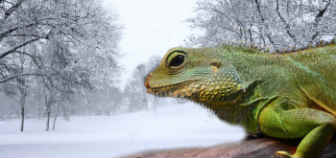
Atweet from the National Weather Service in Miami: “Brrr! Much colder temps expected for Christmas. Falling iguanas are possible”.
On Christmas Day, the Associated Press reported: “With unexpectedly cold weather in the forecast and pandemic-related curfews. Florida is about to have a Christmas unlike any other in recent memory, and it may involve falling iguanas.”
It seems that the lizards which are cold-blooded like to sleep in trees. But when it gets unusually cold their body temperature drops enough, they go sort of dormant. And in losing their grip fall from the branches. Without warning, which was part of the weather alert that temps could be the lowest in some 21 years.
The outstanding climate site WUWT recently ran a list of over 100 climate alarms. These range from dire warnings about another ice age—from using too much fossil fuels—to global warming. For the same reason.
Fear of The World Frying
“The lowest winter temperatures are likely to increase in Northern Europe…The duration of the snow season is very likely to shorten and snow depth is likely to decrease.” – IPCC Climate Change, 2007.
“All simulations show the trend of less snowfall will continue into the future. And winter sports will no longer be possible.” – Liebnitz Institute for Oceanography, February 17, 2005.
However, this winter seems to be generating some concerning news stories – about too much snow. And even one about too much cold in Brazil.
“More Record Lows in Brazil” – Coutiniho, November 7, 2020.
“Snow Chaos – Record Snowfall Causes Mayhem in Austria” – Today, RTZ.Lu, December 9, 2020.
“Delhi, Weather: IMD Records Coldest October in 58 Years” – The Quint, October 31, 2020.
“Record Snowfall in New York State” – WGRZ.com, December 26, 2020.
“Texas Snowfall Almost As Far South As Austin” – NBC, Dallas-Fort Worth, December 28, 2020.
Fear of Another Ice Age
“The world has been chilling sharply…At twice what it would take to put us in an ice Age.” – Earth Day 1970, Kenneth Watt, Ecologist.
“Discharge into the atmosphere by burning fossil fuel will screen out so much of the sun’s rays that the Earth’s average temperature could fall by six degrees. Sustained emissions over five to ten years, could be sufficient to trigger an Ice Age.” – Washington Post, July 9, 1971.
Now, just where did the Washington Post sensationalism come from?
From a paper published by NASA physicists Rasool and Schneider in 1971:
“For aerosols, however, the net effect of increases in density is to reduce the surface temperature of the Earth. If sustained over a period of several years, such a temperature decrease over the whole globe is believed to be sufficient to trigger an ice age.”
In other articles at the time, “aerosols” mainly meant carbon particulates emitted by burning fossil fuels. Indeed, an article published by “New Scientist” in December 2003 quoted James Hansen on increasing amounts of particulate carbon in the atmosphere causing global warming.
Hansen, the “father” of global warming hysteria, was quoted: “It causes a strong warming effect”.
For this old geologist the change from carbon causing cooling to causing global warming with no change in its place in the periodic table has been fascinating.
But to go with the mandated fad, global warming due to whatever reason could eventually diminish fears about falling iguanas.
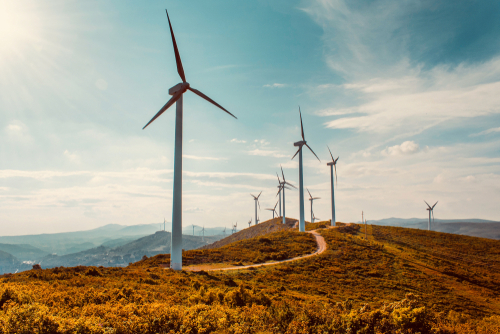
The newest and biggest wind project to date in Australia is to undergo major repairs after faults were found in its commissioning process. Wind turbines at the Coppers Gap wind farm in Australia had to be repaired or replaced before they were even put into service. (1)
The blades of one of the 123 turbines will have to be replaced entirely, while GE Catcon is also going to replace ‘generators’- referring to the equipment in the nacelle at the top of the wind tower —in a further 50 turbines.
The issues at Coppers Gap add to a terrible run of problems for some of Australia’s largest wind farms, including the delays to the commissioning of the 336MW Dundonnell wind farm, and the fall of a blade from one of its turbines that stopped all production for several days.
Other major wind farms are also taking much longer to be completed than originally expected. Coopers Gap has been running about one year behind its original schedule. 1
Further, the 420MW Macarthur wind farm delivered a relatively low capacity factor of just 26 percent last year.
This kind of story is common in many wind farms, and is further proof that they are nothing but horrendously expensive virtue signaling white elephants, reports Andy Rowlands.
Solar Panels on Households
In Australia, as many as a quarter of solar panels pose a high or severe ‘electrical safety’ risk. Since there are two million households with solar panels, that’s half a million homes sitting under a live problem. 2
A national audit revealed that between 21 and 26 percent of small-scale rooftop solar installations inspected every year since 2011 had been found to have faulty wiring and unsecured panels. Some posed a ‘severe risk’ where wiring was exposed. This required units to be shut down immediately and remediated. A total of 35 licensed installation contractors have been warned they face the possibility of suspension.
Australian massive daily spikes and collapses in wind and solar power output
Then there are hailstorms. As Joanne Nova reports, here’s a problem coal fired plants don’t need to worry about. “Sydney’s recent ‘catastrophic’ hailstorm resulted in a damage bill said to top $125 million. How much of that damage is to rooftop Solar PV? The last massive hail storm in Sydney was in 1999- but there were hardy any solar panels then.” 3
Before anyone blames climate change, stories about hail the size of eggs have fallen in Sydney in 1929 and other places in 1934. Perhaps building 2 million solar panels on a continent with hail the size of tea cups was not such a good idea.
Investment Disappearing
Australian massive daily spikes and collapses in wind and solar power output have resulted in new rules about grid access for intermittent wind and solar and, much to the horror of the wind and solar industries, government is actually enforcing them. 4
Dozens of proposed wind farms and large-scale solar projects have been shelved, simply because they can’t be guaranteed of ever being able to deliver a single watt into the grid.
To their credit, it appears that investors are none too keen to hand over their cash to build projects which will never earn a dollar.
Summary
What about the canary in the coal mine? This is destined to hit California in spades as the insane legislature has made solar panels required for all new construction starting in 2020. Other states probably have similar plans. Will any learn from Australia’s experience. Want to make a bet?
References
Andy Rowlands, “Major problems with Australian wind turbines,” principia-scientific.com, November 18, 2020
Joanne Nova, “Deadly: a quarter of all solar panels pose high or severe risk,” joannenova.com.au,December 20, 2018
Joanne Nova, “Sydney hail storm: just how hail proof are those solar panels?”, joannenov.com.au, December 22, 2020
“Totally choked: Australian wind power investment suffers massive collapse,” stopthesethings.com, August 30, 2020
Carbon Dioxide CO2 is not making “ANY” dangerous changes to the global temperature!
From the attached report on climate change for November 2020Data we have the two charts showing how much the global temperature has actually gone up since we started to measure CO2 in the atmosphere? To show this graphically Chart 8 was constructed by plotting CO2 as a percent increase from when it was first measured in 1958, the Black plot, the scale is on the left and it shows CO2 going up a bit over 31.0% from 1958 to October of 2020. That is a very large change as anyone would have to agree. Now how about temperature, well when we look at the percentage change in temperature from 1958, using Kelvin (which does measure the change in heat), we find that the changes in global temperature (heat) are almost un-measurable. The scale on the right side had to be expanded 10 times (the range is 40 % on the left and 4% on the right) to be able to see the plot in the same chart in any detail. The red plot, starting in 1958, shows that the thermal energy in the earth’s atmosphere increased by .40%; while CO2 has increased by 31.0% which is 78 times that of the increase in temperature. So is there really a meaningful link between them that would give as a major problem? The numbers tell us no there isn’t.
The next chart is Chart 8a which is the same as Chart 8 except for the scales which are the same for both CO2 and Temperature. As you see the increase in energy, heat, is not visually observably in this chart hence the need for the previous chart 8 to show the minuscule increase in thermal energy shown by NASA in relationship to the change in CO2. Based to these trends, determined by excel not me, in 2028 CO2 will be 428 ppm and temperatures will be 15.0o Celsius and in 2038 CO2 will be 458 ppm and temperatures will be 15.6O Celsius. This is what the data shows no matter what the reasons are, so I have no idea how the IPCC gets to predict that the world will end in ten or even twenty years.
The full 40 page report explains how these charts were developed and why using NASA and NOAA data that are used without change to prove that The New Green Deal is not required and any attempt to complete that plan will be a worldwide disaster.
Carbon Dioxide CO2 is not making “ANY” dangerous changes to the global temperature!
From the attached report on climate change for October 2020Data we have the two charts showing how much the global temperature has actually gone up since we started to measure CO2 in the atmosphere? To show this graphically Chart 8 was constructed by plotting CO2 as a percent increase from when it was first measured in 1958, the Black plot, the scale is on the left and it shows CO2 going up a bit over 31.0% from 1958 to October of 2020. That is a very large change as anyone would have to agree. Now how about temperature, well when we look at the percentage change in temperature from 1958, using Kelvin (which does measure the change in heat), we find that the changes in global temperature (heat) are almost un-measurable. The scale on the right side had to be expanded 10 times (the range is 40 % on the left and 4% on the right) to be able to see the plot in the same chart in any detail. The red plot, starting in 1958, shows that the thermal energy in the earth’s atmosphere increased by .40%; while CO2 has increased by 31.0% which is 78 times that of the increase in temperature. So is there really a meaningful link between them that would give as a major problem? The numbers tell us no there isn’t.
The next chart is Chart 8a which is the same as Chart 8 except for the scales which are the same for both CO2 and Temperature. As you see the increase in energy, heat, is not visually observably in this chart hence the need for the previous chart 8 to show the minuscule increase in thermal energy shown by NASA in relationship to the change in CO2. Based to these trends, determined by excel not me, in 2028 CO2 will be 428 ppm and temperatures will be 15.0o Celsius and in 2038 CO2 will be 458 ppm and temperatures will be 15.6O Celsius. This is what the data shows no matter what the reasons are, so I have no idea how the IPCC gets to predict that the world will end in ten or even twenty years.
The full 40 page report explains how these charts were developed and why using NASA and NOAA data that are used without change to prove that The New Green Deal is not required and any attempt to complete that plan will be a worldwide disaster.
Click on the link below for the full report that you can download.
First, San Francisco just banned Natural Gas in any new buildings, requiring them to rely on the electric grid instead. The city’s board of supervisors unanimously approved the ordinance which will apply to more than 54,000 homes and 32 million square feet of business space that was approved for construction. They do not have the power generation to support that and a power grid failure means even the food people have will go bad without electricity and they cannot even cook on a stove or microwave. What do you do if power is out for weeks?
Secondly, San Franciso passed the CEO tax. The tax applies to companies in which the highest-paid managerial employee earns 100 times more than the median worker in San Francisco. Businesses above this 100 to 1 threshold pay an extra surcharge on their gross receipts. The greater the inequality, the bigger the tax. Companies with an executive earning 200 times the median worker in the city incur a 0.2% tax, all the way up to 0.6%. For large firms (businesses with more than $1 billion in gross receipts and 1,000 employees nationwide), the tax is applied to up to 2.4% of its city payroll expenses. The bill is expected to bring in between $60 million and $140 million per year, about 0.4% to 1% of the city’s annual budget.
This tax is really problematic. It is a tax on the company rather than the executive. But generally, these large pay-outs are stock options – not cash. So if the stock doubles in price, the CEO would make a theoretical windfall and the company would pay a surcharge which could impact the shareholders and could even reduce the workforce.
I have created this site to help people have fun in the kitchen. I write about enjoying life both in and out of my kitchen. Life is short! Make the most of it and enjoy!
This is a library of News Events not reported by the Main Stream Media documenting & connecting the dots on How the Obama Marxist Liberal agenda is destroying America