Image

FROM ONE VET TO ALL THE OTHER VETERANS BACK TO THE BEGINNING — THANK YOU FOR YOUR SERVICE!


vetrans day

Image

Democrats are all about Deception


funny-meme

Image

A New Credit Card


7DE55EB9F1FA42BAB7E2D0A9A7EB37E5

Image

In God We Trust, not Obama


B_VIFmbU4AAfjAS

Image

Obama’s Foreign Policy


obama-full-painting

John McNaughton Latest Work — Obama Foreign Policy

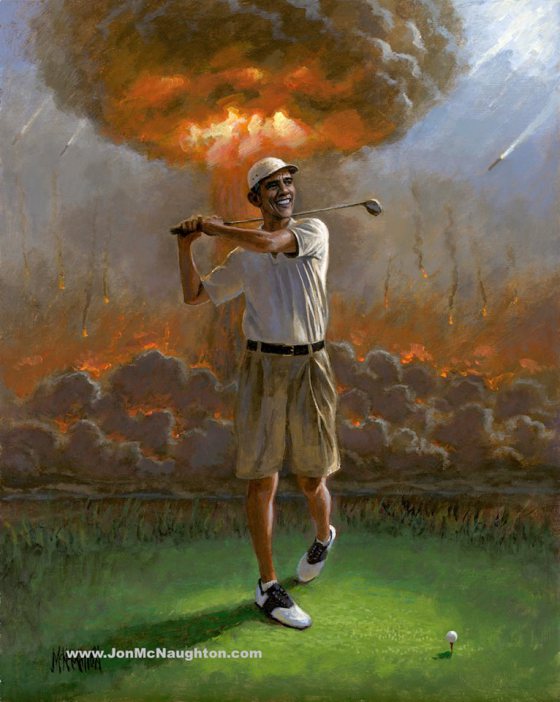
Is the world a safer place since Obama was made President of the United States?
I felt a need to paint a new image to capture the delicate situation we face as Americans.What has happened since he’s been in office?  Where is the stability and peace in Egypt, Libya, Syria, Yemen, Iraq, Afghanistan, Pakistan, Crimea, Ukraine, Russia, Iran, Israel, Palestine, China and North Korea? How are our veterans doing? Are American citizens safer as they travel abroad?

When the balance of the world seems to stand on the edge of a knife, where is our President?

I hope this painting will not become prophetic in its meaning.

Since Obama has been President he has played over 200 rounds of golf.

THIS is not a game.

This is Obama’s Foreign Policy.

What has he done?

·      Weakened Egypt and the rise of the Arab spring. http://solutions.heritage.org/middle-east/ http://foreignpolicy.com/2013/04/02/why-obama-failed-in-the-middle-east/

·      Toppled Libya, which led to the emboldening of Al Qaida and the Benghazi Massacre. http://www.washingtonpost.com/opinions/marc-thiessen-where-was-obama-during-benghazi-ask-the-white-house- http://www.breitbart.com/national-security/2014/05/02/the-6-biggest-lies-about-benghazi/ diarist/2014/05/12/70c6b898-d9cc-11e3-bda1-9b46b2066796_story.html

·      Embarrassment in Syria and the “red line.” http://www.cnn.com/2013/09/09/opinion/cupp-obama-syria/

·      Gave away multiple Guantanamo Bay prisoners who returned to ISIS and Al Qaida for an AWOL soldier who caused the lives of American servicemen. http://www.judicialwatch.org/blog/2014/06/reports-show-danger-releasing-gitmo-terrorists-obama-frees-5/

·      Demoralized our military and has done little or nothing to strengthen the VA hospitals even after exposed corruption. http://militaryadvantage.military.com/2014/06/why-is-the-va-scandal-a-foreign-policy-issue/

·      Removed missiles from Ukraine and opened the door to Russian forces. http://www.politifact.com/punditfact/statements/2014/mar/23/mitt-romney/romney-obama-stopped-missile-defense-shield-gift-r/

·      Emboldened Iran’s nuclear plans at Israel’s expense. http://www.washingtonpost.com/opinions/the-emerging-iran-nuclear-deal-raises-major-concerns-in-congress-and-beyond/2015/02/05/4b80fd92-abda-11e4-ad71-7b9eba0f87d6_story.html

·      Continued to insult Israel and create a volatile environment in the Middle East. http://www.politico.com/story/2015/01/barack-obama-benjamin-netanyahu-israel-114750.html

·      Done little to oppose North Korea. http://www.cnn.com/2015/01/04/politics/robert-menendez-hits-obama-on-north-korea-cuba/

·      Removed troops from Iraq without an exit strategy. http://www.foreignaffairs.com/articles/142204/rick-brennan/withdrawal-symptoms

·      Removal of troops from Afghanistan without an exit strategy. http://www.washingtonpost.com/opinions/marc-thiessen-will-obama-repeat-his-iraq-mistakes-in-afghanistan/2014/06/23/fd935084-facd-11e3-b1f4-8e77c632c07b_story.html

·      Improper use of drones in Pakistan and Yemen with many civilian casualties. http://www.washingtonsblog.com/2015/01/american-drones-killed-civilians-bombing-cambodia-vietnam-war-died-911.html

·      Killing of American citizens abroad in the name of national security. http://www.nytimes.com/2010/04/07/world/middleeast/07yemen.html

·      Soft on ISIS in the wake of horrific attacks in the Middle East. http://www.nairaland.com/1890136/why-obama-soft-isis

·      Insistence not to mention radical Islam as a major threat to American interests. http://conservativetribune.com/oliver-north-enemy-radical-islam/

Image

What if Obama had been President on December 7, 1941


image002

Image

I am the worst terrorist the United States will ever face!


! Am OBAMA

Image

INEPTOCRACY


screen-shot-2015-01-30-at-4-44-26-pm

Image

Tribute to those that Serve!


PassingtheColors

Image

Issues with the IPCC Methods, Part II


The IPCC climate models as discussed here have many issues most as a result of the method used to develop them e.g. showing that increased levels of Carbon Dioxide “would” increase the global temperatures to unacceptable levels. The models were started in earnest around 1988 when the IPCC was formed and much of this work was from James Hansen of NASA.  In 1988 he presented to the US Congress his estimate of what the increasing levels of Carbon Dioxide from the burning of carbon based fuels would do to the world’s climate; these were presented as Scenario A (worst case), B (expected case) and C (unlikely low estimate). Scenario B was the focus and its projections were shown from 1958 (when the first Carbon Dioxide levels were published by NOAA) to 2020 in the form as described in section four; after the formation of the IPCC and the global Climate models were developed they added to Hansen’s work and that plot (shown in red in Figures 1 and 3) is what is used here. It appears to be a form of a log function (black plot with the equation for it shown superimposed over the red plot) with a primary focus on the level of Carbon Dioxide (values listed in the IPCC table “ar4 forcings” also a form of a log function) which is assumed to be the proximate cause of global temperature changes.

IPCC-01

Although Carbon Dioxide did play a part, the real reason was that the long and short climate trends previously described in point seven were both moving up together; more on this in the next section.  This can be seen in the IPCC estimated global temperatures shown in Figure 1 as the red plot when it is compared from 1958 to 2000 with the yellow NASA-GISS temperature plot (orange trend line added with equation) where the red IPCC plot moves in synchronization with the yellow NASA-GISS plot of estimated global temperature. However, after 2000 things began to change as the yellow NASA-GISS plot, and the orange trend began to move down while the red IPCC plot and trend continued to move up.  Thirteen years have now passed and the IPCC still has no explanation for why global temperatures are trending down not up: so with no explanation we can say that the model is flawed and needs additional work before any estimates can be believed. This is clearly shown in Figure 2 where we added a high and low band of .15 degrees Celsius to the trend of the IPCC plot and they represent a deviation of +/- 1.0% from the mean. This shows where we can reasonably expect NASA-GISS temperatures to fall within; the IPCC has only 42 of 56 years between the high and the low bands for 75.0% inside the bands. The last time the NASA-GISS plot was inside the IPCC GCM bands was 2007 and the last time it was near the mean was 2002. There is no doubt that there is something seriously wrong here.

IPCC-02