
Believe what is written here for it is true this is a battle for your very soul and if you ignore the truth done complain later when they come for your head!
Monthly Archives: September 2014
Some Deep Intellectual Dishonesty Amid The Nonsense About Syrian “Moderates” And Funding Them….
The truth is there are NO MODERATE Muslims if we define a moderate as one that can live with Christians or Jews or any other faith without trying to convert them or if they can kill them. The teachings of Islam say that they MUST do that!
PART I – Debunking The Myths, Talking-Points and Agenda Driven Nonsense Around The Mike Brown Shooting…
Good work here!
ISIS Launches Assault on Baghdad
If the Shia majority in Baghdad go after the local Sunni that will result in a back lash. This is text book insurgency!

Climate.gov embraces the “cartoon science” of Mann and Marcott
These guys and gals got their PhD’s from DreamWorks LLC!

American Muslim Who Murdered N.J. Teen and Three Others Says Killings Were An Act of Jihad “Vengeance” Against U.S.
Islam teaches Jihad and the followers of Islam, Muslims, go out to due their duty — which is to kill anyone that is not of their religion.
by PAMELA GELLER ~
 Brendan Tevlin
How many other Muslims in the US are one step away from active jihad?
Prosecutors say that Brown is a devout Muslim who had become angered by U.S. military intervention in the Islamic world, which he referred to as “evil.”
Here’s more on thejihadi I reported on yesterday. Nowhere in the initial reportage was jihad or Islam even mentioned. It is only when the murderer declares his jihad that the media is forced to report it.
America, the media is your enemy.
Accused killer says Livingston teen’s murder was ‘vengeance’ against U.S. NJ.comAugust 21, 2014
WEST ORANGE – The man accused of gunning down a Livingston teenager in his car earlier this summer told investigators the murder was an act of retribution for U.S. military action against Muslims in the Middle East.
According to court documents filed Wednesday in Washington state…
View original post 1,284 more words
Cryosphere Makes Climate Scientists Cry
These cool or cold periods last around 30 some years and we are not even half way into this one so the “believers” will need to keep coming up with ways to explain what we see is not happening for a long time!
Arctic sea ice area has increased by 2,000 Manhattans over the past five days, and is up 58% over two years ago.
Global sea ice area is averaging 3,000 Manhattans above normal since the start of 2013, and has been above normal 62% of the time.
arctic.atmos.uiuc.edu/cryosphere/timeseries.global.anom.1979-2008
Climate experts say the poles are melting down, because their funding depends on spreading propaganda which supports Al Gore’s global warming scam.
Analysis of Global Temperature Trends, August 2014
What really going on with the Climate?
The analysis and plots shown here are based on the following: first NASA-GISS temperature anomalies (converted to degrees Celsius) as shown in their table LOTI, second James E. Hansen’s Scenario B data, which is the very core of the IPCC Global Climate models and which was based on a CO2 sensitivity value of 3.0O Celsius, lastly, a plot based on an alternative climate model designated ‘PCM’ and based on a sensitively value of .65O Celsius. To smooth monthly variations a 12 month running average is used in all the plots. This information will be shown in four tables and updated each month as the new data comes in about the middle of the month. Since no model or simulation that cannot reasonably predict that which it was design to do is worth anything the information presented here definitively proves that NASA, NOAA and the IPCC just doesn’t have a clue.
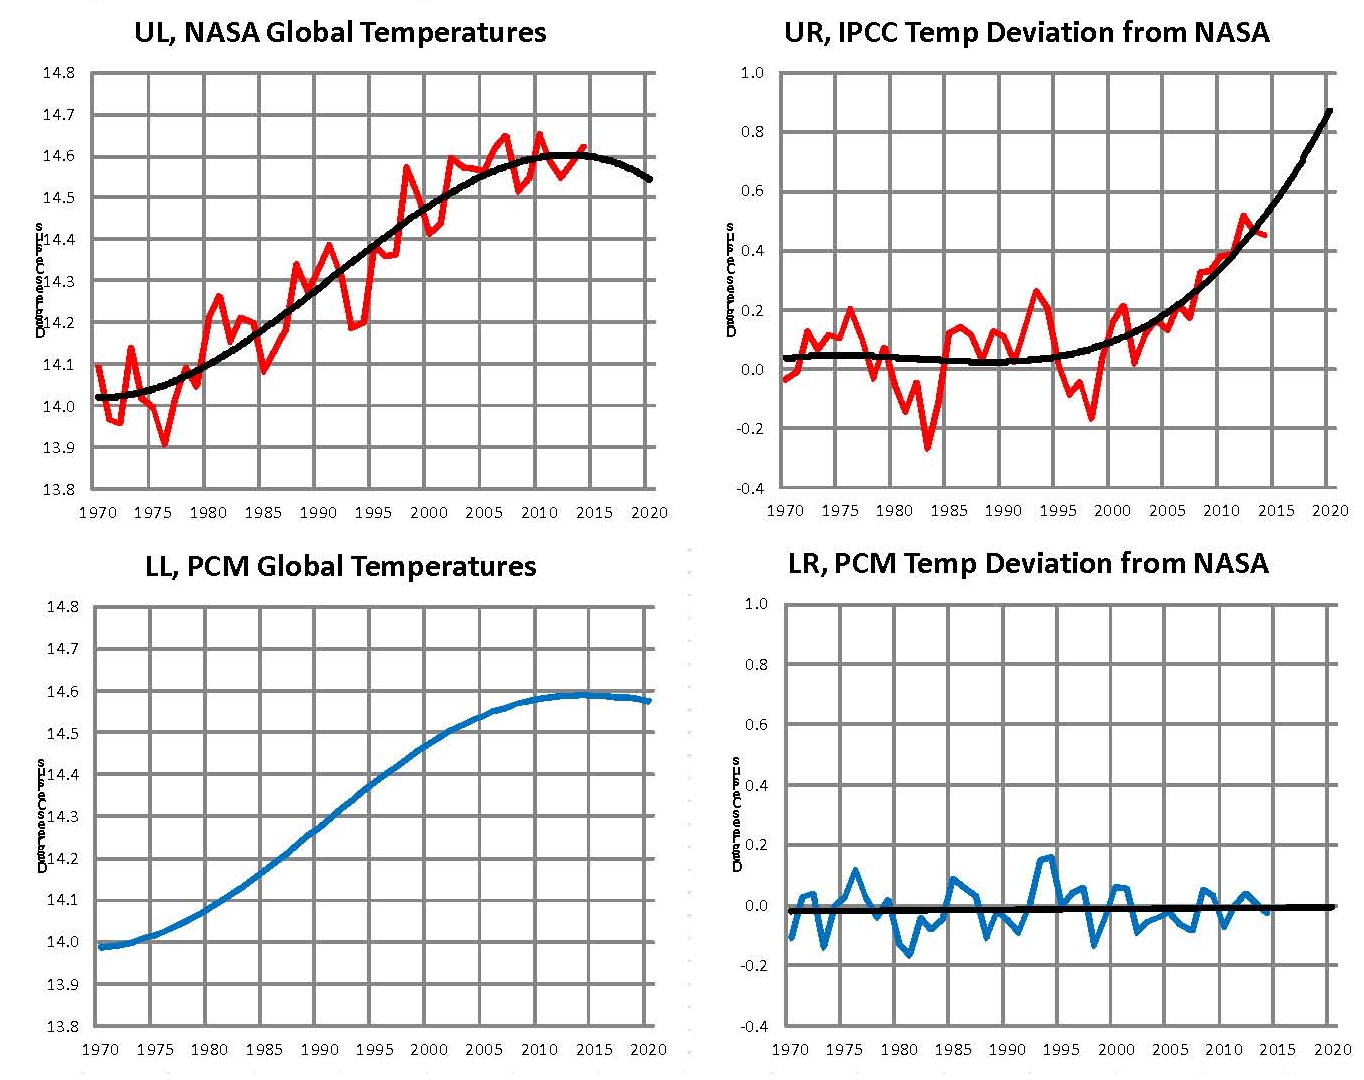
The first plot, UL is a plot of the NASA temperature anomaly converted to degrees Celsius and shown in red with a black trend line added. There has been a very clear reversal in the upward movement of global temperatures since about 2001 and neither the UN IPCC nor anyone else has an explanation for this. Since CO2 has continued to increase at what could be argued an increasing rate this raises serious doubts about the logic programmed into all the IPCC global climate models.
The next plot UR, also in red, shows the IPCC estimates of what the Global temperature should be, based on Hansen’s Scenario B, with the NASA actual temperatures’ subtracted from them. Therefore this plot represents a deviation from what the Climate “believers” KNOW what the temperature should be; with a positive value indicating the IPCC values are higher than actual and a negative value indicating the IPCC values are lower than actual, as measured by NASA. A black trend line is added and we can clearly see that the deviation from expected is increasing at an increasing rate. This makes sense since the IPCC models project increased temperatures based primarily on the increasing level of CO2 in the earth’s atmosphere. Unfortunately, for them, the actual temperatures from NASA are trending down (even as they try to hide the down ward movement with data manipulation) since other factors are in play, therefore each year the gap between them widens. Since we have 12 years of observations’ showing this pattern it becomes hard to justify a continuing belief in the IPCC climate models, there is obviously something very wrong here.
The next plot LL shown in blue is based on the equations in the PCM climate model described in previous papers and posts here and since it is generated by “equations” a trend line is not needed. As can be seen the PCM, LL, and the NASA, UL, trend plots are very similar the reason being that in the PCM model there is a 68.2 year cycle that moves the trend line up and then down a total of .30O Celsius (currently negative .0070O Celsius per year); and we are now in the downward portion of that trend which will continue until around 2035. This short cycle is clearly observed in the raw NASA data in the LOTI table going back to 1880. Then there is a long trend, 1052.6 years with an up and down of 1.36O Celsius (currently plus .0029O Celsius per year) also observed in the NASA data. Lastly there is CO2 adding about .005O Celsius per year so they basically wash out which matches the current holding pattern we are in. However within a few years the increasing downward trend of the short cycle will overpower the other two and we will see drop of about .002O Celsius per year and that will be increasing until till around 2025 or so. After about 2035 the short cycle will turn up and all three will be on the upswing again. These are all round numbers shown here as representative values.
The last plot LR in blue uses the same logic as used in the UR plot, here we use the PCM estimates of what the Global temperature should be with the NASA actual temperatures’ subtracted from them. A positive value indicates the PCM values are higher than actual and a negative value indicates the PCM values are lower than expected. A black trend line was added and it clearly shows that the PCM model is tracking the NASA actual values very closely. In, fact since 1970 the PCM model has rarely been off by more than +/- .1 degrees Celsius and has an average trend of almost zero error, while the IPCC models are erratic and are now approaching an error rate of +.5O above expected.
The IPCC models were designed before a true picture of the world’s climate was understood. During the 1980’s and 1990’s CO2 levels were going up and the world temperature was also going up so there appeared to be correlation and causation. The mistake that was made was looking at only a 20 year period when the real variations in climate move in much longer cycles. Those other cycles can be observed in the NASA data but they were ignored for some reason. By ignoring those trends and focusing only on CO2 the models will be unable to correctly plot global temperatures until they are fixed.
The purpose of this post is to make people aware of the errors inherent in the IPCC models so that they can be corrected.
Sir Karl Raimund Popper (28 July 1902 – 17 September 1994) was an Austrian and British philosopher and a professor at the London School of Economics. He is considered one of the most influential philosophers of science of the 20th century, and he also wrote extensively on social and political philosophy. The following quotes of his apply to this subject.
If we are uncritical we shall always find what we want: we shall look for, and find, confirmations, and we shall look away from, and not see, whatever might be dangerous to our pet theories.
Whenever a theory appears to you as the only possible one, take this as a sign that you have neither understood the theory nor the problem which it was intended to solve.
… (S)cience is one of the very few human activities — perhaps the only one — in which errors are systematically criticized and fairly often, in time, corrected
Learning To Think Like A Progressive Scientist
You can’t be both a scientist and a progressive they are mutually exclusive!
We hear idiotic remarks all the time from experts like :
We are having 100 year rainfalls every year now
It is difficult to grasp the level of stupidity behind that remark. The odds of winning the lottery are 100 million to one. For any individual, it is a multi-million year event – yet it happens all the time.
Same story with rainfall. If you have 5,000 weather stations which have been keeping records for 100 years, odds are you will have fifty “100 year rainfalls” every year.

Our Pathetic President
I just pray that the damage this man has done can be reversed after he is out of office and a republican elected to replace him.
 By Alan Caruba ~
 The first thing you need to keep in mind is that Syria and Iraq are now just lines on a map at this point. They don’t exist as national states because the former is locked in a civil war that will replace its dictator one way or the other and the latter’s alleged government is deeply divided between the usual schism of Sunni and Shiite.
More to the point, Iraq’s government is led by men who are the friends and pawns of Iran. In a recent issue of the Iranian newspaper, Eternad, an Iranian analyst commented on the new Iraqi cabinet noting that its new prime minister “enjoys Iran’s support and spend his formative years in Iran, and continued (the operation of the Islamic al-Dawa party) until the fall of Saddam Hussein’s regime.”
That fall was the result of the war waged against Saddam by President…
View original post 769 more words
