A Technical Study in the Relationships of Solar Flux, Water, Carbon Dioxide and Global Temperatures, January 2020 Data


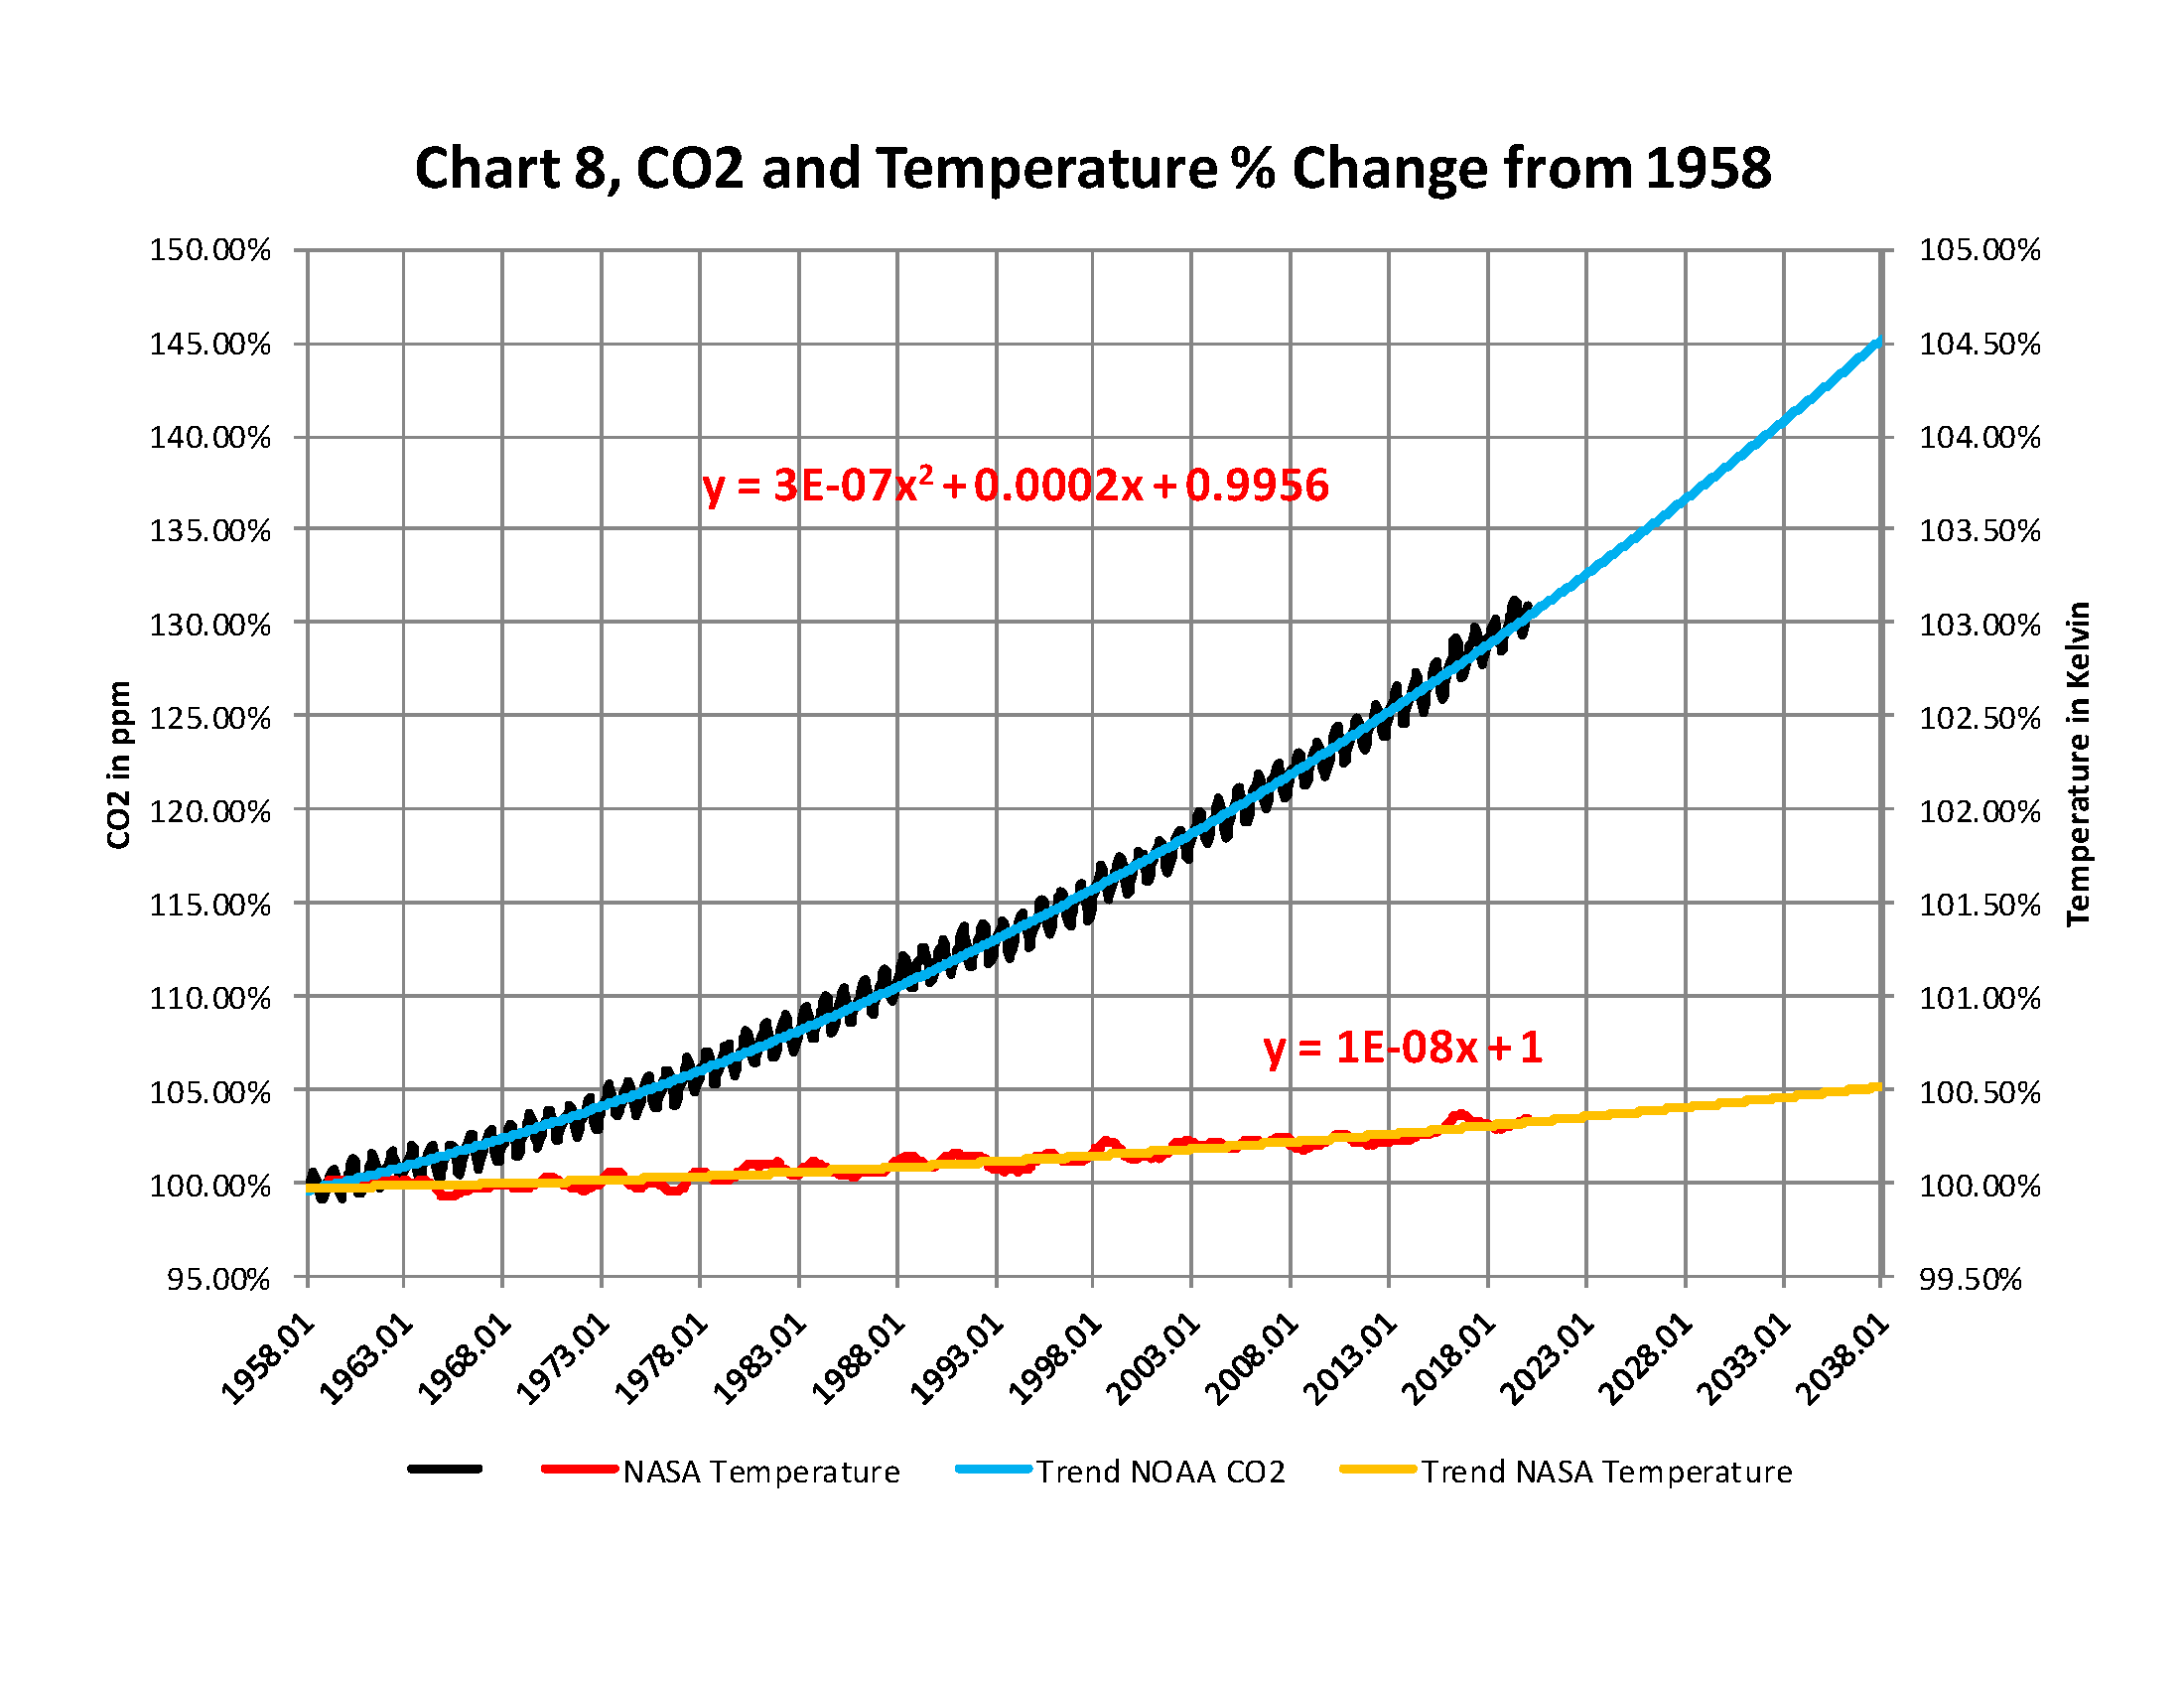
From the attached report on climate change for January 2020 Data we have the two charts showing how much the global temperature has actually gone up since we started to measure CO2 in the atmosphere? To show this graphically Chart 8 was constructed by plotting CO2 as a percent increase from when it was first measured in 1958, the Black plot, the scale is on the left and it shows CO2 going up a bit over 30.0% from 1958 to January of 2020. That is a very large change as anyone would have to agree.  Now how about temperature, well when we look at the percentage change in temperature from 1958, using Kelvin (which does measure the change in heat), we find that the changes in global temperature (heat) are almost un-measurable. The scale on the right side had to be expanded 10 times (the range is 40 % on the left and 4% on the right) to be able to see the plot in the same chart in any detail. The red plot, starting in 1958, shows that the thermal energy in the earth’s atmosphere increased by .30%; while CO2 has increased by 30.0% which is 100 times that of the increase in temperature. So is there really a meaningful link between them that would give as a major problem? The numbers tell us no there isn’t.

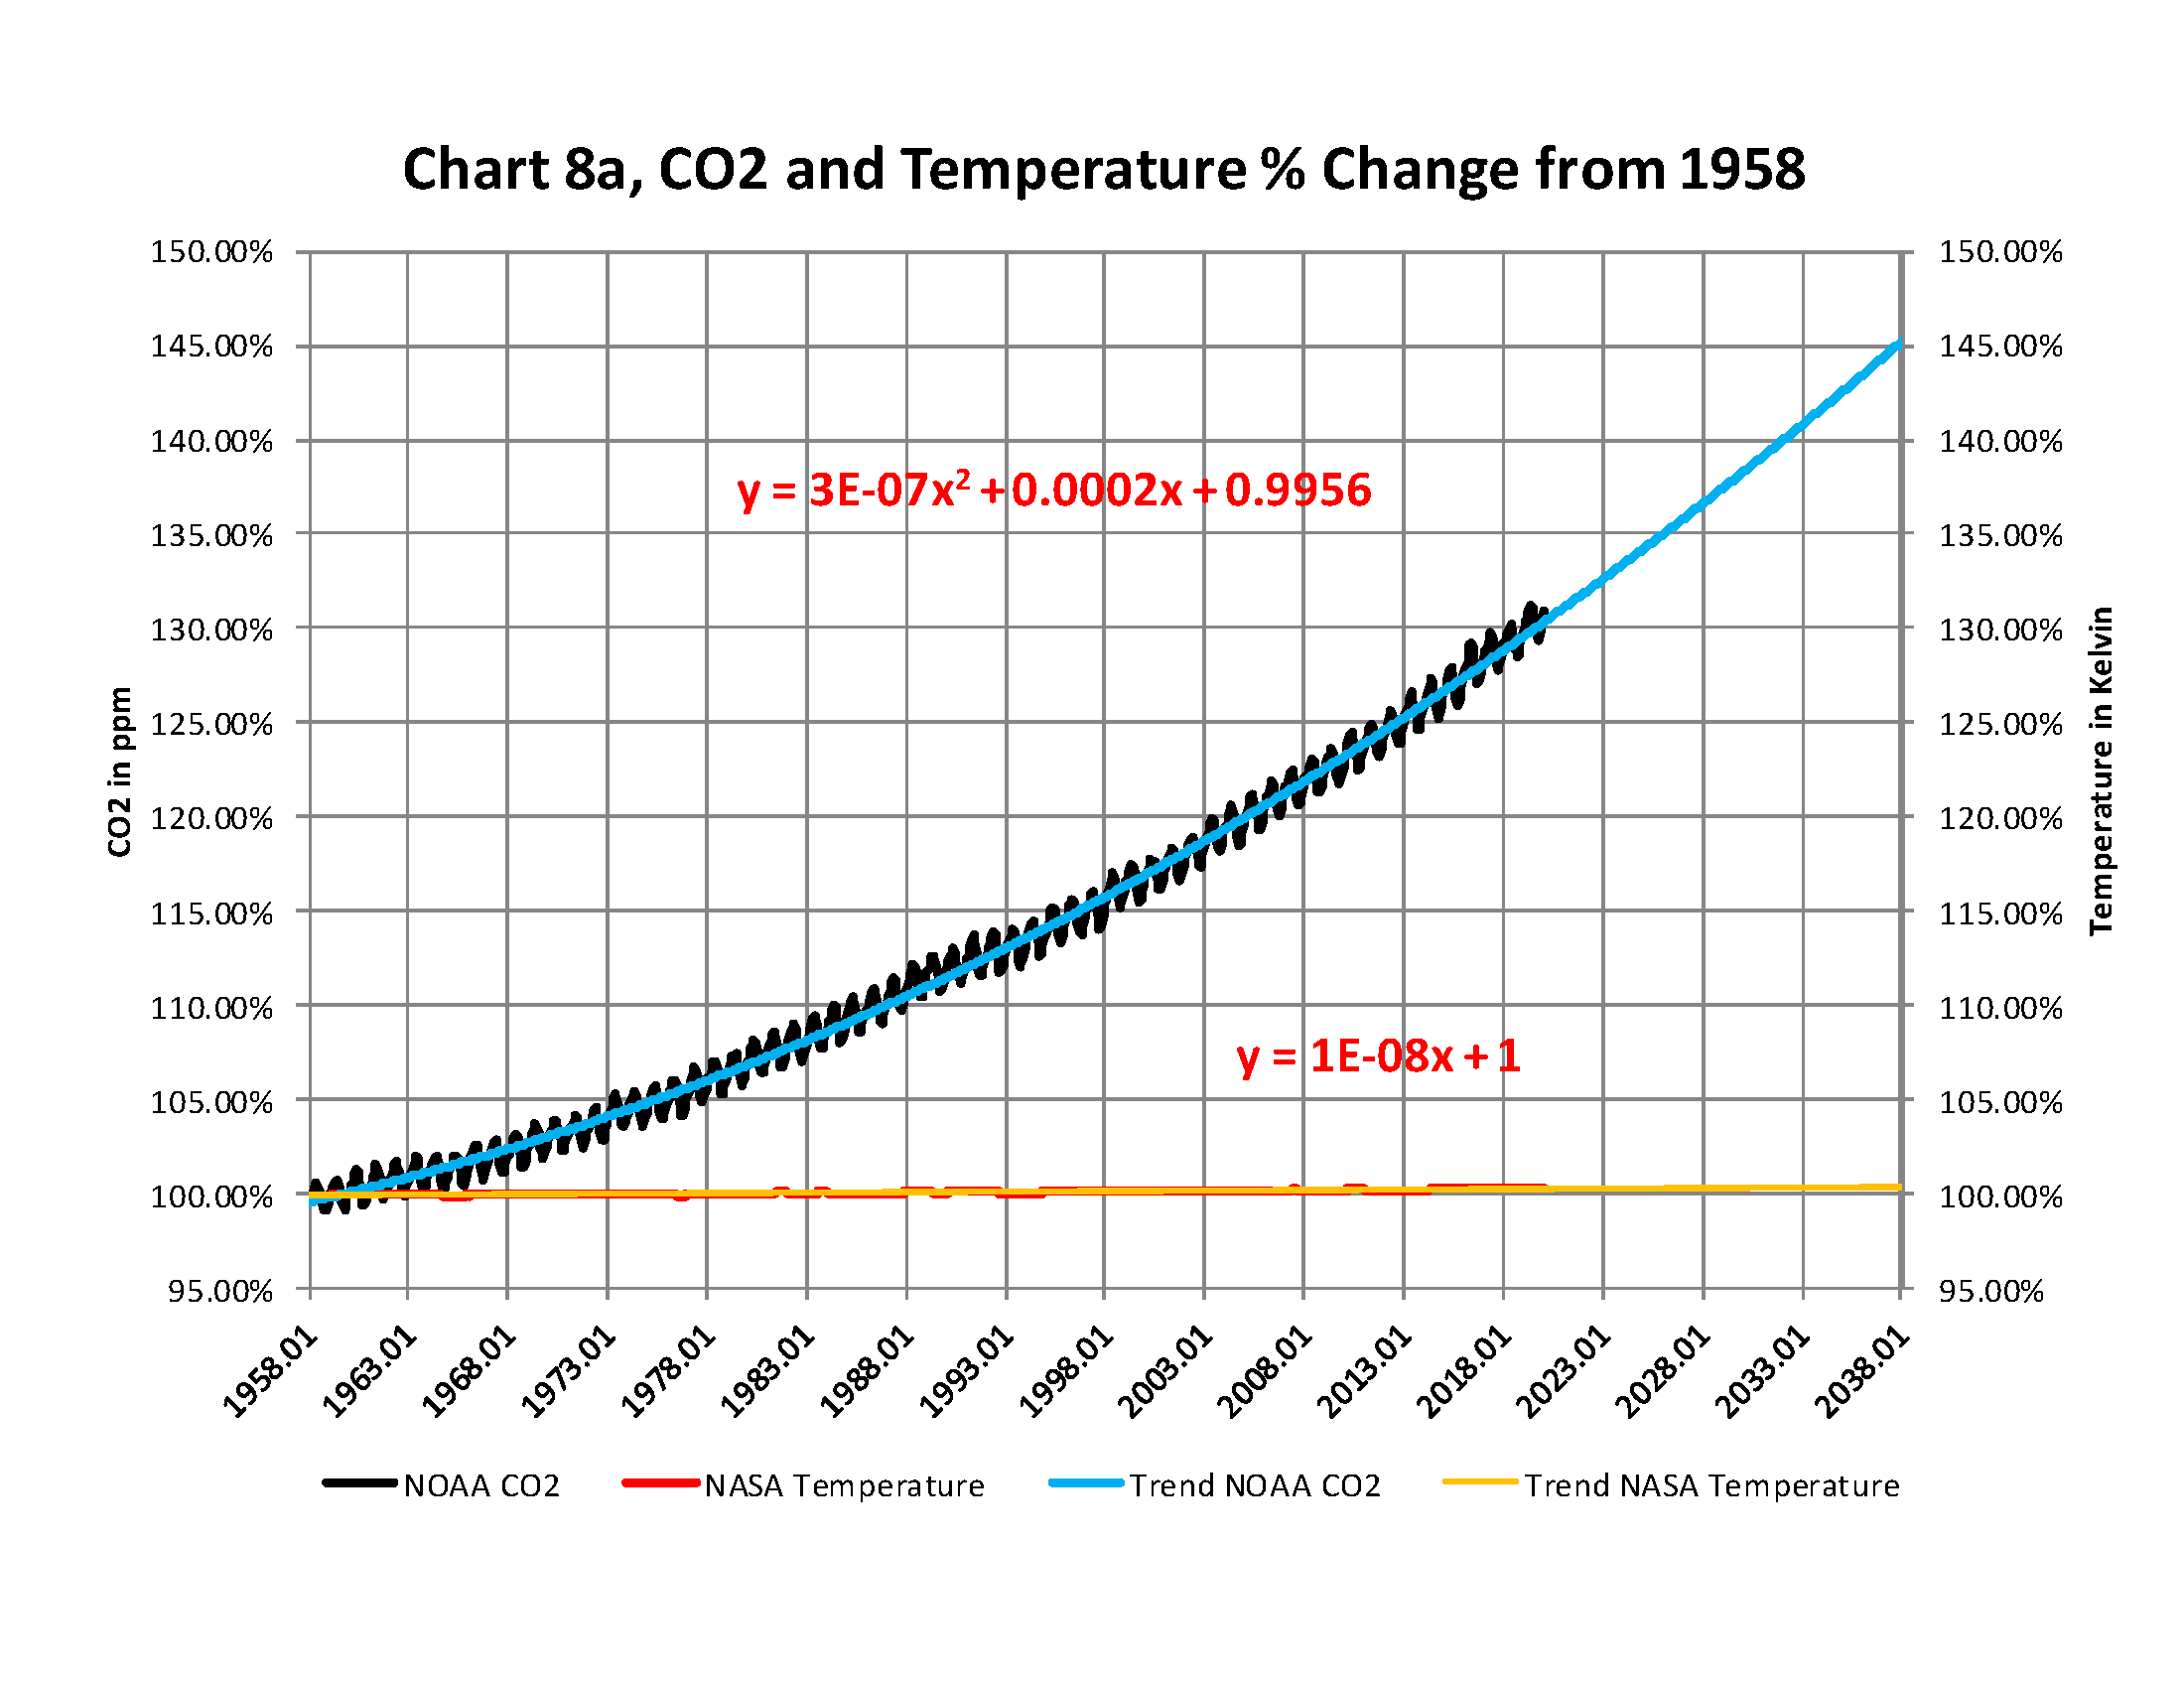
The next chart is Chart 8a which is the same as Chart 8 except for the scales which are the same for both CO2 and Temperature. As you see the increase in energy, heat, is not visually observably in this chart hence the need for the previous chart 8 to show the minuscule increase in thermal energy shown by NASA in relationship to the change in CO2. Based to these trends, determined by excel not me, in 2028 CO2 will be 428 ppm and temperatures will be 15.0o Celsius and in 2038 CO2 will be 458 ppm and temperatures will be 15.6O Celsius. This is what the data shows no matter what the reasons are, so I have no idea how the IPCC gets to predict that the world will end in ten or even twenty years.

The full 40 page report explains how these charts were developed and why using NASA and NOAA data that are used without change to prove that The New Green Deal is not required and any attempt to complete that plan will be a worldwide disaster.

Click on the link below for the full report that you can download.

BLACKBODY TEMPERATURE 2020-01

Students Demand University Dis-invest in Fossil Fuel Related Companies – School Offers to Turn off the Heat


Students at St John’s College at Oxford University were protesting that the university now disinvestfrom anything related to fossil fuel. Professor Andrew Parker  replied, “I am not able to arrange any divestment at short notice. But I can arrange for the gas central heating in college to be switched off with immediate effect. Please let me know if you support this proposal.” The protesters responded, “This is an inappropriate and flippant response by the bursar to what we were hoping would be a mature discussion. It’s January and it would be borderline dangerous to switch off the central heating.”

Seems like they want it both ways.

Climate Change & Do we Use Less CO2 than Romans to Light our Homes?


COMMENT: Marty; the Greta worshipers are really brain-dead. We just set a 77-year record low on Valentine’s Day and they say that proves its climate change caused by man. When you try to have an intelligent conversation, they simply say every scientist agrees with them. They are brainwashed beyond belief. The entire theory of CO2 and greenhouse is that it makes it warmer, not colder. They really are stupid people!

JB

REPLY: I know. Perhaps they are playing the role that the cycle demands. Civilization is collapsing and they are insisting climate is moving in the opposite direction when all the great deaths in human society come during cold periods, not warm. That is when the diseases rise like even the Black Death. The flu season comes during the cold period, not summer. There is no other explanation. They have convinced even politicians who mouth this out like Michael Bloomberg simply because he thinks that will get him the votes to overthrow Trump and destroy our economy all under the theory that we need to get to CO2 zero or the climate will burn everything up.

To me, it is just like the Biblical story of Joseph and the Pharoah. If you understand the cycle, prepare for its downturn, you survive. The climate change people are claiming there is no cycle and that climate change is all linear caused by human activity while they ignore the great cyclical swings in climate long before the Industrial Revolution. Wheat prices soared during the Little Ice Age simply because crops fail in winter.

Already, the winter wheat crop in Australia is at a 7-year low. The trend is clear, but the Global Warming crowd is determined to push their agenda regardless of the truth. We are is a serious political crisis. Today’s brand of the left-leaning politicians is all about pandering to Greenpeace and Al Gore substituting what sounds good for what actually works. We were all supposed to be dead by 2000, Then they moved it to 2010, then 2020, and now they realize that the claims we only have 5 years left sound questionable so they have switched it to the dire consequences will come in 50 years from now. A new study by the University of Arizona claims one-third of all plant and animal life will become extinct from climate change by 2070.

They concede that historically, mass extinctions have been caused by catastrophic events like asteroid collisions. This time, human activities are claimed to have set in motion the 6th extinction because of deforestation, mining, and carbon dioxide emissions. Of course, this is their opinion since there is no historical evidence that such a combination would result in a mass extinction. CO2 emissions have taken place far worse than the present. In ancient times they burned wood for heat not oil.

They also do not account for the fact that things such as producing olive oil reduce CO2 levels. For every litre of olive oil produced, 10.65kg of CO2 is extracted from the atmosphere. In ancient times, aside from burning wood for heat, the ancients burned olive oil for light. Lighting the average house for 5 hours at night regardless of the time of year produced 2.89 kg of CO2 being emitted per night. That was nearly 1,055 kg of CO2 per night and taking just the city of Rome with a population of 1 million, which was far more CO2 generated for light alone than we produce today. Half of the carbon emissions created are generated from the production of electricity. Lighting alone creates 17% of carbon emissions. Every 1KW of electricity generates 830 grams of carbon equivalents. Assuming the same 5 lights per house, today we generate 4.1 kg of CO2. The Roman Emperor Justinian I (527-565AD) enacted the first known Clean Air Act in 565AD.


Bjorn Lomborg | The Skeptical Environmentalist


8.22K subscribers

Follow the CIS on Twitter @CISOZ or find us on Facebook ‘The Centre for Independent Studies’ for more updates. http://www.cis.org.au

Princeton’s William Happer rebuts myth of carbon pollution


Dr. William Happer, professor of physics at Princeton University, summarizes his arguments about the myth of carbon pollution. It’s that myth that underlies global warming alarmists’ key arguments. Happer offered these comments during a Sept. 8, 2014, speech for the John Locke Foundation’s Shaftesbury Society


World In Midst of Carbon Drought (w/ Prof. William Happer, Princeton University) Part 1


20.4K subscribers

We’re in a carbon drought. That is according to Professor William Happer of Princeton University. The renowned physicist says when it comes to carbon dioxide, there’s more good than bad. He goes on to say most of carbon dioxide’s effect has already happened. He points to the logarithmic dependence of temperature on carbon dioxide levels. Happer says the unique properties of carbon dioxide mean that current levels would need to double for another one-degree increase in temperature and they’d have to double again for another one degree rise. — Simon Fraser University’s Centre for Dialogue presents Conversations That Matter. Join veteran Broadcaster Stuart McNish each week for an important and engaging Conversation about the issues shaping our future.

Food Prices Due to the Little Ice Age


QUESTION: What do you think about Professor Valentina Zharkhova, of Northumbria University’s department of mathematics, physics and electrical engineering, warning that the Sun is about to enter a Grand Solar Minimum  that could last for 33 years?

WG

ANSWER: Food prices rose due to the first Black Death whereby 50% of the population died which created a shortage of labor. This is what ended serfdom and began capitalism with the payment of wages. Then the weather began to turn sharply colder as the sun went into a solar minimum for a protracted period of time. This was known as the Maunder Minimum, which lasted between 1645 and 1717. This was a period where the number of sunspots was generally fewer than 50 per year compared to our modern period of warming with 40,000-50,000 sunspots over a 25-year period.

The Maunder Minimum was a very prolonged period of minimum solar activity that lasted for about 72 years. Our model is projecting an initial low coming into play around 2022. The extended trend appears to be lasting into as late as 2061, but that should not be without years that show spike highs in sunspot activity. This does not appear to be a downtrend that is persistent into 2061. There will clearly be lower highs during this period, but the trend should flip back to global warming post-2061.

Chaotic Weather


QUESTION: Marty; the weather is becoming as chaotic as the markets. We have one day heat in Antarctica and then snow in Saudi Arabia and Baghdad. Is this part of the cycle going into solar minimum?

SH

ANSWER: Absolutely. It becomes chaotic at such periods. Some places turn very cold and others hot. This is all part of the normal cycle. It unfolded that way even during the 1930s. Of course, the climate change people claim this is proof of rising CO2 levels, but they never provide evidence to support their claims that this has not taken place before. I would just for once like to see the evidence other than constantly claiming everything is proof without ever showing a historical account.

We face serious problems for diseases will rise with cold weather as will food prices

Dr Easterbrook was Never Allowed to Testify at the UN


Wheat & Climate Change


COMMENT: Hello Mr. Armstrong,

Thank you very much for all you do for us little people. I am a Basic member just trying to move my 401K in and out of the markets to try to make a little extra for retirement. Unfortunately I can only make a move once a month.
Here is today’s temperature in the oil fields of the North Slope of Alaska. We have been in cold weather shutdown for about 2 weeks. I have been here 20 years and have not seen a cold snap like this.

Best Regards,
JP

REPLY: Even the data that the entire CO2 crowd argues that in 1850s CO2 was only 240ppm was derived from ice cor samples – not actual testing. They are so gullible it is beyond belief. The CO2 measurements from ice core samples is by no means accurate for it represents more of an average. It does not show the spikes that take place with war when it surged above 400 during World War II. Moreover, they are using a period which was a 5000 year low into the ice age.

What we face is more of the impact of this upon agriculture and food going forward not to mention disease. The flu season takes place during the WINTER not summer. Global cooling is far more dangerous on so many levels.

When we look at markets, Wheat elected TWO Yearly Bullish Reversals at the end of 2019. The major resistance begin at the 800 level and our minimum target would be 860 by the top of this Economic Confidence Model come 2024. The markets are reflecting global cooling is on its way – not global warming.