Gold Perspectives


2 perspectives

QUESTION: Did gold bottom on your first benchmark? When you say adjusted for inflation, gold should make a new high by 2023, do you mean we have to wait that long?

Gold Basket 5-22-2016

ANSWER: We cannot ignore the fact that gold bottomed in dollars on the precise day of the target on the benchmark. However, you cannot look at the world only from the dollar perspective. If we are going to break the bank of the world economy, that comes ONLY with a rise in the dollar — not a decline. Raising interest rates domestically will help. We already have foreign banks opening branches in the USA so they can park money in the excess reserves at the Fed and collect 0.25%. So even a break for gold in dollars under $1,000 does not mean new lows in other currencies. For a real bull market to form, we need gold to rise in all currencies — not just dollars.

Gold 1980 High

Now look at gold for the high of 1980. You see a unified major high. While the gold promoters kept yelling it would rally and make new highs, it fell for 19 years into the final low for 1999. Look closely at these charts. You can see gold declining sharply in yen for example. It was holding in pounds, reflecting the weakness in the pound rather than the strength of gold.

Gold 1999 Low

IBEUUS-Y TEK TO 2020 1-22-2016Ok, let us now turn to the 1999 low. We do not see a unified low. There is a very curious development. Gold in euros bottomed ahead of everything else the week of January 5, 1998, which was the beginning of the euro. When we ran our global correlated models, what popped up was a very bearish expectation for the euro despite the media being paid to cheer it up. You even had the dollar haters cheering that the euro would kill the dollar and they would become millionaires overnight.

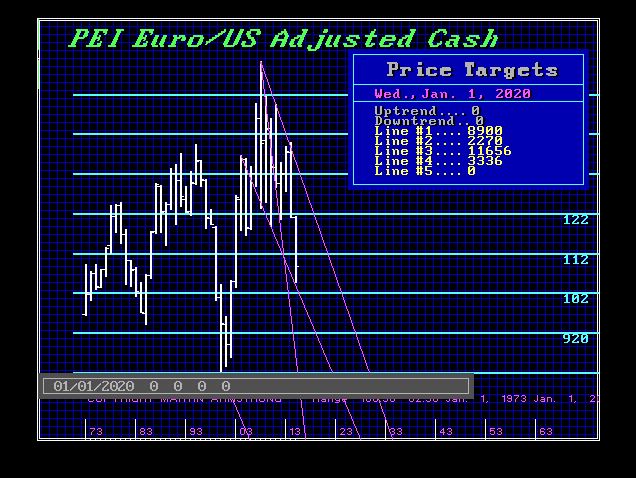
Now look at the euro chart. We have recreated the euro using the formula for entry and not the ECU which included the pound previously. The major low was in 2000, and the previous high was in 1995. The euro began in a free fall, crashing to test the 80 cent level in 2000. This contributed to the U.S. DOT.COM bubble for all the money was pouring into the USA in fear of Europe, despite the media talking the currency up.

The fact that gold bottomed on our model in the euro the first week of 1998 demonstrated that the euro would fall out of bed. This illustrates how we simply MUST look at everything in the world. Trying to forecast anything in isolation is foolhardy.

Swiss Peg 2011

Now look at the above chart again and you will see why the Swiss attempted a peg and why it broke. You do not see gold bottom in Swiss francs until the week of October 23, 2000 — about a full year past the U.S. dollar low and almost two years after the gold low in the euro. On September 6, 2011, the Swiss franc effectively adopted a euro peg with the Franc and ended its floating independence. Our model clearly warned that the Swiss peg would collapse. They sought to freeze the Swiss exchange rate at 1.20 francs to the euro with no upper boundary in place. The Swiss National Bank committed to maintaining this exchange rate to ensure stability. However, they were forced to abandon the peg on January 15, 2015, costing every Swiss citizen a fortune in the process of 6250 francs per person because capital fled to the Swiss and the dollar trying to escape the euro.

There has been nothing to negate the fact that gold in dollars can still make a new low under US$1,000. Keep in mind, that we must approach this from an international perspective. We will be addressing gold in the various currencies in this year’s edition of the Gold Report.

Confused? When Will This End?


Confused Man

QUESTION: Dear Martin, First of all, thank you for your daily blogs. First thing I read every morning. I can’t wait to attend Novembers Orlando conference. My question is about the inverse relationship of Gold(precious metals) and the Dollar. Looking at historical charts it would suggest that we may continue to see a price decrease in Precious Metals as the value of the dollar rises, deflation. This will continue until the Government panic sets in around 2021-2023 as your ECM tells us. Then serious lift off of Gold may occur as a new monetary system sets in and people want to get rid of dollars because of the complete loss of confidence in government and the future of the US monetary system.

Would love your input and thoughts.

D

ANSWER: There is no question that we should see deflation overall moving into 2020. But this is a different kind of deflation. This is capital contracting and hoarding so you will probably see asset prices rise, but GDP actually continue to contract. The classic “inflation” people talk about is rather narrow-minded. They tend to see waves of only demand inflation when people are rushing to buy things. This is associated with hyperinflation, but that is really when the collapse in confidence unfolds in a government. That can take place in the peripheral small economies like Zimbabwe or the collapse of a government post-war as in Germany and other Eastern European nations post WWI. It does not unfold in the core economy arbitrarily while others survive. It always comes from the outside in.

Now, let us look at cost-push inflation such as we saw with the OPEC crisis. They just raised the price of oil so the dramatic rise in the cost of production created the recession, but demand contracted. So prices can rise from a ratcheting up of cost which can be both private like OPEC or government with taxes.


00:00
01:16


Here you have Larry Summers, the father of NEGATIVE INTEREST RATES, admitting he cannot forecast the business cycle. Thanks for the many offers to buy him a seat at the WEC. But he looks at the world through the eyes of power to change what the free market does. He has no interest in understanding how the free markets function. So this is what we are faced with. People who think they can force the economy into doing whatever they would like to see happen. It will NEVER work. If they cannot forecast, how is it possible to create a trend they do not understand?

Carrying the World-rBecause they lack any real world experience, it NEVER dawned on these people that there are two sides to every coin. They are trying to manipulate the world economy yet they do not understand how it even functions. Mr Negative Interest rates has set in motion the collapse of socialism for keeping interest rates low, he has wiped out the pension funds. So now that they created that next crisis problem, the next solution they are proposing is to seize everyone’s retirement fund so they can bailout their own.

MONCRS-1
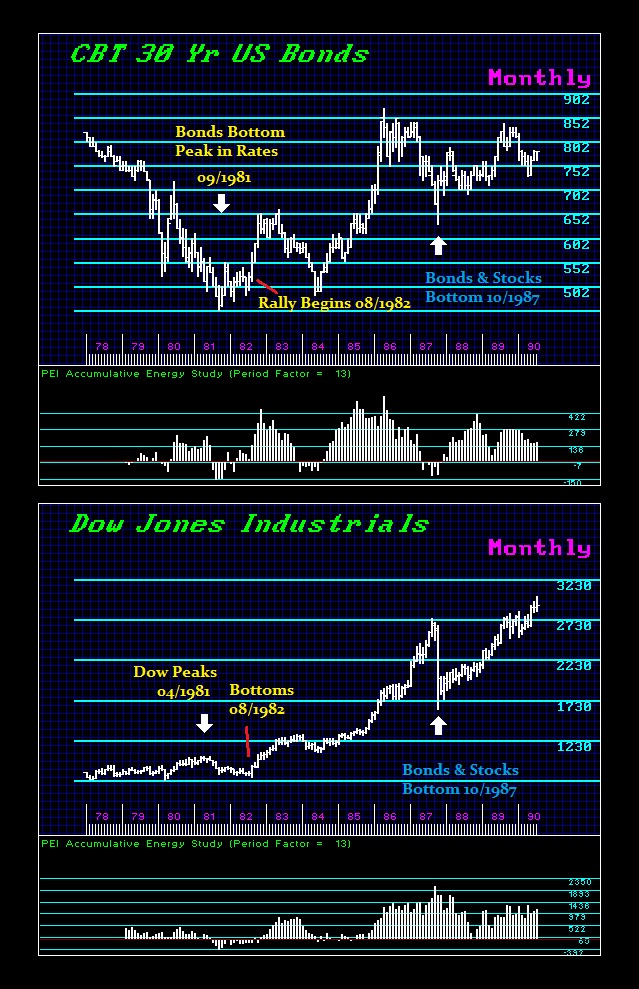
Many of our old clients will remember this chart we published back in 1991 showing the 18 Year Monetary Crisis Cycle which picked the 1985 high in the dollar. The next target was 2003 and that was the breakout against the dollar following 2002, which was the low in the DOT-COM Bubble. The British pound took off from 1.40 reaching about 1.80 in 2003 and kept going into a high in 2007 at 2.1151. The next target will be 2021. Keep in mind that these previous targets like 1949 and 1967 were breaks in the fixed exchange rate system. Since then, we are in a floating exchange rate system so these now tend to pinpoint the start of problems rather than the end.

As far as gold, 2016 would complete 5 years down from the intraday high in 2011. Unfortunately, there is a split with the highest closing being 2012. That means the 5 year bear market correction may not end until next year. There can still be a dramatic swing that wipes out every one dropping to new lows and then wildly breaking out to new highs leaving the bulk of the people confused and constantly trying to sell the rally, which provides the fuel to rise further. That is exactly what is unfolding in the US share market. You have countless people calling for a 80-90% drop arguing the market is too “rich” at this level, but they are not looking at the alternative. Bonds?

We will look at this question in detail at the Conference. We have to correlate the entire world to see the truth. Then we can lay down the markers. Clicking them off  one by one allows us to see the trend confirming its direction for the whole. There is no doubt about it that the door opens for a Monetary Reform in 2018. We are still in the staging period so we have to look at the whole to comprehend the trend.

Paradox of the Bell Curve


Paradox of Bell Curve

QUESTION: Mr. Armstrong; On the one hand you show the debasement of the Roman currency, but then you say there was also massive hoarding and deflation. Can you explain how do you get deflation with debasement?

Thank you for the the mind food

PH

Gresham Sir ThomasANSWER: It may seem to be a paradox, but everything unfolds like a bell curve. This is why you do not get the same result by simply moving in a straight line. This is the same thing we are experiencing currently under Quantitative Easing by central banks. We have increased the money supply, but we are also moving toward negative interest rates and this promotes hoarding. People have not been investing. They have been sitting on the sidelines trying to figure out what to do.

Sir Thomas Gresham made the observation that debasing the currency results in bad money drives out good. But what does that really mean? What he is saying is that people then start hoarding the old money. It may be a paradox, but debasement does not cause hyperinflation, it causes deflation because the vast money supply that was circulating is hoarded. Therefore, the government needs to further debase desperately trying to keep a sufficient degree of money in circulation. The more it debases, the more people hoard. As people hoard, they contract from commerce and GDP contracts. This results is a reduction in tax revenue, which then causes government to further debase to make up shortfalls in revenue.

Roman-Hoard-Britain

When you then introduce a collapse in confidence within government, then if people no longer “feel” secure, they then hoard even the based currency. This is why we find so many hoards of debased Roman currency during the chaotic 3rd century.

It is a curious paradox. Right now, people are hoarding as are the banks and corporations. It is hard to hoard paper currency for you will not be able to distinguish between old and new. This means that the hoarding will migrate ti tangible assets, shares, gold, silver, and antiquities.

The Dow & the Confusion


DJIND-W 5-19-2016

The Dow does not need to break last year’s low. That was accomplished in the NASDAQ and S&P500. Nothing has changed there. The entire interest rate issue has far too many people brainwashed. No doubt, they would initially sell. However, the market will rise with higher interest rates as it has always done historically. Therefore, as shorts build, we can easily create a bear trap and that is the fuel to rally again. This is the churning we are in until it appears at least after September.

This time, we have a far more serious problem with where to put money – big money. Stocks are the modern-day version of what what gold use to be decades again when you could jump on a plane with a suitcase full and sell it wherever you landed. Today, metal detectors prevent that from taking place. Stocks are being used to move money but they must be the high-end shares that are traded globally (see article posted on Egypt).

There is ABSOLUTELY NO INDICATION yet that we are in a bearish trend poised to break last year’s low in the Dow. Another retest of support – YES.  Breaking last year’s low would ONLY be indicated with a monthly closing beneath 16000 and prior to August. That said, we have a more important number for month-end at 17579 followed by 17210. A May closing below 17210 would signal a possible test of the 16000 level in the months ahead.

Nevertheless, it is the first Minor Weekly Bearish Reversal in the Dow lies at 17434 which we have flirted with on Thursday. We need a closing below this today to suggest a correction is unfolding. However, make no mistake about it, the next critical area is 17120, which happens to be a Daily and Weekly Bearish Reversal. That is the level to watch for a serious short-term break.

PE Ratio 2007-2016


Keep in mind that people continue to think this market is “rich” in price and the are concerned about earnings. Those ideas are so out of touch with reality. The PE Ratio reach 50:1 in 2000 during the DOT.COM Bubble, but it exceeded 120:1 during the 2007-2009 meltdown because blue chips are the place to secure money. The market is by no means “rich” from a historical perspective.

Growing Shortage of US Dollars & Capital Flows


Capital-Flows

There have been a some unusual capital flow developments involving Egypt illustrating that there is a shortage of dollars building which has been caused by the decline in oil prices. This decline in oil has resulted in a decline in subsidies for Egypt from other Arab nations. What has been taking place is interesting. Shares of Commercial International Bank Egypt on the Cairo market have been bought using Egyptian pounds and then dumped in London sold for dollars taking a loss between 20% and 30%. There is such a shortage of dollars building, there are developing net capital movement through proxy instruments.

These trades have been creating regulatory problems. Typically, regulatory limits dictate how much of the company’s shares can be be traded offshore in the form of global depository receipts. This flow of shares is impacting regulations all because of  a shortage of dollars.

The Dow for the Close of May 20th, 2016


DJIND-W 5-19-2016

The first Minor Weekly Bearish Reversal in the Dow lies at 17434. A closing beneath this for the week will confirm what already appears to be in motion technically as well as after electing three Daily Bearish Reversals. The next critical area is really 17120 which happens to be a Daily and Weekly Bearish Reversal. This is the primary support. Breaking this area then opens the door for a more sharp drop ahead to retest 16000.

We have a more important number for month-end and that is 17579 followed by 17210. A May close below this level will confirm a correction into the August/September period, which can extend even into early 2017. This should produce a retest of the broader support at 16000 and a breach of that level on a monthly closing basis would set the stage for a new low under that of 2015.

Keep in mind the Fed realizes that it needs desperately to restore some “normalization” to interest rates. The Fed is departing from Draghi who is destroying the future of Europe as is the Bank of Japan. This is really turning into the Clash of Titans. This is also unfolding is helping to keep the dollar as the only game in town.

Last week, the Dow closed BELOW the technical support I warned had to hold on any retest, which it did not. This was the market warning that between the chaos of the elections, the BREXIT vote in June, and the Fed realizing it has to raise interest rates to try to ward-off the growing demands to seize all pension funds in the nation to bailout public pensions in the various States, the future looks a bit cloudy at best.

We need to watch gold as well. If gold exceeds last year’s high of 1307.80, the likelihood of a sustain breakout beyond 1360 is not very good with a strong dollar. However, such move would also confirm an extension of this entire mess and any reversal where there is a sudden crisis in confidence in government within the main segment of the population would probably come in 2017. This makes sense from the perspective of 2017 being the year from Political Hell. It also would not rule out the ultimate swing for gold to crash to new lows really twisting the minds of everyone with rising rates and the dollar.

London Destroyed

stalincountthevoteJune is the first target for a shake in confidence with the BREXIT vote. It still appears they will be desperate to rig the vote. David Cameron has been calling upon everyone to paint such a dark picture if Britain leaves it demonstrates how important this is to the survival of Brussels, not Britain. Everyone from Obama to Christine Lagarde have been in London to warn the Brits to stay in line. I seriously doubt even if the real vote is to leave, as Stalin said, elections are decided by those who count the vote. The election fraud in Scotland should warn that this is probably in the bag for the “establishment” and that does not look very good for Britain.

So hold-on. The markets are still churning. A monthly closing for the Dow beneath the 16000 level will warn of a new low under 2015 going into 2017. Nevertheless, everything will flip when the general public comes to realize that the future looks very chaotic and it boils down to how can you trust. That is when the flip come from Public to Private.

prevent_graph_collapse_1600_clr_11516

Keep in mind that the Fed is really caught between the worst of two worlds. It needs to raise rates to save pension funds, yet higher rates is going to devastate the bond markets and blow out federal budgets. I have been warning that there will be NO INFLATION as long as rates remained low. Raising the rates is the only way to ignite inflation. Europe and Japan and just brain-dead.

People have been indoctrinated with Marx and Keynes to such an extent, they cannot invest because they are confused and assume rates up stocks down. They just listen to the talking heads on TV and never grasp the real history of this move.

Therefore, a break even to a new low will get everyone offside and assume this is the mother of all crashes. This is when the reversals and timing will help to pinpoint that low. Keep in mind that we need the majority to turn bearish to provide the fuel to the opposite move. This is just the way markets function.

So watch the numbers now. It’s Just Time. Keep in mind we if we hold the 16000 level on a monthly closing basis, then we will just churn back and forth. That is the key area on any decline on a monthly closing basis.

The Wave of Deflation & Rising Unemployment


Unemployment

QUESTION: Marty, years ago you did a chart showing the projection for unemployment. I believe I understand what you were projection for the company I work for has been replacing people with technology on a large scale. So we can have rising corporate profits with rising unemployment as technology changes everything. Is there a point when rising unemployment brings down corporate profits for it reduces consumer spending?

Thank you for your consideration

PD

depression unemployment

Civil Work Force

ANSWER: Absolutely. The peak in unemployment during the Great Depression was during the technology shift that was a result of the introduction of the combustion engine. Tractors began to replace farm workers, as agriculture had been 70% of GDP in the mid-19th century, 40% by 1900, and later dropped to 3% by 1980. This technology shift, combined with the Dust Bowl, changed the face of labor dramatically.

Politicians are brain-dead. Hillary claims she will champion equal pay for women and raise the minimum wage to $15. I do not know what planet she is on but such a combination will clearly create a major depression, given we already have this technology shift underway with so many jobs being automated. You park your car, push a button for the ticket, and pay by sticking your card in a machine without ever seeing a person. McDonalds announced its answer to $15 an hour minimum wage – touch-screen cashiers.

robot-8

The combination of a $15 minimum wage and Obamacare is a lethal injection for the economy. But hey, we elect corrupt lawyers to public office who say what the people want to hear and have no concept of the result if such ideas are implemented.

Tell your children to study computer programming. What will the world be like in 25 years? Will any menial jobs remain?

We are approaching the reality of the movie series “Terminator.” Government is striving to develop robot warriors whose loyalty will never be questioned.

The future will be very much sci-fi. So I am sure someone reading “Twenty Thousand Leagues Under the Sea,” the classic science fiction novel by French writer Jules Verne, never imagined that submarines would really exist one day.

Welcome to the wave of deflation. This trend is already causing people to spend less and save more.

The Difference Between Money & Currency


Juno Moneta

QUESTION: Mr. Armstrong, there appears to be a dispute between what is money and what is a currency. Can you define each easily?

Thank you

LW

ANSWER: “Currency” is an official monetary instrument used in commerce. Currency must be “legal tender,” which means the government will accept it in payment for taxes. “Money” is a much more questionable element for it is different things to different people. The goldbugs would kill you if you dared to say gold and silver were not money. But go to Starbucks and try to explain that a silver dollar should buy you two coffees. Good luck! They will look at you as a con artist.

Money has traditionally been some commodity, be it gold, silver, bronze, seashells, cattle or sheepskins. You certainly cannot historically declare anything to be money for its changes with cultures and time.

As the legend goes, the Gauls attempted to invade the city of Rome quietly but had frightened the sacred flock of geese who made a lot of noise at the Temple of Juno. This alerted the Romans to the surprise attack giving us the word “monere, meaning “to warn” in Latin. The Temple of Juno then became popularly known as the Temple of Juno Moneta. Since this is where the coins were minted, we now arrive at the word “money” that springs from the origin of this legend and place that was an ancient mint. Our terms, such as capital flow, arrives from the Latin word “currere” meaning “to run” or “to flow.” This is where the money flowed from, and gives us the word “currency” meaning the “flow of money.” This is why Juno Moneta is pictured on Roman coins as holding the balance scales in one hand and a cornucopia in the other symbolizing endless bounty or wealth. This is the birth of the terms “money” and “currency.”

LEGAL TENDER

You can argue with Internal Revenue Service that gold and silver are “money” all you want, but they do not have to accept it in payment of your taxes. The paper dollar is the currency and duly states “THIS NOTE IS LEGAL TENDER FOR ALL DEBTS PUBLIC AND PRIVATE.” The Supreme Court nullified all gold clauses in private contracts (PERRY v. UNITED STATES, 294 U.S. 330 (1935)), so legally only paper dollars are “currency” for they are accepted by law publicly or privately.

Up – Down – Sideways? What is Going On?


DJIND-D 5-18-2016

Of course, the markets have been causing losses among the bulls as well as the bears. This is what they do and MUST do before they can actually make a decisive move of the nature we are looking at ahead. It becomes rather amusing to watch the so called professionals end up constantly wrong so they start bruding and proclaiming this feels like 2000 or 2007 before the crash. Are they right? Or are they just angry because they lack the skills to forecast?

Nevertheless, our proprietary Golden Rule of the 3 Attempts (TM) is a very important tool to comprehend. (details will be at the Technical Training Course).

DJIND-2000-HIGH-W

Well, let’s look at 2000 from the Dow perspective. The 2000 high was a Phase Transition in the NASDAQ DOT.COM Bubble. When we look at the Dow, we still see a high, but it is more of a declining sideways pattern. There were three failed attempts to make new highs but each was lower than the previous in compliance with our Golden Rule of the 3 Attempts (TM). This by no means appears even similar to the current pattern.

DJIND-W 5-17-2016

When we compare this to the current pattern pictured here, we see that the third thrust broke through the channel and made a higher high. This is not showing long-term weakness. We have a different trading pattern going on here one designed to create confusion and get the MAJORITY on the wrong side to enable a Phase Transition to even unfold. To revisit key support, the Dow must now close back below 17120 and then we will get a correction.

DJIND-2007-HIGH-W

Here is the 2007 high. Again we see our Golden Rule of the 3 Attempts (TM) to rally but each one was significantly lower with new lows each time. This patterns warned of C R A S H & WATERFALL EVENT was in motion. This reflects a clear bearish pattern with lower highs and lower lows.

DJIND-M 1965-1985

Now, look at how a market knocks on the door three times before it breaks out. This is just one of our technical rules we call the Golden Rule of the 3 Attempts (TM). No doubt other analysts will quickly plagiarize this and call it their own and you will then see who is a real analyst and who is fake. Still, even the 1966 rally, which was the Mutual Fund Bubble, and the 1968 rally when Bretton Woods started to crack, were the initial attempts to break 1,000. Then we had the 3 attempts which did exceed 1,000 before the breakout began with the beginning of this Private Wave. Note also that while gold rallied from $34 in 1970 to almost $200 by 1974, the Dow rallied and broke through the 1,000 level for the first time. They did not move in opposite directions.

Dow-Bonds

So to those who keep yelling the market will crash to 10 cents on the dollar, all I can say is I suppose that means people will buy bonds at -10% interest rates just to park money? If what they are yelling is even possible, then interest rates must move lower and big money is willing to lose it all just to park money. I am sorry. I just do not understand such logic. This is normally the type of nonsense you get from people who want to pretend to be an analyst but have no experience in the field so they lack any comprehension of the moving parts. To create a stock market crash we need confidence to rise in government. Excuse me. Anyone hear of Donald Trump? Confidence in government is declining rapidly, not rising.

Dow-Bonds-1981

And as for the dire prognostications that the stock market will crash because the Fed will raise rates, this only once again demonstrates such people are not analysts at all for they have nothing original to add to the debate. I traded that rate hike under Paul Volcker into 1981. With each rate hike the market declined true, then rebound. The final hike in 1981 was a real lesson for the market rallied. It did not even decline. When they took place, I knew the ECM was correct and we peaked in rates right then and there.

So sure, we should expect the market will drop when the Fed raises rates. Fools will be easily separated from their money. This is why there are fools in the world. Every species is serves a purpose as energy in the food chain for the next one up in the food chain. Trading markets amounts to the same process. We always need the person on the opposite side.

Rising US rates will be inevitable. This will drive the dollar higher, fuel the debt meltdown, and when the capital inflows push US assets higher, the Fed will be compelled to raise rates further to stop the speculation because that is pure Keynesianism that does not work, but hey, what else do they have to do.

German Study: USA is the Top Tax Haven in the World


TAX Haven USA

Migration to USAA new study by the Green Party in Germany places the USA at the top of the list of tax havens for foreign investors. They have highlighted the key states in their study. I have written about this before. The strong capital flows coming into the USA from overseas have been stunning, to say the least. Some 3,000 millionaires from Greece, 10,000 millionaires from France, 6,000 millionaires from Italy, 2,000 millionaires from Spain, and about 2,000 millionaires from Russia have all migrated to the USA.

This is confirming what we see on capital flows. The dollar haters are incapable of looking at international news, and they only focus on the Fed and the Treasury. They seem incapable of objective analysis or looking at the entire world.