
Good work I ran the numbers myself a few years ago and came to the same conclusions. Add one thing to this and solar panels are black and absorb energy (of course) so large numbers of them will change the planets albedo.
Category Science & Technology
Progress At NASA Over The Past 45 Years
NASA as we knew it back then is long gone … 😦
Forty-five years ago NASA could send people to the moon. They can’t do that any more, but they can generate fraudulent climate data much faster than previous generations could have ever dreamed of.

Wind Power Barely Registers In June
This is the core problem with Wind and also Solar; as any competent engineer will tell you that it is basically impossible to go much above the 10% level of Wind or Solar for Grid level power. Using very optimistic values of 30% up time means you need three times the generating capacity if you even hope to get to a output equivalency of other forms. Hot backup is also required so the entire system makes no sense at any level.
Increases in CO2, witch is the main plant food, is good for Biodiversity and Crop Yields
By my calculations CO2 accounts for at most 50% of the climate changes over the past century. The rest is a result of natural process that move the planets temperature up and down over a thousand some year cycle. We are current near the peak of the current cycle which bottomed out around 1650. Those of us that do not believe that CO2 is a pollutant do not believe that it has no effect on the Climate, for it does, its just not as much as the IPCC and their minions think!
Re-Post from Breitbart by Robert Wilde 10 Jul 2014
According to The Economist, The Heartland Institute is “the world’s most prominent think tank promoting skepticism about man-made climate change.” On Wednesday, several scientists gathered at the institute’s 9th International Conference on Climate change to address a variety of issues including the biological effects of increased CO2 on the planet due to human activity.
Dr. Craig Idso, the founder, former president, and current chairman of the board of the Center for the Study of Carbon Dioxide and Global Change, provided a plethora of information on exactly how CO2 affects the environment. Global warming alarmists should be comforted that they have a lot more to be happy about and should not be fretting that global catastrophe is knocking at the door.
Idso pointed out that there is a huge body of literature on the biological impacts of rising temperatures and atmospheric CO2 levels that the International Panel on Climate Change (IPCC) ignores. He emphatically stated that atmospheric CO2 is not a pollutant. In fact, increased levels of CO2 reduce the negative effects of a number of plant stresses including: high salinity, low light, high and low temperatures, insufficient water, air pollution, and protects against herbivores i.e. being eaten by animals and insects.
Notably, Dr. Idso emphasized that the increased CO2 levels allow plants to produce the same amount of crop yield with less water. Moreover, plants are able to grow in dry areas where it had been previously too dry to exist. A collateral benefit to this is that the increased vegetation reduces the effects of soil erosion.
Perhaps Idso’s final conclusion should make all those who fear that global warming and increased CO2 is adding to the demise of the planet that everything is going to be OK: he claimed it is far more likely that CO2 proliferation will increase regional biodiversity and will contribute to the expansion and proliferation of animal habitats.
The Blackbody Temperature of the Planet Earth
This is a key step in the Climate Debate
Determining the ‘exact’ Blackbody temperature of the planet is the first step in determining what the “greenhouse’ effect is; for without that value all else is either speculation or based on an unreliable value. This leads us to a quandary since the plant is a global spinning around a titled axis and with an elliptical orbit around the sun Figure 1 which is the source of virtually all the energy that heats the planet. Clearly with these facts there cannot be one temperature for the planet and so an average can be very misleading and lead to false conclusions.
Traditional calculations of the planets black body temperature ignore the variables which then lead one to assume a steady state situation verses the real dynamic situation that drives climate. To justify this assumption a general statement that the variances are too small to have any meaningful effect are promoted. I some cases with fewer variables this might be true but in this case I think not.
These are the main Variables:
1. The sun has a cycle of about eleven years and that gives a small variation in the suns output of about 1%
2. The planet has an elliptical Orbit that varies by 3.34% or 4,999,849 miles
3. The axial tilt of the planet is 23.4 degrees which causes winter and summer to alternate between Aphelion and Perihelion about every 10,000 years
4. The planet is a sphere so only one side faces the sun at any given moment
5. The sun’s energy reaches the planet on a line drawn from the center of the sun to the center of the planet which only intersects the equator twice a year
6. The energy from the sun is concentrated around this line
7. The planet is a sphere so the suns radiation drops off in all directions from this line by a Cosine factor to zero at the edge 90 degrees from the center line
8. The spin and tilt of the planet means that the center line moves up 23.4 degrees and down 23.4 degrees during the course of one orbit
9. That movement means the distribution of energy also moves
10. The distribution of land and ocean are not uniform on the planet
11. The albedo of the planet is a variable not a constant
12. Energy from the core adds a small amount of energy
13. Tidal forces from the sun and the moon also add some energy
14. Energy is carried North and South from the hot spot centered on the line by the atmosphere and the ocean
15. The Coriolis Effect along with tidal forces drive thermal transfer north and south at an angle and these are then main contributors to the climate

Figure 1, the Earth’s orbit
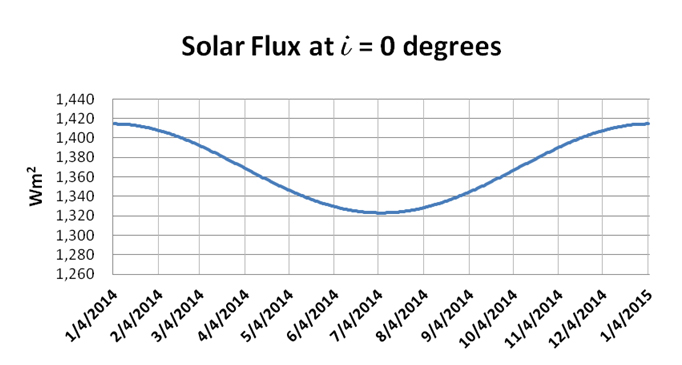
Figure 2, orbital changes in solar flux
There are three sources of energy that determine the climate on the earth: the radiation from the sun which is said to be 1366 Wm2 The actual value based on the orbital range is from 1414.4 Wm2 in January to 1323.0 Wm2 in July Figure 2 and there is also an eleven year sun spot cycle with a range of 1.37 Wm2. The hot core of the planet adds ~0.087 W/m2 and the gravitational effects of the moon and the sun (tides) adds another ~.00738 Wm2. Of these three the sun’s radiation is by far the most important but considering all three the range during an eleven year solar cycle is from a high of ~1415.3 Wm2 to a low of ~1322.4 Wm2 so a more accurate mean would be 1368.34 Wm2.
The energy emitted by the planet must equal the energy absorbed by the planet and we can calculate this using the Stefan-Boltzmann Law. Which is the energy flux emitted by a blackbody is related to the fourth power of the body’s absolute temperature. The tidal and core temperatures are added after the albedo adjustment.
E = σT4
σ = 5.67×10⁻⁸ Wm2 K sec
A = 30.6% (the planets albedo, this is not a constant)
σTbb4 x (4πRe2) = S πRe2 x (1-A)
σTbb4 = S/4 * (1-A)
σTbb4 = 1368.24/4 Wm2 * (1-A)
σTbb4 = 342.16 Wm2 * (1-A)
σTbb4 = 254.36 Wm2
Earth’s Blackbody temperature Earth’s surface temperature
Tbb = 252.23O K (-20.92O C) low Ts = ~287.75O K (14.6 O C) today
Tbb = 254.36O K (-18.79O C) mean
Tbb = 256.54O K (-16.51O C) high
The difference between the Blackbody and the current temperatures is what we call the ‘greenhouse’ effect that averages 33.36O Celsius (C), today, although the range is from 35.52O C to 31.11O C from variations in the 11 year solar cycle. Despite this variation in incoming solar flux the planet’s temperatures is very stable. Other factors are also important in doing climate work such as the solar energy is concentrated between about +/- 30 degrees of the equator maybe a bit more. And the heat from the core and probably the tides is concentrated where the crust is the thinnest under the oceans and this concentration of energy core heat and tides) combined with Coriolis forces is probably what drives the ocean currents. In my opinion these other important factors are not being considered properly in the climate models.
We also know from geological studies Figure 3 that the planets temperature has been relatively stable over the past 600 million years with a mean of about 17O C or 290O Kelvin (K) and with a range of plus or minus 5O K or C based on the information in Figure 3. During the past 250 million years CO2 concentrations have ranged from a low of ~280 ppm (a historic low)in 1800 to the present low of 400 ppm to a high of over 2,000 ppm probably averaging around 1,500 ppm. There was only one other period in the past 600 million years with CO2 this low. Going back further CO2 was estimated to be as high is 7000 ppm, but we will ignore that for now.
This means that whatever the processes are that relate to determining the thermal balance of the planet they must work within this range to be valid. Although Figure 3 shows a range of 10O C it would be prudent to spend resources to determine these values with as great accuracy as possible. We’ll assume a mean of 16O C with a range from 10O to 22O C as being more reasonable. Also we are now in one of only three cold periods which are very rare in the past 600 million years and if we count that partial dip 150 million years ago that means that there is probably a 150 million year cycle there; maybe one of those first determined my Milutin Milankovic.
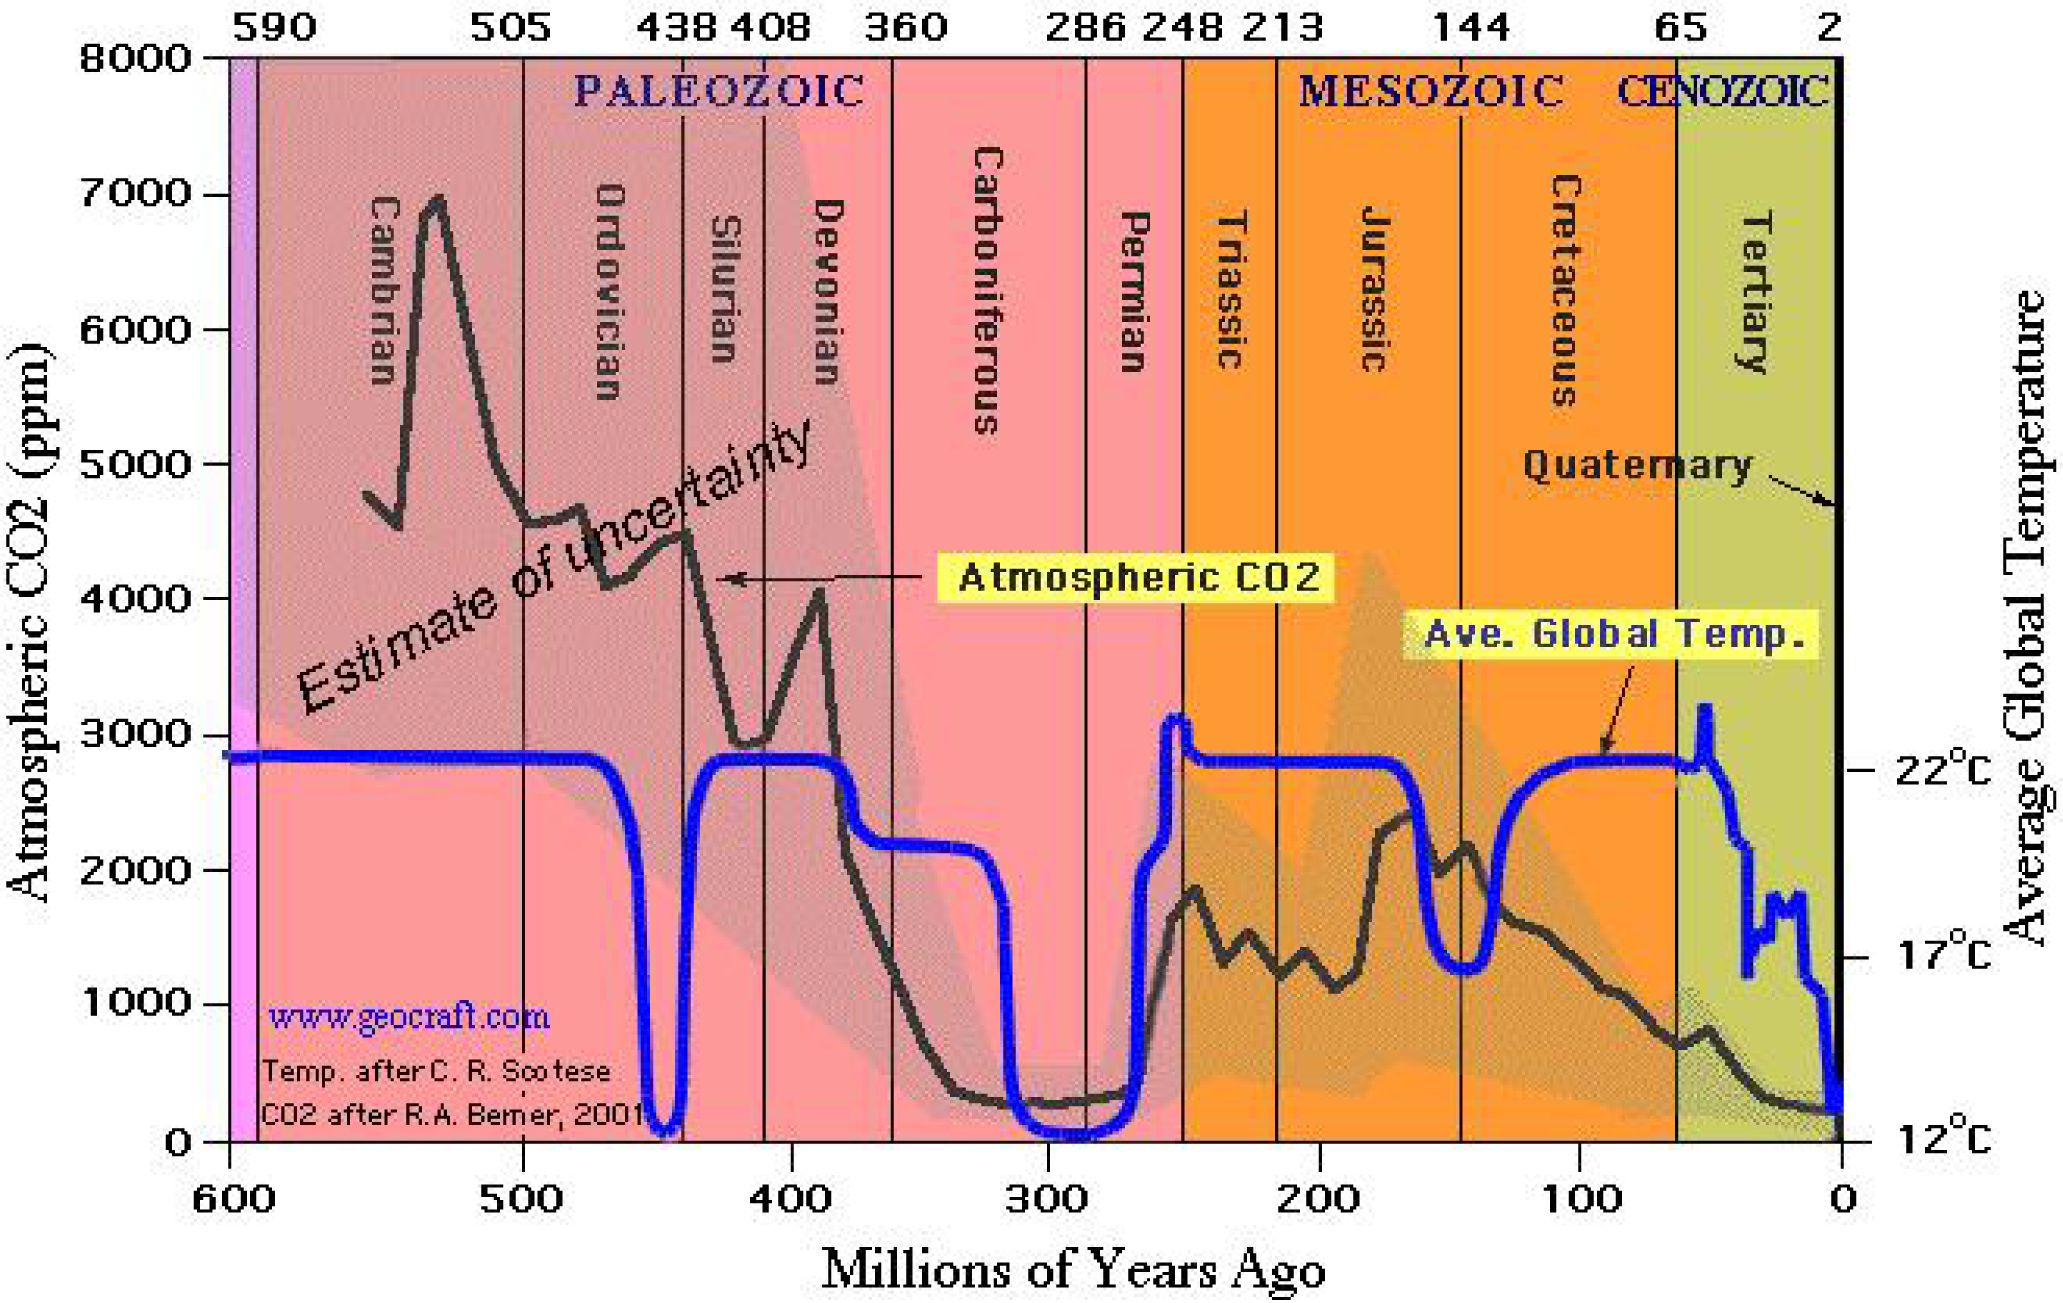
Figure 3, Geological temperatures and Carbon Dioxide
Additional discussion as to the so called “greenhouse” effect must start with the important correction that this process is not a true greenhouse effect, since it is not the same process that occurs in a greenhouse used to grow food. The actual process that occurs is based on the structure of the atoms involved and how they interact with the various frequencies of visible and infrared radiation that are in play on the planet. However at this point in time there is no way to correct for the misuse of the words so we are stuck with it and all the complications that therefore arise in trying to properly discuss the issue with lay people and even some with technical knowledge.
The greenhouse effect occurs within the earth’s atmosphere and the main constitutes of wet air, by volume ppmv (parts per million by volume) are listed in the following table. Water vapor is 0.25% over the full atmosphere but locally it can be 0.001% to 5% depending on local conditions. Water and CO2 are mostly near the surface not in the upper atmosphere so the bulk of the greenhouse effect must be close to the surface.
Gas Volume Percentage
Nitrogen (N2) 780,840 ppmv 78.8842%
Oxygen (O2) 209,460 ppmv 20.8924%
Argon (Ar) 9,340 ppmv 0.9316%
Water vapor (H2O) 2,500 ppmv 0.2494%
Carbon dioxide (CO2) 400 ppmv 0.0399%
Neon (Ne) 18.18 ppmv 0.001813%
Helium (He) 5.24 ppmv 0.000523%
Methane (CH4) 1.79 ppmv 0.000179%
There are only two of these gases that are relevant to determining how that 33O C (today) happens. That is not to say the others do not contribute but that at the present concentrations of Water H2O and Carbon Dioxide CO2 they are the main determinants. And since we know the range of temperatures that have existed geologically then we have set the range which these to gases must interact in, meaning that any set of equations or models or theories that predict values outside this range must be suspect based on geological evidence.
Also it must be kept in mind that the solar flux falls on a spot centered on a line drawn from the center of the earth to the center of the sun and because of the 23.5O axial tilt of the planet this “Hot” spot moves up and down as the planet moves though its orbit. Because of the shape of the planet the intensity falls off quickly as we move north and south and east and west according to a cosine factor so the heat energy is mostly over oceans near the equator where the atmosphere is the densest.
The first image below Figure 4 shows a recent distribution of water across the planet and it is clearly concentrated over the oceans close to the equator and that results in the heat imbalance and therefore movement north and south as shown in the second image Figure 5.
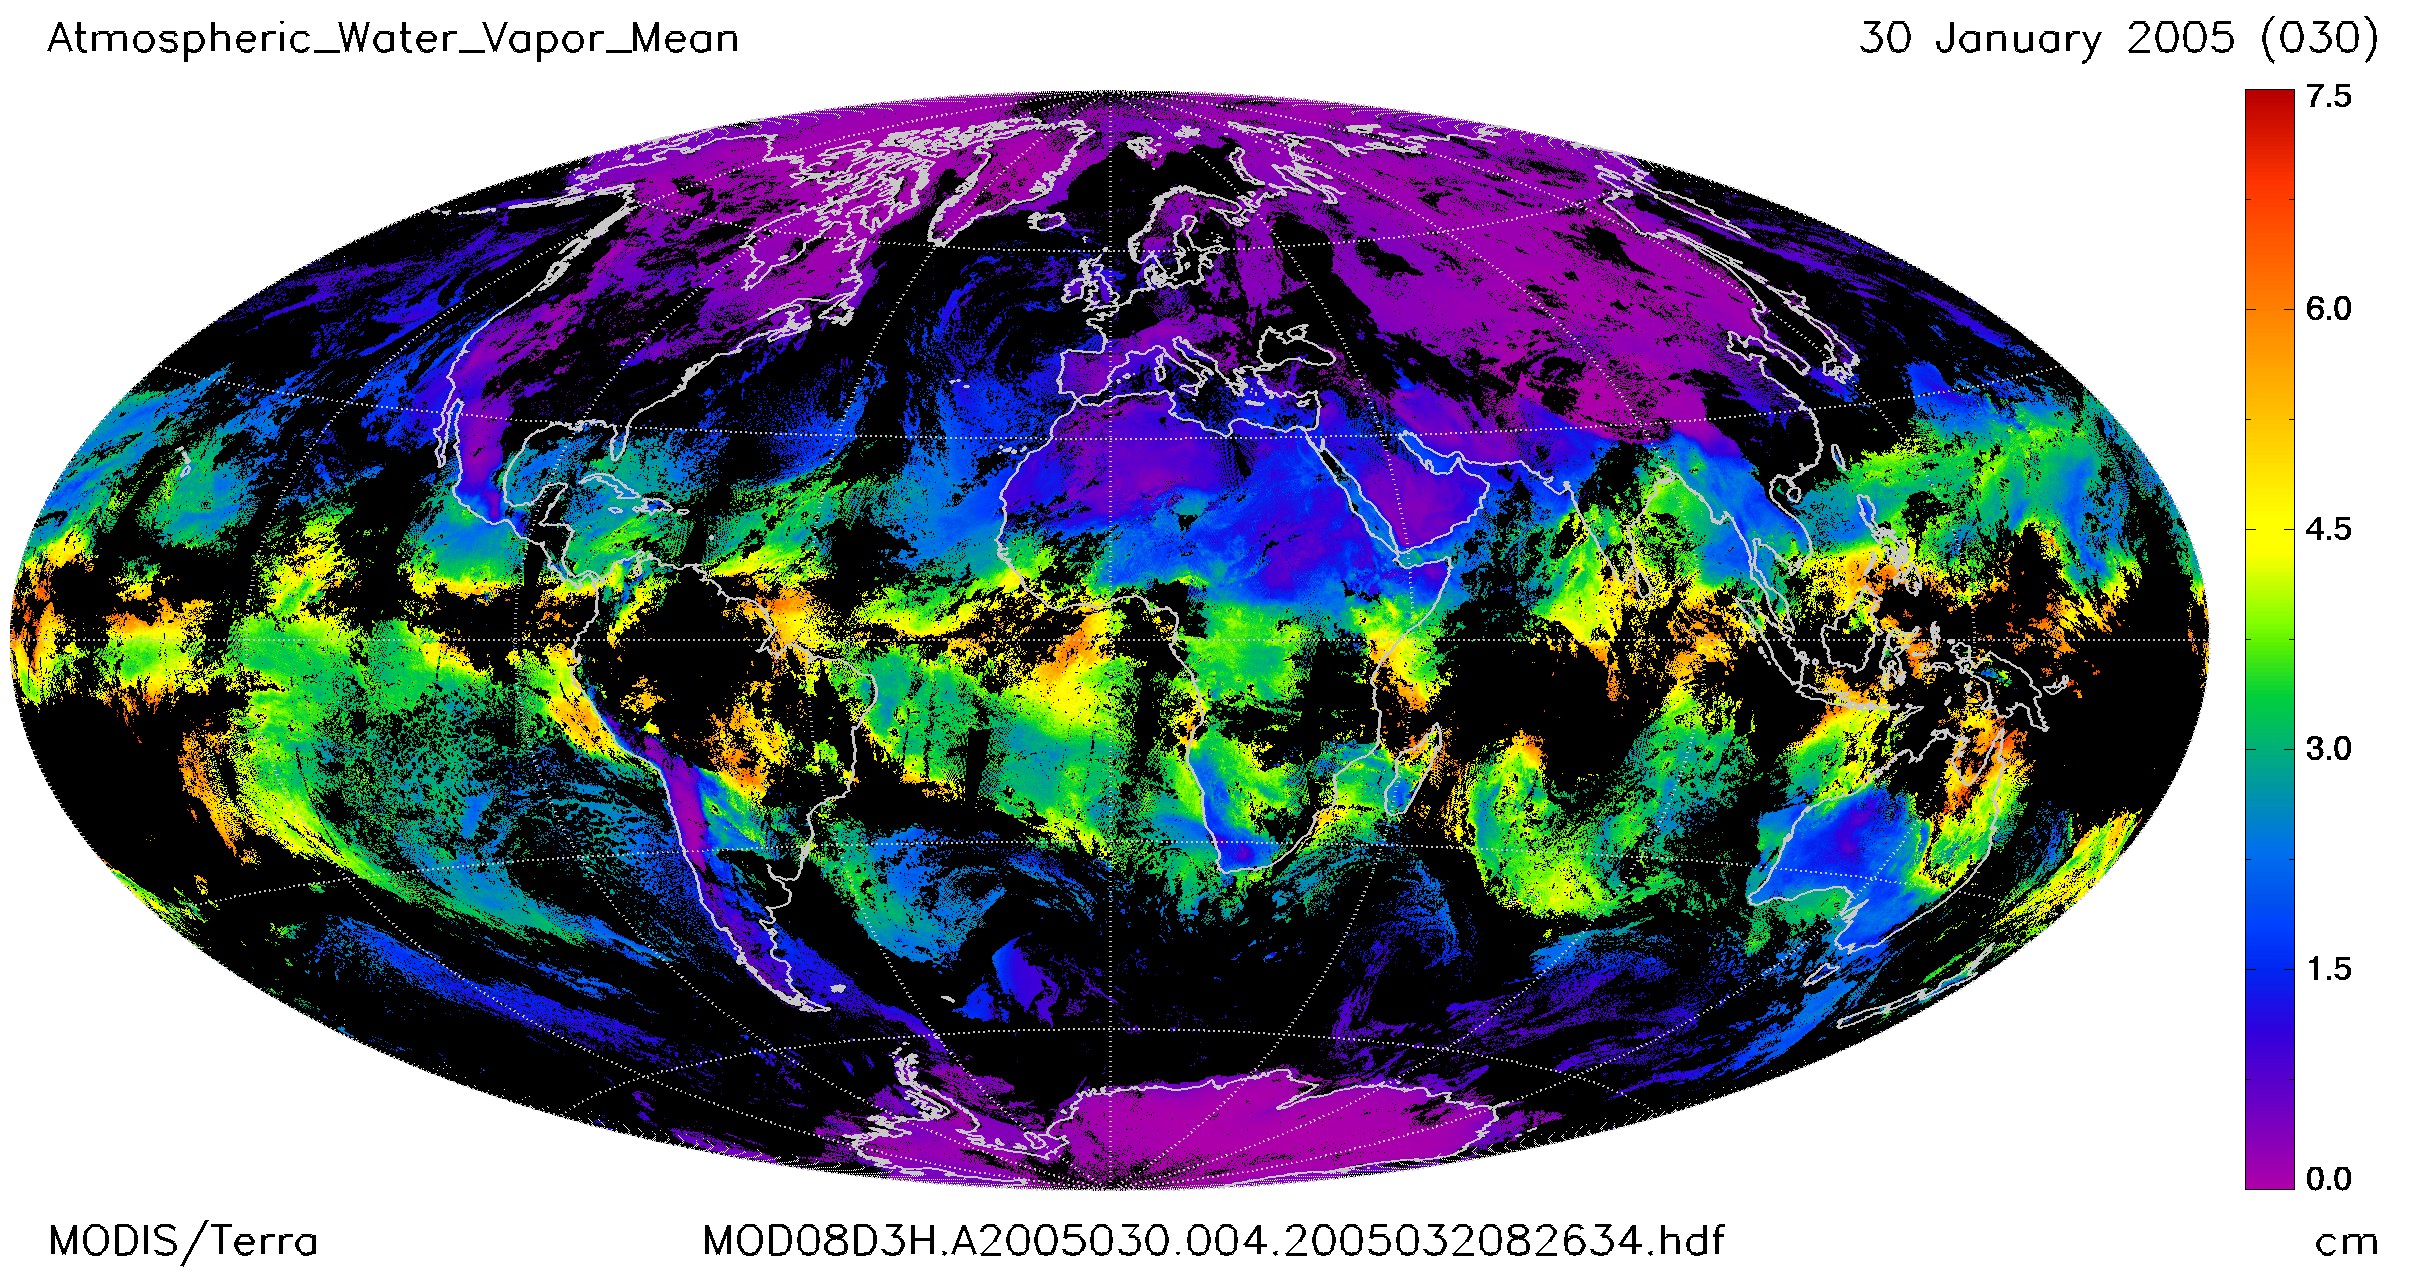
Figure 4, water vapor concentrated near the equator
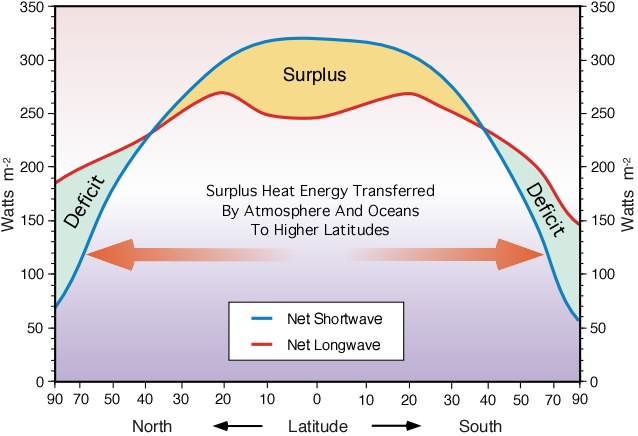
Figure 5, basic heat flows from the equator north and south
The next two images show how that energy is moved by the water Figure 6 and the atmosphere north and south from the equator Figure 7.

Figure 6, Ocean currents
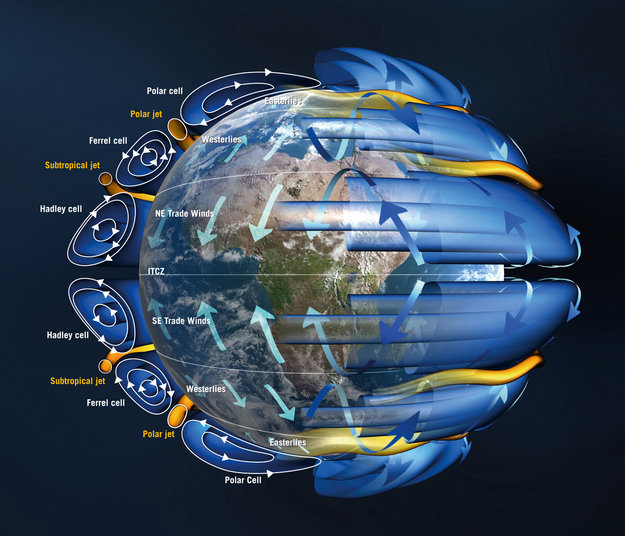
Figure 7, Atmospheric heat flows
In summary we now know that the Blackbody temperature of the planet is a variable.
Tbbl = 252.23O K (-20.92O C) low at Aphelion
Tbbm = 254.36O K (-18.79O C) and the yearly mean
Tbbh = 256.54O K (-16.51O C) high at Perihelion
Therefore the ‘greenhouse effect must also be a variable.
Ts = ~287.75O K (14.6O C) today
Ghl = Tbbl + Ts = 35.52O C
Ghm = Tbbm + Ts = 32.39O C
Ghh = Tbbh + Ts = 31.11O C
The range in temperature just from orbital changes is therefore 4.41 O C which is significantly more than the warming that the IPCC claims has happened. These are hard numbers based on the solar flux which is known and the orbital parameters of the Earth that are also known. The large variances come from the Stefan-Boltzmann Law; which is the energy flux emitted by a Blackbody is related to the fourth power of the body’s absolute temperature. The fourth power in the equation magnifies the small variation in solar flux significantly.
Problems with the NASA Temperature Data
Homogenized Anomalies
NASA makes an attempt at determining the World’s temperature each month and publishes the result around the middle of each month in various reports one of which is called the Land Ocean Temperature Index, or LOTI. This table of values is published back to January 1880 and the lasted version includes temperatures though April 2014, or 1,600 values. However, rather than publish an actual temperature they first establish a base of 14.0 degrees Celsius and then using a complex algorithm determine a value higher or lower than the 14.0 degrees Celsius base in hundredths of a degree which they call an anomaly, i.e. 13.5 degrees Celsius would be -50 and 14.5 would be +50. Each month when the new table is created using this process called “homogenization” NASA recalculates all the temperatures all the way back to January 1880.
After several years of studying the published values, sometime in early 2013 as I remember it, a major change was noticed in the 2012 published values from those in earlier periods. Previous to this minor changes of a few hundredths of a degree were commonly observed in the LOTI data but they just appeared to be random or rounding changes, which would be normal in a process like NASA uses, so they were ignored. The reason is that a few pluses and a few minuses would mostly cancel out and could be ignored as having no real affect. What was observed was something much different and so an in depth analysis was made of the entire set of 13 available tables and then by entering all the data for 8 of them plus 5 new ones into a spreadsheet which created a table with now over 22,000 values, which could be reviewed.
To simplify the analysis the data for the 13 reports was looked at in ten year blocks e.g. January 1880 to December 1889 which would be 120 values and an average determined; this would eliminate any random or rounding changes. This was done for the period January 1880 through December 2009 creating a Table of 169 values which were placed into an Excel Chart. What should have been observed would be a more or less horizontal line across the Chart for each time block for the average value of the NASA anomaly for that period. Instead what was observed were major shifts mostly down meaning colder in a large number of the ten year time blocks all occurring during 2012; meaning that a programming change must have been made that shifted around entire blocks of temperature anomalies. This has to be intentional and not random.
Rather than show all 13 plots four new ones were created to show where the major change was and they are plotted here as 1900 to 1919, 1920 to 1939, 1940 to 1959 and 1960 to 1979 each plot containing 240 values for each of the 13 NASA LOTI reports. Virtually all the 13 original time blocks showed this kind of shift, some up and some down in values, but since many overlapped it was hard to track the individual plots and this simplified version shows the core of what was done with the temperatures without the distraction of too many plots.

It’s obvious that there has been a major shift in the values shown in NASA table LOTI during these four 20 year periods totaling 80 years; shown in the area contained in the blue oval with the question mark. What appears to have been done is to make the 1900 to 1919 period .15 degrees colder; make the 1920 to 1939 period .1 degree colder; make the 1940 to 1959 period about .05 degrees colder and them make the 1960 to 1979 period about .025 degrees warmer. While doing this they made the 1960 to 1979 period warmer than the earlier 1940 to 1959 period such that the look of the data fit the narrative of the alarmist message being promoted by Hansen and Gore of dangerous anthropogenic global warming which was the original message being promoted at the time. The data after the 2012 change shows a very clear ~.35 degree progressive warming, red arrow, from 1900 to 1979 compared to less than ~.2 degrees prior to 2012, black arrow, and it also gets rid of the 1940 to 1959 warm period which doesn’t match the overall message being promoted.
It’s hard to image how this change could come about without conscious effort being applied to make this the end result; it’s just too convenient to be by chance.
Sir Karl Raimund Popper (28 July 1902 – 17 September 1994) was an Austrian and British philosopher and a professor at the London School of Economics. He is considered one of the most influential philosophers of science of the 20th century, and he also wrote extensively on social and political philosophy. The following quotes of his apply to this subject.
If we are uncritical we shall always find what we want: we shall look for, and find, confirmations, and we shall look away from, and not see, whatever might be dangerous to our pet theories.
Whenever a theory appears to you as the only possible one, take this as a sign that you have neither understood the theory nor the problem which it was intended to solve.
… (S)cience is one of the very few human activities — perhaps the only one — in which errors are systematically criticized and fairly often, in time, corrected
Analysis of Global Temperature Trends, April 2014
What really going on with the Climate?
The analysis and plots shown here are based on the following: first NASA-GISS temperature anomalies (converted to degrees Celsius) as shown in their table LOTI, second James Hansen’s Scenario B data, which is the very core of the IPCC Global Climate models which was based on a CO2 sensitivity value of 3.0 degrees Celsius, lastly, a plot based on an alternative climate model designated the ‘PCM’ climate model based on a sensitively value of .65 degrees Celsius. To smooth out large monthly variations a 12 month running average is used in all the plots. This information will be shown in four tables and updated each month as the new data comes in.

The first plot, UL is a plot of the NASA temperature anomaly converted to degrees Celsius shown in red with a black trend line added. There has been a very clear reversal in the upward movement of global temperatures since about 2001 and neither the UN IPCC nor anyone else has an explanation for this. Since CO2 has continued to increase at what could be argued an increasing rate this raises serious doubts about the logic programmed into all the IPCC global climate models.
The next plot UR, also in red, shows the IPCC estimates of what the Global temperature should be, based on Hansen’s Scenario B, with the NASA actual temperatures’ subtracted from them. Therefore this plot represents a deviation from what the Climate “believers” think the temperature should be; with a positive value indicating the IPCC values are higher than actual and a negative value indicating the IPCC values are lower than actual. A black trend line is added and we can clearly see that the deviation from expected is increasing at an increasing rate. This makes sense since the IPCC models project increased temperatures based primarily on the increasing level of CO2 in the earth’s atmosphere. Unfortunately, for them, the actual temperatures from NASA are trending down since other factors are in play, therefore each year the gap between them widens. Since we have 12 years of observations’ showing this pattern it becomes hard to justify a continuing belief in the IPCC climate models, there is obviously something very wrong.
The next plot LL shown in blue is based on the equations in the PCM climate model described in previous papers and posts here and since it is generated by “equations” a trend line is not needed. As can be seen the PCM, LL, and the NASA, UL, trend plots are very similar the reason being that in the PCM model there is a 68.2 year cycle that moves the trend line up and then down a total of .30 degrees Celsius (.0044 degrees Celsius per year); and we are now in the downward portion of that trend which will continue until around 2035. This short cycle is clearly observed in the raw NASA data in the LOTI table going back to 1880. Because there is also a long trend, 1052.6 years with an up and down of 1.36 degrees Celsius (.0013 degrees Celsius per year) also observed in the NASA data; there is a net cooling of .0031 degrees Celsius per year going up right now. After about 2035 it will reverse and be a net increase of .0057 degrees Celsius. These are all round numbers as both curves are sine curves.
The last plot LR in blue uses the same logic as used in the UR plot, here we use the PCM estimates of what the Global temperature should be with the NASA actual temperatures’ subtracted from them. A positive value indicates the PCM values are higher than actual and a negative value indicates the PCM values are lower than expected. A black trend line was added and it clearly shows that the PCM model is tracking the NASA actual values very closely. In, fact since 1970 the PCM model has rarely been off by more than +/- .1 degrees Celsius and has an average trend of almost zero error, while the IPCC models are erratic and are now approaching an error rate of +.5 degrees above expected.
The IPCC models were designed before a true picture of the world’s climate was understood. During the 1980’s and 1990’s CO2 levels were going up and the world temperature was also going up so there appeared to be correlation and causation. The mistake that was made was looking at only a 20 year period when the real variations in climate move in much longer cycles. Those other cycles can be observed in the NASA data but they were ignored for some reason. By ignoring those trends and focusing only on CO2 the models will be unable to correctly plot global temperatures until they are fixed.
The purpose of this post is to make people aware of the errors inherent in the IPCC models so that they can be corrected.
Sir Karl Raimund Popper (28 July 1902 – 17 September 1994) was an Austrian and British philosopher and a professor at the London School of Economics. He is considered one of the most influential philosophers of science of the 20th century, and he also wrote extensively on social and political philosophy. The following quotes of his apply to this subject.
If we are uncritical we shall always find what we want: we shall look for, and find, confirmations, and we shall look away from, and not see, whatever might be dangerous to our pet theories.
Whenever a theory appears to you as the only possible one, take this as a sign that you have neither understood the theory nor the problem which it was intended to solve.
… (S)cience is one of the very few human activities — perhaps the only one — in which errors are systematically criticized and fairly often, in time, corrected
Water the Main Greenhouse Gas
Water the climate stabilizer
This post is an “opinion piece” although I believe it is based on sound principles and the conclusion is probably not all that far off from what we actually have with the planets climate.
What so many people forget when they are discussing the subject of Climate Change or Anthropogenic Climate Change is that the primary greenhouse gas in the atmosphere is Water, just plain old H2O at .25% or 2,500 ppm. The Carbon Dioxide CO2 that so many are extremely worried about is only a minor player at only .04% or 400 ppm. The how that these two interact in our atmosphere along with incoming solar radiation and outgoing infrared (IR) is what keeps the atmosphere of the planet 33 degrees Celsius warmer than it would be without these two gases. In other words the planet would be an ice ball and probably devoid of life without them.
When studying climate in relationship to Water and the various other trace gases such as CO2, Ozone, and Methane one finds that there are only a few bands (frequencies) of visible (incoming) or Infra red radiation (outgoing) where the trace gases could affect water which is the repository of the heat making up that 33 degrees Celsius of warming. Ozone absorbs ultra violet which is very important to us but does not interact with the water or the Carbon Dioxide in the atmosphere so it can be dismissed for considerations involving changes in global temperature. Methane at present levels is only 1.8 ppm and so even though it could be a factor at higher levels it can also be dismissed; and so for all practical purposes that only leaves Water and Carbon Dioxide to consider for changes in the climate with the variations of these gases in the atmosphere.
When we look at charts showing the radiation transmitted by the atmosphere or absorbed by it. It would seem that the ratio of absorption of energy by Carbon Dioxide to Water is about 1 to 6 or in other words 16.7% CO2 and 83.3% H2O. Since we know that there is energy in the H2O in the atmosphere from absorbing visible and Infra red energy and that can be determined to be 33 degrees Celsius that distribution logic tells us that 5.5 degrees Celsius is related to CO2 and 27.5 degrees is related to H2O. Based on these numbers we can generate sensitivity plots. Those plots make sense from observations of the atmosphere when all things are considered in proper context.
We’ll look at CO2 first and we find that from many peer reviewed papers the sensitivity values for CO2 have been moving down from the original National Academy of Sciences (NAS) 1979 Charney report of 3.0 degrees Celsius being the most likely to now most being less than 2.0 degrees Celsius. There are even a few studies below 1.0 degrees Celsius such as .68 degrees Celsius Harde and .64 degrees Celsius Lindzen. If we pick .65 and plot the resultant curve we find that 400 ppm intersects the CO2 plot at 5.5 degrees warming which just happens to be the same value that we got looking at the radiation absorption and transmission Charts. In my work I came up with .65 degrees Celsius as well because it was the value that made my model work; so obviously I have no problem with this value.
The following Chart shows the relationship that we just described.

With the Carbon Diode subject now settled (here) that leaves water to be studied and this is a little more complex. Everyone agrees that water is the primary greenhouse gas because of the large amount of heat that it can hold, from Wikipedia we have the following three statements:
Waters heat capacity is the highest of all common liquids and most solids and it prevents extreme changes in the planets temperature i.e. it is a great heat moderator.
Waters latent heat of fusion is also the highest of all common solids and liquids its thermostatic heat regulating effect is due to the release of heat when freezing and the absorption on melting.
Waters latent heat of vaporization is the highest of all common substances so it is immensely important in the transfer of heat in and between the ocean and the atmosphere which makes it a driving force in climate and weather.
We know following the logic used here that 5.5 degrees Celsius was the amount of increase in the atmosphere from Carbon Dioxide and so if we subtract that from 33 degrees Celsius we get a remainder of 27.5 degrees Celsius. That must then be the amount contributed by the water itself to the process and we can make another chart showing the contribution due to water. To make the chart we have water at 2500 ppm and we know the amount of increase in temperature must be 27.5 degrees Celsius so what sensitivity value will produce that curve? The following plot shows that if the sensitivity value of water is approximately 2.45 than we get the required value as shown in the following Chart.
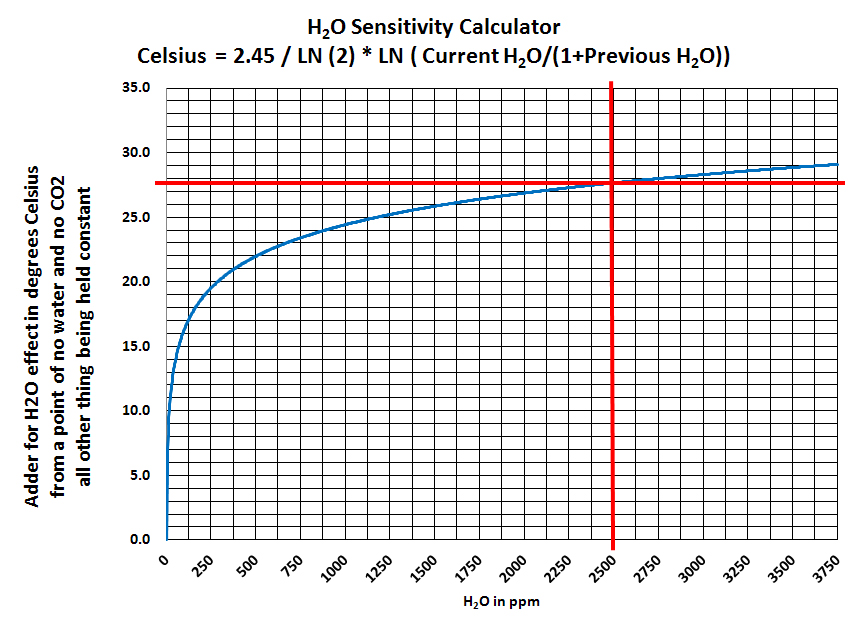
This process makes sense since if the numbers were reversed and we made Carbon Dioxide have a sensitivity of 3.0 degrees Celsius (as the IPCC claims it is) than the warming from CO2 would be 27.9 and there would be no room for the water as there would only be 7.1 degrees available for the water. These numbers are almost the same as what was developed here but reversed between the CO2 and Water so it has to be one way or the other. However, since we know the absorption bands of the CO2 and Water and we know the distribution on energy coming in and gong out we also know that this is not possible.
Therefore this paper must be a close approximation of the actual situation in the atmosphere and the IPCC value that they use of 3.0 degrees Celsius must therefore be wrong.
Unintended Consequences
Politicians should never make technical decisions
It has been very popular for many intellectuals to adopt the view of Malthus that the planet’s resources are limited and that there are way to many people on the planet. A good portion of the environmental movement is also based on these same views. Unfortunately most of these “intellectuals” and “do gooders” are not knowledgeable in the science and engineering that relate to energy production and development. What we do know is that the generation and control of large amounts of cheap energy is critical to maintaining a high standard of living. We also know that when the need for large families is eliminated that the people will have fewer children.
The solution therefore is to raise the standard of living which then results in fewer children being born. How many people the planet will support is unknown for it depends on the technology we have and how much energy we can control. If we assume that the politicians want the citizens to lead happy and productive lives (which is not certain) then we know the only way that can be done is through having cheap and abundant energy available. This is the opposite of the current directions of those in positions of power mostly because they do not have the education, intelligence or the vision to see the real solutions. Most of them operate on a zero sum game where it’s all about the distribution of the pie not the making the pie bigger.
What we do know is that if zealots are left unchecked and the environmentalists are zealots then they will destroy civilization. For example, the banning of the incandescent light bulb in the United States starting with 100 watt incandescent lamps in January of 2012. The replacement lamps for now appear to be mostly compact florescent lamps (CFL) which produce more light per watt of electricity. LED lamps are the same with slightly different numbers. This is being done for only one reason and that is to use less energy. But is what is being said about less energy a true fact, well let’s find out.
A 100 watt incandescent lamp will produce when turned on 90 watts of heat and 10 watts of light. A 100 watt CFL replacement lamp will produce when turned on 50 watts of heat and 50 watts of light. These numbers are not the actual numbers but they are reasonable estimates used for discussion purposes. So we can say that for every five incandescent lamps we only need one CFL lamp. So lets say we have 10 incandescent lamps and we replace them with 2 CFL’s that reduces the electric load from 1,000 watts (10 x 100) to 200 watts (2 X 100) and we save money.
Maybe, maybe not those 10 100 watt lamps that we replaced were helping to heat your home in the winter. When they were replaced by the 2 100 watt CFL’s we removed 800 watts of heat which is where all the energy that the incandescent lamps used went. They are hot to touch remember. The difference between the two types 800 watts will need to be made up for by the furnace in the winter so depending on the rate one pays for power you could be spending more for the heating then you were saving from the electricity.
In general the addition cost of heating in the North could be higher then the savings if air conditioning is not used. And in some cases the higher cost of the lamps even with the offsetting longer life and with air could make this a bad investment. In the south with little heating the CFL’s would save money especially with the reduced air conditioning load. The point to this is that the savings will not be as advertised. And if it isn’t did it really make sense to shift 100% of lighting manufacturing to China along with all the jobs.
In Summary
National policy should be determined through independent private sector research and development, and outside the political system to include funding.
If Governmental is involved it should be used only to recommend general policy and never to actually provide any services.
Business should be responsible for all goods and services
Costs should be allocated as closely to the user as is practical
Is Global Scale Sustainable Energy Possible?
Green Energy not suitable for Grid Power
This post was written using the best available information found using Google and Wikipedia. The purpose for writing this post was for putting things in the proper perspective in regards to sustainable energy at the global scale. The words Sustainable Energy as used today refer to Energy that does not pollute and is not finite.
All carbon-based sources of energy are finite and pollute and nuclear process pollute and are also finite. Hydroelectric is very limited and cannot be considered as a serious source for global energy. Other similar sources such as wave power and geothermal have the same limits and so this class although very suitable in some locations does not solve global needs.
Therefore the only real source of truly sustainable energy is the sun, and the only question then is how can we acquire it and how much is available? This potential energy availability takes two basic forms; the first directly converting sunlight to electricity with energy collection panels and the other indirectly capturing the movement of the solar heated atmosphere with wind turbines to create electricity.
Unfortunately there is no way to discuss this subject without using lots of numbers. Their use has been minimized to the extent possible. But to do so requires that some liberties were taken in the descriptions. None of these liberties changes the basic facts presented here in any way.
Basic facts one, the earth is a sphere albeit not a perfect one but very, very close with a mean radius of 6,371 km and that is revolving around the sun at distance of between 147.1 (perihelion) and 152.1 (aphelion) million km with an orbital period of 365.2564 days. The solar radiation (flux) at the surface of the sun is 6.4 X 10⁷ +/- .25% wm-2 considering variations due to the fusion process going on in the sun. By the time this solar energy reaches the earth it has been reduced to between 1,435 wm-2 at perihelion and 1,345 wm-2 at aphelion with a small variance of 90 wm-2 between the two. The accepted “average” all this considered is 1,367 wm-2 at the interface of outer space and the earth’s atmosphere
Basic facts two, the earth, to the sun, is only a flat disk, which has an effective area of 1.28 X 10¹⁴ m-2 so that the 1,367 wm-2 of the incoming radiation must be reduced by a factor of 2 to compensate for the 3D effect (sphere verse disk) on the surface. Considering only that adjustment we would have 683 wm-2 on the surface but that level is further reduced by the earth’s albedo (the amount being reflected back into space) of about 30% so the net at the surface facing the sun is about 478 wm-2 when these things are considered. We’ll ignore the various variations because they are relatively small.
Basic facts three, Continuing with our simple disk model the backside of the earth, that facing away from the sun, is radiating energy off the planet back into space. So therefore since the planet is in thermal equilibrium the backside is radiating 478 wm-2 of energy back into space at a frequency shift down into the infrared range. And the net mean temperature of the surface of the earth is 287.2 degrees K (Kelvin) as a result.
Note, this is a very simplistic thermal model of the Earth and the actual energy flows of a very large rotating sphere within a gaseous envelope being heated on one side is going to be very complex. The above descriptions are meant only to give the feel for the energy flows even though the actual energy flows are not exactly as described.
Basic facts four, Of significant note is that the water vapor and water droplets in the atmosphere absorb the outgoing inferred as described in basic facts three delaying the back radiation going out and thereby raising the temperature of the planet (the so called greenhouse effect). That water acts as a thermal dampener and thereby raises the temperature of the plant by about 33 degrees Celsius. In other words the temperature of the planet without atmospheric water and also the CO2 would be 254.2 degrees Kelvin instead of the actual 287.2 degrees Kelvin and the Earth would be an ice ball with no life on it
Much to do has been made about using sustainable energy i.e. solar and wind in lieu of carbon based sources for two reasons. The number one reason is that carbon based fuels produce CO2 and that since CO2 is a green house gas that it will raise the temperature of the planet by some unacceptable amount. The second reason is that we will soon run out of carbon based fuels and we need to find a substitute.
The first reason is without any merit since historically the level of CO2 in the atmosphere has ranged from historic lows of around 180 ppm (parts per million) in the recent past to well over 7,000 ppm in the distant past. If an average were developed it would be in the range of about 1,200 ppm, which is 3 times what it is now. When considering geological time frames there does not appear to be a causal relationship between CO2 and temperature so it’s unlikely that even reaching 800 ppm today will have much effect on the planets temperature. The temperature of the planet has, in geological time frames, only moved +/- 1.8% from the mean while CO2 has moved +/- 274.1%. That alone is enough of an issue to give pause to the current climate theories.
However realizing that this is a unconventional belief its not worth arguing about since well over 80% of the worlds energy is carbon based and that is not going to change in the next 40/50 years even with all the attempts being made at limiting the use of carbon based fuels.
So the real question is how do we transition from where we are which is using up finite resources to being able to have abundant energy that has no or minimal adverse effects on the planet and on humanity. One point of clarification is needed here and that is that although the carbon fuels i.e. coal, oil and natural gas are finite, they will last well into the next century. We are not going to run out in the next 50 years. In fact, there appears to be in North America enough carbon based recoverable energy to last us between 100 and 200 years depending on usage rates. The point being that there is plenty of time to work out an alternative.
But back to our study, the first thing we need to know is not how much energy we use now that’s a given but how much will we need in the coming decades. The estimated level of energy produced and used world wide in 2008 was 474 exajoules or about 449 Quads and it was growing at about 5% per year as third world counties industrialize. That would put total world energy usage at about 3,679.8 exajoules or 3,485.0 Quads at mid century if that growth rate were sustained. That is the equivalent of 1,024,529.6 TWh (terawatt hour) used from a generating capacity of 117.0 TW (1,024,529.6 dived by 8760 hours) which is almost 8 times what we have now. So the issue then is how much of that could be converted to wind or solar?
To determine the amount of energy we can get we first need to know how much of the available land area can be used to convert the incoming energy to a usable form with either solar or wind systems. We’ll ignore the costs for now and only focus on the energy generation. The Earth is 29.2% land or 148,940,000 km-2 but not all of that is available for several reasons. Those reasons being: the requirement of living which are having cities, crop land and other uses of the land for human work and pleasure; then that which makes the land unsuitable i.e. the polar areas, mountains, swamp land and other areas where putting wind turbines and PV panels would just not be practical. For sake of discussion let’s assume that 10% of the land area of the planet is available for either wind or solar power and that calculates out to about 14,893,882 km-2 of available land. And that gets reduced by another 25% to 11,170,412 km-2 for other reasons explained later.
Solar PV (Photovoltaic) is probably the most efficient method for collecting energy since we are not using the sun to heat air and then the air to move turbine blades. Turbines are complex devices with a high mechanical content subject to breakdown and high maintenance, They are also not visually pleasing and they generate audio harmonics that cause humans and animals that are near them discomfort. Solar PV panels are the more practical means of collecting solar energy since they lend themselves to mass production and cost reductions better than wind systems. There is a downside however as only half the planet is facing the sun at any one time and there is a certain amount of infrastructure required that also reduces the area actually available. That means when we factor all this in that we only have 5,585,206 km-2 available at any one time for generating solar PV power out of a total installed base of 11,170,412 km-2 worth of panels.
So how much power can we get? Well we know that on average the solar radiation is 474 wm-2 and there are only 5,585,206 km-2 available for generating power at any one point in time. There are many figures out there all using many different ways of determining solar PV capability and cost. We also need to consider incentives and grants as they do not change the cost of production only who pays for it. So rather then guess at the numbers we’ll use the actual published data of one of the world’s largest solar PV installations, the recently constructed solar PV panel generating plant in Sarnia Ontario, Canada that was finished in 2010. On their website the stated generating capacity is 80 mW and it is expected to generate 120,000 mWh per year (we do not know if this is actuate yet). This plant was said to cost about $400 million to build and consists of 966,000 m-2 of high efficiency First Solar PV panels.
Using these numbers and considering these previously discussed facts: First that on average we only get sunlight for 12 hours on any one panel, the side facing the sun. There will also be a additional reductions for clouds and other atmosphere effects and dirt on the panels. And we also know that we will need access roads and other support structures as well as maintenance. So we have 5,585,206 km-2 of PV panels generating power and we end up getting 1,392,491 TWh of power as the theoretical maximum if all these assumptions hold true and although it’s true that that is a lot of power it is only about 35.9% more then required by mid century. Not much room for additional growth and not even enough if the growth in population is more to the high side then the low side of the UN projections. The population growth is discussed later.
Clearly a massive switch to Solar PV cannot solve the issue of world energy needs, as the land area available is just not there. By 2060 to 2070 that 35.9% reserve will be gone. Putting it into perspective if the entire land area of the United States were covered in solar PV panels, which is not possible, it would only generate about two thirds of the required power of the planet by mid century. Is using up this much land for this purpose something that we really want to do? Keep in mind that these installations are going to be placed on good land not mountain tops.
Then there is one other factor that has not been considered about installing global scale solar PV power systems. Solar PV panels are back and are designed to absorb energy. At a global scale this will change the albedo of the planet to something less then it is now. That will change the thermodynamic balance of the planet and possibly raise the temperature more then that feared for by the increasing CO2 levels — unintended consequences lurk behind every decision that we make.
Baring a major break through in developing fusion power there is only one real alternative for sustainable energy that can match the population growth without a corresponding reduction in the standard of living. So let’s assume that the goal is to bring everyone in the world up to at minimum the “present” standard of living of America. In round numbers we Americans used about 100 Quad of energy before the 2008 financial collapse and there were about 300,000,000 people. So we can say that we will need .333 Quad per 1,000,000 people.
By mid century it’s estimated that there will be between 7.5 and 10.5 Billion people on the planet according to UN projections. However that low end appears to be unrealistic since we are or almost at 7.0 Billon right now. So lets use 9.5 Billion people and that would translate into 3,166 Quad worth of energy verses the 3,485 previously calculated. So the previous 5% assumed growth rate in energy is not far off if we want to raise the standard of living of everyone. However that does also imply that our American standard of living cannot increase or we would need more energy.
Baring some major breakthrough the method being described here reaches a maximum amount of energy possible, from solar PV, by mid century plus or minus a few years so from that point on we must either get rid of people or lower the standard of living. Either way that creates haves and have nots and that is not a good idea. There would also be a very large cost as 11.2 million square km-2 of solar PV panels would cost $462.5 Trillion to produce and install at $41.41 per mWh, which is only 10% per mWh of the actual cost of the Sarnia project. That is a huge reduction which is probably not achievable when the raw resources to make this happen are considered.
Is there another way? Yes there is we could put the PV panels in orbit around the Earth where the sun shines 24/7 and there is no loss of energy in the atmosphere. The same amount of power could be generated with an array only 250 by 250 miles and at $122.41 per mWh (three times that on the surface), it would probably cost under $52 Trillion to install. NASA studied this concept back in the ‘70’s when oil was still cheap and solar PV panels were a lot more expensive then they are today. Orbital PV power was assumed to not be feasible as it was assumed that we would be using nuclear (fission) power by now. The point to this is that a lot of the conceptual groundwork has already been done. All it needs is to be dusted off and updated. Although there would be some land use required on the surface of the planet for receiving the power it would only be a fraction of that required with the panels on the surface. Back then in was microwaves now lasers could be used. So less money and a lot less land — and more importantly this is very scalable.
The last thing we need to consider is that solar panels lose capacity at a rate of about 1% per year. At that rate panels need to be replaced at about 25 years of life or when they reach 75% of their original capacity. Using that number and the goal of having an objective of generating the maximum amount that we can from solar by mid century plus or minus a few years we find that if they are on the ground we need to get to a sustained production rate of 340,000 km-2 per year and then stay at that rate forever. This will cost about $14.1 Trillion per year and will maintain above 1,024,529.6 TWh of power. Using the same assumptions but using power satellites we can get the same amount of power from 13,000 km-2 of panels costing $1.7 Trillion per year to maintain. Either of these options will take care of about 85% of the world’s power, some things like planes, boats and other heavy equipment will still have the need for carbon based fuels.
Whether these capabilities or time frames are actually achievable or not this project would certainly put a lot of people to work and focus our attentions on something other then trying to redistribute the existing resources of the planet to no real long range benefit to all the citizens of the planet. With our current policies we end up fighting over a smaller and smaller pot of energy and available land. America is the technological leader in the world — we are the ones that need to think this way or the Facebook and Tweeter users will not have the electricity to run their phones and laptops.
