A Government is never satisfied until it as ALL THE MONEY & WEALTH


Why Taxes MUST be eliminated

Bug-Stops-Here-DonkeyHotey

The Guardian has obtained documents showing that the Internal Revenue Service (IRS) is now listening to people’s phone calls and this is showing it has to do with money – not terrorism. The IRS is now also has sophisticated cellphone dragnet equipment known as Stingray, where without search warrants, they are targeting people to get them hiding money..

NASA Has Nearly Doubled Global Warming By Data Tampering Since 2005


Have no doubt that this data manipulation is FACT — NASA once the premier agency of can do engineers and scientists is now nothing more than a Pravda and political engineering and science!

Tony Heller's avatarReal Climate Science

Almost half of claimed global warming is due to data tampering by NASA over the past 10 years.

NASA2005-2015Tampering
2005 version: Fig_A.pdf
2015 version: Fig.A.gif 

View original post

No economic effect from this — for now!


Yuan to be Added to SDR at the IMF

China-Yuan-Currency

QUESTION: Mr. Armstrong; If I understand you correctly, should the IMF accept the yuan as a reserve currency, this will have zero impact other than political. Correct?

RH

ANSWER: Correct. The IMF will decide in November whether to expand the current composition (US dollar, euro, yen and British pound) of Special Drawing Rights (SDR) with another currency.Whether this takes place is really irrelevant. The Euro is already in there and that has done nothing to kill the dollar, the yen is not a viable place to park international capital and the pound is too small. The hype people are associating with this is really stupid. Whether the IMF includes the yuan in the SDR is meaningless for the reserve currency must bee deep and a place to park big money. That has not yet been established for the yuan. It should help to get the dollar bears all short so they can add the fuel for the next rally.

Eventually, the yuan will emerge as a real reserve currency. However, it is not yet ready for prime time. This is a political issue that is necessary right now because the Chinese economy is turning down and that is impact the emerging markets and will help to turn Europe into a real depression. So this is political at this time and it to try to help support the yuan which is under serious pressure with massive capital outflows.

Lawmakers Probe Taxpayer-Funded Academic Who Wants Obama to Prosecute Climate Change Skeptics


One finds it’s always about the money , especially when government is involved!

Climate Rationalization, Beliefs and Denialism


A good summary of where we are but we are way to late to stop this match to the cliff the damage is now done as this December at COP21 a new climate treaty will be proposed, a draft version is available http://paristext2015.com/, and it will be sent to the UN and will be approved as has the support of the Pope and Obama.

In my opinion, the best we can hope for now is as the pause should continue until 2035, by my calculations, that we might me able to blame this travesty on the politicians more then the scientists.

Understanding The 97% Consensus


This all started when Al Gore had Will Happer fired back in the day when Gore was in Congress.

Tony Heller's avatarReal Climate Science

Barack Obama says that 97% of scientists agree with his mindless apocalyptic fantasy.  He pulled that number out from where the sun never shines, but just for a minute let’s see what he does with it.

screenhunter_776-jul-03-21-00 (1)

The White House abuses and threatens to fire any scientists who disagree.

2015-10-25-17-55-45

If that doesn’t keep them silent, they threaten to prosecute them.

2015-10-25-18-03-24

LetterPresidentAG.pdf

Not to mention cutting their funding off, ostracizing them, censoring them in the press, and making sure they don’t get published.

They create silence in the same way that all mafias do. Threats, harassment and $29 billion/year in bribes. Obama engages in the exact behavior which RICO was intended to target.

View original post

The United Nations 21st Conference of the Parties (COP21) on Climate Change


COP21 will held in Paris France from November 30 to December 11 2015 with the stated objective of achieving a legally binding and universal agreement on climate, from all the nations of the world. The reason this is required is that, according to government scientists, global temperatures must not exceed 2 degrees Celsius (C) above pre-industrial levels; or there will be dire and irreversible consequences to the planet and humanity.

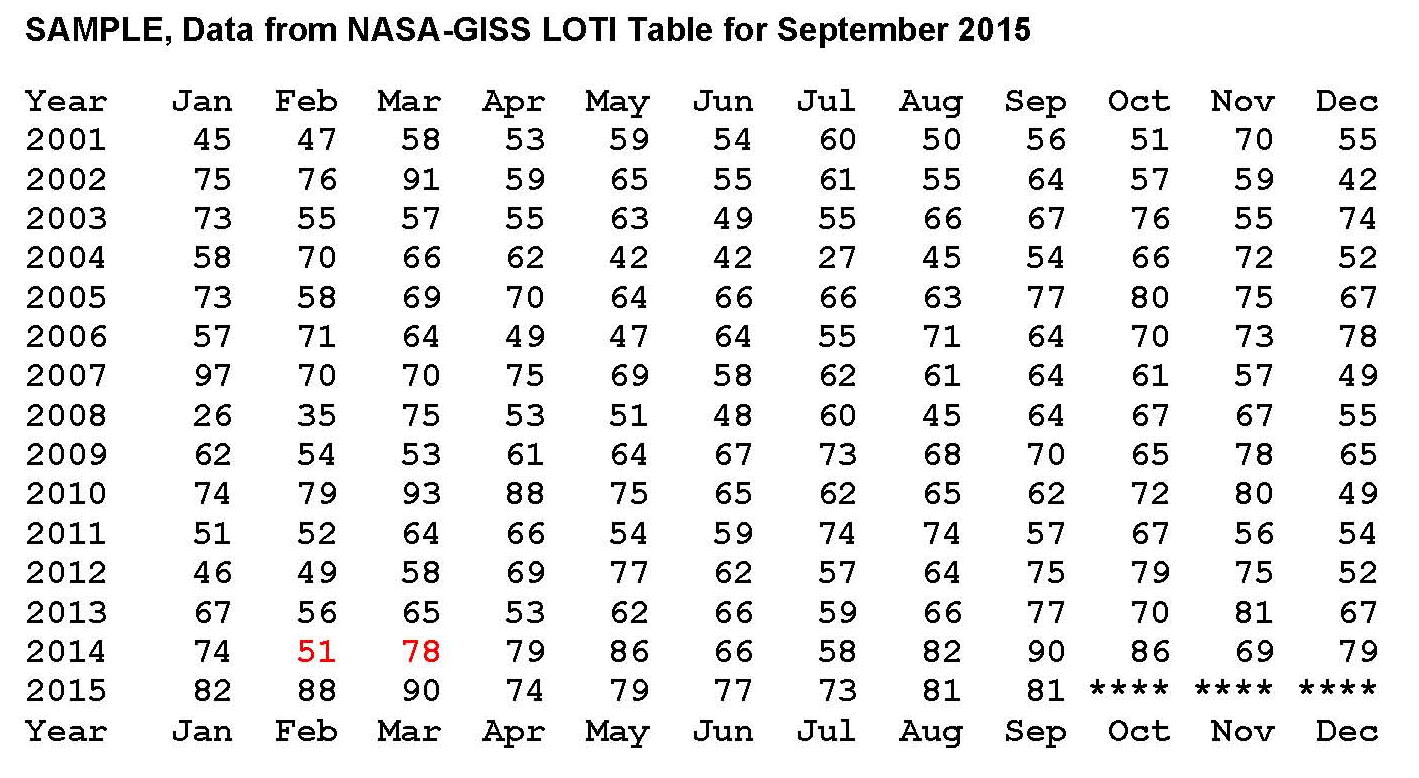
This increase in global temperature is claimed, by these same scientists to be directly caused by CO2 levels going from just under 300 parts per million (ppm) 200 years ago to almost 400 ppm today because of the use of fossil fuels i.e. coal, oil and natural gas. The term they use for this theory is Anthropogenic Climate Change meaning man made climate change. To achieve this stated goal Carbon Dioxide CO2 emissions must be quickly stopped since according to NASA current temperatures are at 14.81 degrees C and pre-industrial temperatures were around 13.5 degrees C. If we add 2.0 degrees C to 13.5 degrees C we get 15.5 degrees C only .69 degrees C above where we are now and that means at their current rates of increasing we will exceed that 2 degrees C level before 2050.

The expected proposal from the COP21 conference will be a legally binding international treaty that will place a heavy carbon tax on the developed world i.e. North America and the European Union (EU). This tax will make carbon based fuels very expensive in these countries which will therefore drive down their use and allow alternative energy to take their place. Since this will be a United Nations tax it will go to the United Nations and be used to offset dislocation problems in the developing world. According to the proposed draft agreement dated October 5, 2015 the sign up dates for the states are from March 2016 to March 2017 and the agreement goes into effect 30 days later according to article 17 and article 18.

President Obama has stated that he will take the treaty developed by the COP21 conference to the United Nations as soon as he gets it and since the Catholic Pope has also supported this effort it’s unlikely that the UN will not approve it. It’s very likely that processes much like what was used to get the Treaty with Iran will be used to get congress to approve this treaty since all the Washington elitists want this to happen; more tax money. This means that congress will pass a bill that they must be involved in the process and the President will sign it. The net result of this will be that it will take a 2/3 vote to stop instead of a 2/3 vote to pass.

These are the major (but not all) steps leading to the COP21 conference.

The creation of the Environmental Protection Agency (EPA) 1970 and the Clean Air Act 42 U.S.C. §7401 et seq. (1970) The Clean Air Act (CAA) is the comprehensive federal law that regulates air emissions from stationary and mobile sources. Among other things, this law authorizes EPA to establish National Ambient Air Quality Standards (NAAQS) to protect public health and public welfare and to regulate emissions of hazardous air pollutants.

This perceived problem of CO2 had its beginnings in the United Nations (UN) Conference on the Human Environment, which met at Stockholm from June 5th to June 16th 1972. What happens over the next 45 years can be directly traced to this conference! The following discussion highlight only a few of the major events that have led many to believe that all life on earth is threatened by there being too many people a principle first proposed by Thomas Malthus, an early English economist. Malthus published and essay in 1798 titled An Essay on the Principle of Population where he proposed that sooner or later population growth will be checked by famine and disease, leading to what is known as a Malthusian catastrophe; which later technology prevented from happening.

The 1972 Stockholm conference led to European studies on the role of Carbon Dioxide and the environment such as the SCOPE 13 The Global Carbon Cycle paper published in 1979 by the Scientific Committee On Problems of the Environment (SCOPE) in Paris. This paper showed very dire results for increased levels of Carbon Dioxide, and reignited the old Malthusian catastrophe concept of too many people for the planets scarce resources.

Next was the National Academy of Science (NAS) study on the issue also published in 1979 which is now called the Charney Report, which agreed that there was a problem and justified their conclusions by defining a key number need in the science. They looked at the work of a young scientist working at the National Aeronautics and Space Administration (NASA) James E. Hansen’s high estimate of 4.0 C and added .5 degrees C to it for uncertainty. Then they took another scientist working a National Oceanic and Atmospheric Administration (NOAA) Syukuro Manabe’s low estimate of 2.0 C and subtracted .5 from it for uncertainty. Lastly they average the two which then gives us a 1.5 C Low value, an 3.0 C expected value and a 4.5 C high value as the CO2 sensitivity values which are what are still used today thirty five years later.

Next was the creation of the Intergovernmental Panel on Climate Change (IPCC) which was set up in 1988 by the United Nations (UN) at the request of two of its other organizations; the World Meteorological Organization (WMO) formed in 1950, and the United Nations Environment Program (UNEP) set up after the Stockholm Declaration in 1972. The IPCC’s mission is to provide comprehensive scientific assessments of current scientific, technical and socio-economic information worldwide about the risk of climate change, specifically Anthropogenic Climate Change. A key point here is the IPCC was never charged with proving whether the anthropogenic assertion true or not it was only charged with determining how bad it would be; in essence assuming it was true.

The next major event was the UN Conference on Environment and Development (Earth-Summit), held in Rio-de-Janeiro on June 13, 1992, where 178 governments voted to adopt the program called UN Agenda 21. This was a comprehensive blueprint for creating a “sustainable” world which went from world governance to local school boards and zoning boards which meant that “every” aspect of a person’s life was to be controlled by UN Agenda 21. This program based on Carbon Dioxide rising world temperatures beyond the point where humans could maintain a civilization completed all that was needed for implementation and we were off on a Quest to save the planet.

President George H. W. Bush signed the Agenda 21 agreement in 1992 after it was passed at Earth-Summit and the US House of Representative then passed a Concurrent Resolution 353 on October 2, 1992 after being introduced by Nancy Pelosi indicating support for UN Agenda 21. Then a few months later the US Congress started the process of funding Agenda 21 in 1993 under a Clinton executive order 12852 establishing the President’s Council on Sustainable Development (PCSD)

Next is Al Gore who was a Congressman from Tennessee (1977–85) and from 1985 to 1993 served as one of the state’s Senators. While in Congress became interested in Climate Change and he was instrumental in getting James E. Hansen funding from Congress to study the problem of Climate Change which was known as Global Warming back then and removing Will Happer and eminent scientist that opposed it.

Gore was very active in the environmental movement while he was Bill Clinton’s VP. Gore continued to promote the movement, after leaving office, and his documentary “An Inconvenient Truth” was released in 2006; this documentary was a story about how the burning of fossil fuels was destroying the planet. It seemed to be targeted at young adults without the education to discern truth from fiction and it was very successful in achieving negative awareness on the subject. Gore’s work in climate change activism earned him the Nobel Peace Prize in 2007. Unfortunately, the message in that documentary was not factually correct and appeared to be only an emotional appeal to support the regulation of Carbon Emissions’ (CO2) in some form of Carbon Tax.

On April 2, 2007 in Massachusetts v. Environmental Protection Agency, 549 U.S. 497 (2007), the U.S. Supreme Court in a case from twelve states and several cities of the United States against the Environmental Protection Agency (EPA) was decided 5-4 to force that federal agency to regulate carbon dioxide and other greenhouse gases (GHGs) as pollutants. This case legally made CO2 a pollutant and set the stage for the EPA to shut down coal power among other things.

An interesting fact, Al Gore was one of the investors that had helped set up a Carbon Trading exchange in Chicago along with a then young Barack Obama (on the board of the major investor The Joyce Foundation located in Chicago) that they named the Chicago Carbon Exchange CCX in 2003. When the American Clean Energy and Security Act was not passed by the US Senate in 2009 the CCX exchange folded the following year, 2010. Gore had been very vocal on this subject and if HR 2454 had been passed by the US Congress Gore would have become very wealthy; so the question is was his involvement in the movement because he believed what he was promoting or because what he was promoting would have made him very wealthy?

April 2009 published in nature V 458 is the justification for the 2 degree Celsius limit on global temperatures. Meinshausen et al. (2009) found that if we limit cumulative CO2 emissions from 2000-2050 to 1,000 Gt (approximately an 80% cut in global emissions),

This brings us to Bill Gates with his Gates Foundation that has taken up the cause of stopping Anthropogenic Climate Change which they believe will cause the planet to overheat and create a mass extinction and possibly even ending human life. This movement has now taken the look of a religion and therefore no debate allowed. Bill Gates gave a presentation at TED2010 (Technology Entertainment Design) where as part of that presentation he described a simple equation to show what was needed to reduce Carbon Dioxide to save the planet. Gate’s equation is CO2 = P x S x E x C which is the amount of CO2 emitted is equal to the number of people (P), times the service they use (S), times the energy per service (E), times the CO2 per unit of energy. Gates after explaining this equation goes on to describe the need for “miracles” to avoid planetary catastrophe from CO2 and the necessary goal of Zero carbon emissions globally by 2050. The only way to get to Zero emissions is that one of the numbers in Gate’s equation needs to go to ZERO.

On June 23, 2014 the Supreme Court ruled in a 7-2 decision that the Obama Administration’s Environmental Protection Agency (EPA) is free to regulate carbon dioxide (CO2) in the atmosphere, as long as the source of emissions in question is a traditional polluter, like a factory or a power plant, rather than a school or a shopping mall.

Sadly very little of any of this is actually true. There was real concern for pollution in the 1970 when the Environmental Protection Agency (EPA) was created but as the hard core believers took over the agency they went way beyond the legitimate initial goals and they are now in the process of forcing a shift to wind and solar energy by taxing carbon out of existence. The COP21conference was to be the crown jewel of the movement but a number of years ago NASA global temperatures stopped moving up and the satellite data supported the pause as they called it. Based on analyzing the NASA temperature data it appears that a serious effort was made in to manipulate the temperatures first in 2009 and then again in 2014.   This data manipulation by NASA (at the demands of the administration) is in the process of totally destroying the credibility of the worlds scientific community.

NASA-GISS Published Global Temperatures are not Valid


This paper shows that the values published in the NASA table LOTI cannot be supported when the sun’s energy is used as an input since the difference month to month in the table cannot be less or more than when the sun sends us. Changes in the planets albedo were also considered and even 30% changes in the albedo cannot explain the large amount of energy that must come in or go out if the NASA values are to be believed.

NASA publishes values representing the global surface temperature of the planet supposedly based on actual measurements processed in a complex algorithm they call homogenization. The resulting values are published each month in a table called the Land Ocean Temperature Index (LOTI) which runs from January 1880 to the current month, September 2015 in this case. The process they use is explained on their web site for those that are interested. However the values shown in their work seem to show very large temperature swings on a month to month basis and that did not seem reasonable to me, given this was Global temperatures. This prompted me to do a review of the process in June 2015 and that led to a previous draft paper which was modified to create this finished work.

A small sample from NASA’s table is provided below running from January 2001 to September 2015. A good example of this large swing in values can be found in the value shown in February 2014 of 51 compared to March 2014 of 78 (both shown in red) a difference of 27 anomalies (a quarter of a degree), a NASA measure of temperatures in hundredths of a degree Celsius, represents a lot of energy on a global scale.

00 NASA REVIEW-00

What we are going to do now is reverse engineer the NASA Temperature values in the full LOTI table and then calculate the energy flows required to make those changes. If the “required” energy flows are not reasonable, then the NASA temperatures are not reasonable. They must be in synchronization with energy inputs as energy can neither be created nor destroyed. The first step was to place all 1929 LOTI values in a spreadsheet and then turn the NASA anomalies (a deviation from a base of 14.0 degrees Celsius) back into temperatures by dividing by 100 then adding that value back to the base 14.0 degrees Celsius and lastly adding that result to 273.15 to convert to degrees Kelvin. Kelvin must be used to calculate total heat when working on these kinds of projects.

Next we needed to calculate the total heat value of the NASA temperatures and their changes and so from Wikipedia we find that the Earth’s dry atmosphere is 5.1352E+18 kg and the water in the atmosphere is 1.27E+16 kg for a total of 5.1479E+18 kg. From these values we can calculate that water is on average .247% of the atmosphere. We also find that on Wikipedia the specific heat of the Earth’s atmosphere is 1006 Joules per degree Kelvin (J/kg/K) without water and so we need to add 4.6 J/kg/K for water and 9.8 J/kg/K for latent heat to the 1006 J/kg/K giving us a total of 1020.4 J/kg/K for the earth’s atmosphere with .0247% water at standard air.

There is one last step since the NASA values are “surface” temperatures, we need an adjustment for altitude cooling if we are looking for the total energy in the atmosphere. To accomplish this we’ll subtract 28.5 degrees Celsius making the answer the theoretical temperature at 5 km above sea level which is about where 50% of the atmosphere is above 5 km and 50% below; so this makes for a reasonable estimate for calculating total energy. Using this logic we subtract the 28.5 degrees Celsius from the NASA LOTI values that we converted to degree Celsius, which are surface values which then gives a ballpark value to calculate the total heat in the atmosphere.

With the monthly NASA temperatures in a spreadsheet it was only a few hours work to set up the equations and plot a few charts. We calculated the heat value of each month’s anomaly for example for January 1880 the value was 1.3572E+24 Joules and for June 2015 the value was 1.36266E+24 Joules. Those values are a result of energy coming in from the sun minus what leaves the planet as infrared energy assuming no large change in the temperature of the land or oceans. To my knowledge these kinds of temperature changes (energy flows) have not been observed on the surface of the planet.

This review shows that the magnitude of the “required” energy flows is not reasonable indicating to me that the NASA temperatures is not reasonable as can be seen in Chart 1 on the next page. This shows two plots, the monthly change in the NASA anomalies in blue (required energy out) and the sun’s input in red (energy in). The sun’s input is adjusted for the orbital distance to the sun and the number of days in the month which is required to match the time periods shown in the NASA LOTI table. Since the sun is the energy input, the NASA temperatures minus the input must equal the input with the opposite sign, or negative. In other words, the sum of the two must be zero.

00 NASA REVIEW-01

It’s clear when looking at Chart 1 that there have to be extremely large monthly energy flows involved here if the NASA numbers are actually valid. To put this in perspective three, lines were added to Chart 1, as shown in Chart 2. These lines are for the incoming solar radiation using 1414.44 Wm2 for solar radiation at aphelion (January) and 1322.97 Wm2 for solar radiation at perihelion (July) in the earth’s orbit using the following albedo percentages; 20.0% dark red plot, 30.0% (Actual) red plot and 40.0% a yellow plot. The red plot is also shown on Chart 1. We also changed the time frame from 1880 to the present to 2000 to the present so that more detail could be seen when making Chart 2.

The choppy lines in the dark red, red and yellow Sun radiation plots are a result of using monthly values and the months don’t always have the name number of days. The purpose of showing these three radiation plots from the sun is to show that large changes in the planets albedo cannot account for the large energy swings and so the large changes in the NASA data such as shown here just don’t happen. That means that even these large albedo changes cannot account for the large required movements in energy indicated by NASA’s numbers shown in their table LOTI, the actual smaller albedo changes we experience surely can’t.

00 NASA REVIEW-02

The blue plot for the NASA temperatures is actually the “required” energy out flow to balance the suns energy inflow. Given the process that NASA uses to determine global temperatures it would be expect that there would be some variations, but surely not of the magnitude shown in this chart.

NOAA and NASA have spend a lot of time and resources developing complex systems with the intent to show how “current’ temperatures were being driven up by the level of greenhouse gasses in the atmosphere caused by the burning of fossil fuels. This was called anthropogenic climate change meaning climate change caused by man. These apparent upward global temperature changes in the 1980’s and 1990’s were assumed by politicians to be dangerous and the scientific community given the task of showing the dangers to the planet of increasing temperatures. Although there was some real scientific validity to the man made climate change movement a true cause and effect review of the concept was never made and money poured in to “prove’ the concept.

Had a true review of the apparent problem been done first it would have been obvious that there were other factors involved besides greenhouse gases the most obvious was the well documented thousand year cycle of warm and cold periods going back several thousand years. The most recent of these cycles ended around 1650 during the coldest part of what is called the Little Ice Age. Assuming the thousand year cycle is valid that means that the global temperature would be ascending for five hundred years peaking around 2150. Based on this principle of multiple reasons for the apparent climate change, a climate model was then developed in 2007 that fit the historic patterns that includes the increases in greenhouse gases. This model is called a pattern model and designated the PCM and shown next.

00 NASA REVIEW-03

The next Chart 1a was developed exactly the same way as the NASA Chart 1 was except we used the temperatures generated by the PCM model as shown in the previous PCM chart instead of those developed by NASA in their computer system. We can clearly see in this Chart 1a that this PCM model generates a plot that very closely matches the suns input but is negative which it must be to keep the planet in thermal balance.

00 NASA REVIEW-04

The next Chart 2a is based on the same principle as that shown for the NASA data in Chart 2 looking at 2000 to the present for more detail and we can see that the sun’s is exactly balanced by the energy leaving the planet as it must be when we use the PCM model to generate the temperatures. The model was developed in 2007 and this review used the values calculated by the PCM model.

Further from a total energy, heat, perspective the current increase in global temperatures of just over plus 1 degree Celsius from 1880 is less than 4 tenths of a percent change in the planets heat content. Even 2 degrees Celsius as predicted by the PCM model would be less than 6 tens of a percent change in the planets heat content so making claims of utter disaster for such small amounts of a heat increase is really stretching the point especially since the planet has reached temperatures beyond where we are now many times in the distant past; we are still just barely out of the last ice age after all.

00 NASA REVIEW-05

The point to this analysis is to show that whatever the method used to analyze global temperatures, the in’s and out’s must balance. Clearly the NASA-GISS table LOTI data is not valid for the monthly temperature swings exceed what would be possible in the real world. Maybe if NASA would concentrate on developing real systems and models instead of doing the bidding of politicians their work might actually be valid.

This paper contains original research on the energy balance of the climate (weather) of the planet. A more sophisticated analysis could possibly be done showing what the effect of the1 to 2 degree Celsius increase in global temperatures that has accrued since the end of the little ice age in ~1650 would look like; maybe a 3D chart would work giving another dimension to work with. The energy balance would still be there but the in’s and out’s would have a pattern similar to what is shown in the chart of the PCM model and trending upward indicated that there is an increase in temperature


David J. Pristash, Independent Researcher
BBA, EMBA, Graduate GE management program
Captain US ARMY 18A (WIA Retired), Seven issued patents
Member Beta Gamma Sigma

National Geographic Goes Full Fraud Ahead Of Paris


I agree with this Analysis 100% as my personal research shows exactly the same things albeit not as elegantly. All this hype for 2015 being the hottest year ever is only to support the COP21 carbon tax to be proposed in December in Paris. We will be bombard with false claims of high temperatures until the proposed carbon tax is approved by the UN and the required number a signers to make it legal is achieved. According to the current draft treaty the sign up starts in March 2016.

THIS IS THE END OF WESTERN CIVILIZATION!

Tony Heller's avatarReal Climate Science

2015-10-24-06-37-57

How much fraud can National Geographic pack into one image?

  1. The image shows steam. They animated and colored it on their web site to make it look like fire.
  2. The record heat claim is the result of data tampering by NOAA.
  3. Ice has been melting for 20,000 years. It has nothing to do with CO2.
  4. Sea level has been rising for 20,000 years. It has nothing to do with CO2.
  5. Nothing National Geographic or anyone else does will either heat or cool the planet significantly.

Every single claim they are making is fraudulent. Here are the smoking guns.

In 1892, National Geographic reported that glaciers in Europe and Alaska were retreating rapidly. The magazine is denying their own history, and sliming their readers.

from perhaps the tenth to the sixteenth centuries, the glaciers of the Alps were much less extensive than at present.

At present they are in general retreating ……

View original post 222 more words

This is relevant because we are facing a sovereign debt bubble like one never seen on this planet before.


Debt Forgiveness / Cancellations

Debt Foregiveness

QUESTION: Mr. Armstrong; What do you think of the Biblical forgiveness of debt which this time was due with the turn of your model?

ANSWER: Debt cancellation or forgiveness actually was a tradition that began under Sumerian rule in Mesopotamia. The Jewish tradition appears to have been adopted from the Sumerian. Do not forget that Abraham came from the Sumerian city of Ur. Therefore, he would have grown up with that tradition.

Summerian Debt Cancellation

Consequently, the debt cancellation practice began in Mesopotamia and can be traced back to 2400 BC extending into 1400 BC. The noted historian on this subject, Michael Hudson, I believe is absolutely correct when he states that general debt cancellation was one of the principal characteristics of Bronze Age societies in Mesopotamia. There were numerous debt cancellations in the Mesopotamian cities which used the words for these debt forgiveness decrees or cancellations such as amargi in Lagash (Sumer), nig-sisa in Ur, andurarum in Ashur, misharum in Babylon, shudutu in Nuzi.

(See:Michael Hudson’s Debt Cancellations)

However, we are way beyond such a solution thanks to SOCIALISM. Countless people now rely entirely upon pensions and social security type systems for their retirement. Many such programs by decree must invest “conservatively” in government debt. To default will set off a blood-bath if not a Mad Max event. During the Bronze Age, debts were private and did not tend to be expectation that you would be taken care of for life. So the debt structure was entirely different. Today, such a debt forgiveness would cause total economic meltdown. This is why we have proposed the solution we have. There is no option to cancel of default without major civil unrest if not revolution.

The debt cancellations of the Bronze Age can be distinguished as PRIVATE. They were not PUBLIC debts borrowed from the people that they just never paid back. This was a debt forgiveness within the private sector. I might add that during the civil war that ended the Republic of Rome, the people cheered Julius Caesar and assumed he too would cancel all private debts. He adopted a different resolution forgiving all past interest applying that to capital with revaluing property and money to the same purchasing power parity. Clearly, the people were aware of the debt forgiveness ideas in that region. (See Anatomy of a Debt Crisis).

Sumerian-Cone

(Note: We have collected economic text from Mesopotamia as part of our research project in reconstructing the historical economic history of civilization. Here I hold one Sumerian cone from our collection. I funded archaeological digs that would further our knowledge of the past in order to reconstruct the history of the world, much of which the academics will not explain for reasons it will contradict prior theories. Then there is their communistic approach to knowledge.

Villa-of-the-papyriI was asked to fund the dig at the House of the Papyri near Pompey in Herculaneum. Half of this villa has still not been excavated. This was a villa of a book collector and the Greek part of the collection is still buried. Here is all the lost books of Greek historians waiting to to uncovered. The Italian government lacks the money so 20 years after I was asked to fund this project, it still remains undone.

Additionally, the latest issue concerns material that arises on the black market rather than a archaeological dig. For example, during the first Gulf War in Iraq, the bombing uncovered a city previously unknown. The archives of all the text appeared on the black market. Academics boycott such things rather than trying to save them. They object to private people using private funds for research and treat the subject as if it were a communistic state that only they should have such cache to play with. Something I seriously disagree with for there is never always public funds available for such projects.

In this particular case, thousands of tablets were on the black market. I bid to get the entire collection. There was a Norwegian collector of documents, Martin Schoyen. I do not recall what my bid was but it was many millions of dollars. Martin and I met in Zurich for dinner. Since he was a specialist in documents, we reached an agreement that my interest was economic. Martin even had an original Magna Carta. So the deal we struck was that I could use the economic text in return for bowing out of the bidding.

Ur-NammuWhat made this find so valuable was it contained legal code predating Hammurabi who academics teach was the first legal code. Here we have the Legal Code of (ca. 2100BC) which is the oldest known, written law code that predates Hammurabi’s law code by about 300 years. The translation of this legal code was provided by Martin Schøyen, a Norwegian collector of manuscripts containing over 13,000 documents. His private efforts have contributed greatly to our knowledge base when government funding for translation is lacking and academic lack the funds to save material on the black market. When the Legal Code of Hammurabi (1792-1750BC) was first discovered in 1901, his laws were heralded as the earliest known examples. Subsequent to that discovery, older collections of legal codes have been unearthed. There are even older Babylonian copies of the Legal Code of Ur-Nammu (ca. 1900-1700 BC).

When I say we have THE largest database known to humankind, I am not exaggerating. You cannot create models if you lack the data to input. How can you forecast a debt crisis or list the possible outcomes without understanding how such a crisis has been resolved throughout history or how they appeared in the first place. People can pretend to do what we do, but how is that possible without the data?