Is Climate Change Caused Only by the Sun?


Armstrong Economics Blog/Climate Re-Posted Oct 27, 2020 by Martin Armstrong

QUESTION: Do you think the entire climate change is caused by the sun?

KS

ANSWER: No. Nothing can be reduced to a single cause and effect. There is a 300-year cycle in the energy output of the sun. But solar minimum changes the output to greater intensity of gamma rays. This may be responsible for the increase in volcanic activity during solar minimum. What is clear is that it has been the volcanic activity that has caused the major declines in temperature, which have resulted in famines and drastic weather changes such as the year without a summer.

This certainly cannot be contributed to simply CO2 any more than it can be simply reduced to the sun only. There is far more complexity involved, which we really need to explore. This agenda to crush the economy and rebuilt it green is not supported by the evidence.

Germany’s Anti-Greta: Naomi Seibt


Armstrong Economics Blog/Climate Re-Posted Oct 22, 2020 by Martin Armstrong

I find it fascinating how a 19-year-old can do the research that climate change is natural and that whatever impact humans have is negligible. All we have to do is go to the NASA site and look at the current composition of the atmosphere. CO2 is about 0.04%. I just do not see how we need to change the world to save the planet, but like the virus, this too seems to be a sham. It is the third attempt to impose Marxism on the entire world.

Here is another source SPACE.COM

Al Gore – Really the true Clown


Armstrong Economics Blog/Climate Re-Posted Oct 21, 2020 by Martin Armstrong

COMMENT: Just an observation after reading the blog on how scientific illiterate Al Gore is. I actually had to LOL when I noticed that on the cover of his book “An Inconvenient Truth” the hurricane image arising from the smokestack was backwards and obviously none of his genius scientific advisors knew enough to notice. A hurricane is an intense low pressure system and spins counterclockwise, they depict it spinning clockwise!

EJW

REPLY: You are correct. Gore was bad at math and science in school. I suppose he slept through the class that explained typhoons or hurricanes move differently in different parts of the world. They will always spin counterclockwise in the Northern Hemisphere, and spin in the opposite direction in the Southern Hemisphere. No wonder the judge ruled it was just opinion and not science.Categories:Climate

A Technical Study in the Relationships of Solar Flux, Water, Carbon Dioxide and Global Temperatures, September 2020 Data


Carbon Dioxide CO2 is not making “ANY” dangerous changes to the global temperature!

From the attached report on climate change for September 2020 Data we have the two charts showing how much the global temperature has actually gone up since we started to measure CO2 in the atmosphere? To show this graphically Chart 8 was constructed by plotting CO2 as a percent increase from when it was first measured in 1958, the Black plot, the scale is on the left and it shows CO2 going up a bit over 31.0% from 1958 to April of 2020. That is a very large change as anyone would have to agree.  Now how about temperature, well when we look at the percentage change in temperature from 1958, using Kelvin (which does measure the change in heat), we find that the changes in global temperature (heat) are almost un-measurable. The scale on the right side had to be expanded 10 times (the range is 40 % on the left and 4% on the right) to be able to see the plot in the same chart in any detail. The red plot, starting in 1958, shows that the thermal energy in the earth’s atmosphere increased by .40%; while CO2 has increased by 31.0% which is 78 times that of the increase in temperature. So is there really a meaningful link between them that would give as a major problem? The numbers tell us no there isn’t.

The next chart is Chart 8a which is the same as Chart 8 except for the scales which are the same for both CO2 and Temperature. As you see the increase in energy, heat, is not visually observably in this chart hence the need for the previous chart 8 to show the minuscule increase in thermal energy shown by NASA in relationship to the change in CO2. Based to these trends, determined by excel not me, in 2028 CO2 will be 428 ppm and temperatures will be 15.0o Celsius and in 2038 CO2 will be 458 ppm and temperatures will be 15.6O Celsius. This is what the data shows no matter what the reasons are, so I have no idea how the IPCC gets to predict that the world will end in ten or even twenty years.

The full 40 page report explains how these charts were developed and why using NASA and NOAA data that are used without change to prove that The New Green Deal is not required and any attempt to complete that plan will be a worldwide disaster.

Click on the link below for the full report that you can download.

It’s Al Gore Destroying your Future – His Manipulation of the World Opinion on Climate


Armstrong Economics Blog/Climate Re-Posted Oct 13, 2020 by Martin Armstrong

In the April 28, 1975 edition of Newsweek, they actually proposed solutions for climate change that included outlawing internal combustion engines. The interesting aspect was the fear at that time was about global cooling — not global warming. The 70s were dominated by the fear that we were facing manmade global cooling, not warming. TIME magazine’s January 31, 1977 cover featured a story, “How to Survive The Coming Ice Age.” It included “facts” such as scientists predicting that Earth’s so-called average temperature could drop by 20 degrees Fahrenheit due to manmade global cooling. Dr. Murray Mitchell of the National Oceanic and Atmospheric Administration warned readers that “the drop in temperature between 1945 and 1968 had taken us one-sixth of the way to the next Ice Age temperature.”

Global cooling was the big scare as it gained considerable support among me-too scientists as we once again see today with global warming.  However, suddenly as everything is cyclical, instead of cooling as long predicted by manmade climate change advocates, the planet began to warm again. OMG! We were wrong! Something had to be done to rescue the climate change agenda from total disaster and scientists who proved they were not so scientific.

This is when Al Gore came to the rescue. Just like the poles flip on the sun every 11 years, Al Gore flipped the argument from manmade cooling to manmade warming to save the end goal — eliminating all fossil fuels regardless of the evidence. Who needs science when you can just make up the studies and cherry-pick the facts to support whatever you want.

Al Gore Sr. was a very influential and powerful Senator from Tennessee. Even Wikipedia said that Gore was “an avid reader who fell in love with scientific and mathematical theories, but he did not do well in science classes and avoided taking math.” Nevertheless, his father made sure that his son was elected to the House of Representatives, serving from 1977 to 1985, and then going on to the Senate from 1985 to 1993.

Gore’s primary issue became his obsession that the Earth would perish if we did not eliminate fossil fuels. When he advanced to Vice President under President Bill Clinton, Gore was at last able to enact policies and direct funding to ensure that the climate change agenda became a top priority of the United States Government. Gore had the authority now to create the President’s Council on Sustainable Development. Gore immediately changed the Council’s Charter on April 25, 1997, amending the “Scope of Activities” to include advise the President “on domestic implementation of policy options to reduce greenhouse gas emissions.”

It was Al Gore who steered the Council to identify and encourage the reduction in greenhouse gas emissions across diverse sectors and levels of society. This is the man who has convinced others using science he did not understand and avoided in school, yet he is prepared to push his ideas that are no different than some new religion and force everyone to accept his beliefs or go to prison for even refusing to wear a mask. He joined with Greenpeace, which was engaged in violence to push their agenda, and became a board member of the World Economic Forum to steer that organization against all opposition and to support the fall of democracy because we should not have a vote in how our future is to unfold. He disagrees with the American Constitution that we are entitled to freedom of speech, assembly, and the pursuit of our own happiness. Like all leftists, Al Gore will not tolerate dissent. It is always their way or no way which is why Marxism has killed more than all the wars of religion combined.

The Council was charged originally to advise the President “on matters involving sustainable development.” Gore rejected any alternative points of view on the science of climate change. He deliberately excluded all opposition is the tradition of a true leftist. He had made the conclusion that the Clinton administration would go in the direction of global warming reversing the very same argument from the 70s that fossil fuels were causing global cooling. In the cover letter to the President that was accompanying the 1999 report, Advancing Prosperity, Opportunity and a Healthy Environment for the 21st Century, Gore made sure that the Council concluded: “Our report presents consensus recommendations on how America can reduce greenhouse gas emissions and take other steps to protect the climate.” This was AFTER he blocked all opposition.

The world had to change and anyone who disagreed with Gore had to be rejected and criticized as fake science. This became Gore’s strategy to take over the world and force the abandonment of fossil fuels. He directed all the agencies which included the Department of Energy, Environmental Protection Agency, National Science Foundation, Department of Education, National Oceanic and Atmospheric Administration, and National Aeronautics and Space Administration, to adopt his agenda.

When physicist Dr. William Happer, then Director of Energy Research at the Department of Energy, testified before Congress in 1993 that scientific data did not support the hypothesis of manmade global warming, Gore went nuts. Gore immediately had Happer fired. It was 15 years later when Happer commented: “I had the privilege of being fired by Al Gore since I refused to go along with his alarmism. I did not need the job that badly.” Greenpeace then later tried to slander him saying he was being funded by the energy industry. They always twist the facts and then try to claim if someone is approached for their ideas and asked to do a study it somehow discredits their original conclusions.

Al Gore used his theory to gather a personal fortune that has exceeded $300 million. Gore’s movie, “An Inconvenient Truth,” put forth nothing but propaganda. It was challenged in the courts in London when they were trying to force students to watch it. The court found that Gore’s documentary contains nine key scientific errors. The judge declined to ban the Academy Award-winning film from British schools but ruled that it can ONLY be shown with guidance notes to prevent political indoctrination (see Telegraph 10/11/2007)

A Technical Study in the Relationships of Solar Flux, Water, Carbon Dioxide and Global Temperatures, August 2020 Data


Carbon Dioxide CO2 is not making dangerous changes to the global temperature!

From the attached report on climate change for August 2020 Data we have the two charts showing how much the global temperature has actually gone up since we started to measure CO2 in the atmosphere? To show this graphically Chart 8 was constructed by plotting CO2 as a percent increase from when it was first measured in 1958, the Black plot, the scale is on the left and it shows CO2 going up a bit over 31.0% from 1958 to August of 2020. That is a very large change as anyone would have to agree.  Now how about temperature, well when we look at the percentage change in temperature from 1958, using Kelvin (which does measure the change in heat), we find that the changes in global temperature (heat) are almost un-measurable. The scale on the right side had to be expanded 10 times (the range is 40 % on the left and 4% on the right) to be able to see the plot in the same chart in any detail. The red plot, starting in 1958, shows that the thermal energy in the earth’s atmosphere increased by .40%; while CO2 has increased by 31.0% which is 78 times that of the increase in temperature. So is there really a meaningful link between them that would give as a major problem? The numbers tell us no there isn’t.

The next chart is Chart 8a which is the same as Chart 8 except for the scales which are the same for both CO2 and Temperature. As you see the increase in energy, heat, is not visually observably in this chart hence the need for the previous chart 8 to show the minuscule increase in thermal energy shown by NASA in relationship to the change in CO2. Based to these trends, determined by excel not me, in 2028 CO2 will be 428 ppm and temperatures will be 15.0o Celsius and in 2038 CO2 will be 458 ppm and temperatures will be 15.6O Celsius. This is what the data shows no matter what the reasons are, so I have no idea how the IPCC gets to predict that the world will end in ten or even twenty years.

The full 40 page report explains how these charts were developed and why using NASA and NOAA data that are used without change to prove that The New Green Deal is not required and any attempt to complete that plan will be a worldwide disaster.

Click on the link below for the full report that you can download.

Climate Change & Indoctrinating the Youth


COMMENT: Hi Martin,
I wanted to comment about the blog posting ‘Fauci Belongs in Prison’. Having three children on remote learning by choice because we refuse to subject them to the draconian lockdowns at the school and mandatory mask requirements. Correct me if I am wrong, but didn’t Hitler say something like, “Forget about the adults, we want the children”, and those children turned out to be the killers in WWII.

Unfortunately, we have been able to witness the school’s systems brainwashing propaganda machine in action with our children. In the first week of school our son in middle school was tasked to watching videos with Fauci and Gates about masks, vaccinations, social distancing, etc. The same brainwashing machine was at work with our elementary school students, but it was being directed by the teachers. It is frightening to watch this in action!

My son loves to challenge the teachers with questions, with the information he also reads with me on your blog.
Keep up the awesome work, you are also getting the truth to our kids!

All the best,
KC

REPLY: The schools have been deliberately engaging in this socialistic propaganda to serve this “greater good” with the same old story for the betterment of humankind. Another reader from Canada said their child was told that all the ice will be gone in 5 years and Russia will then invade Canada. This is indeed brainwashing on a major scale.

You Are correct that the entire Hitler Youth actually began in 1922. They banned the Boy Scouts in 1935 and the Nazi Youth adopted much of the same with hiking and camping but provided the indoctrination into the Nazi Philosophy which included racism. They groomed the youth to fight the cause.

This is exactly what the leftist agenda has been doing with our youth for the past two decades with intensity. They now count on them to overthrow Trump and then move to this globalist agenda supported by Climate Change that is for the greater good.

‘Climate arson’ and other wildfire nonsense


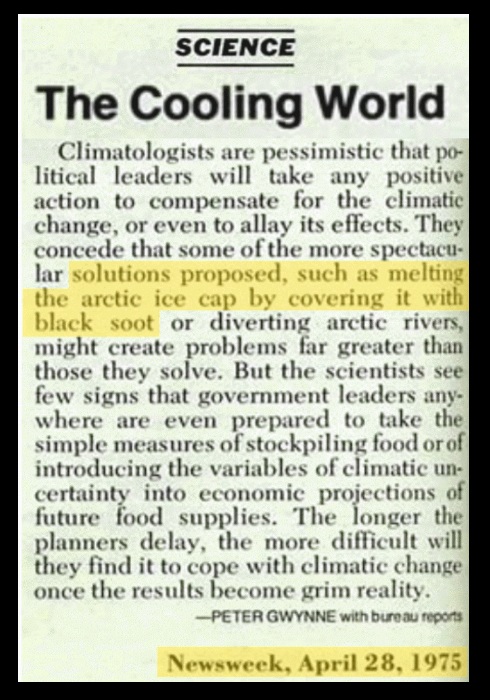
Real goal is to avoid responsibility for policies, and increase control over energy, lives, property

Paul Driessen image

Re-Posted from the Canada Free Press By  —— Bio and ArchivesSeptember 20, 2020

'Climate arson' and other wildfire nonsense

In what has become an annual summer tragedy, wildfires are again destroying western US forests. Millions of acres and millions of animals have been incinerated, hundreds of homes reduced to ash and rubble, dozens of parents and children killed, and many more people left missing, injured or burned.

Air quality across wide regions and entire states is so bad people are told to stay indoors, where many have hibernated for months because of the coronavirus, but indoor air is also contaminated. Acrid smoke and soot have been carried to Chicago and beyond. Firefighters are profiles in courage, as they battle the blazes for days on end, while all too many politicians are displaying profiles in opportunism.

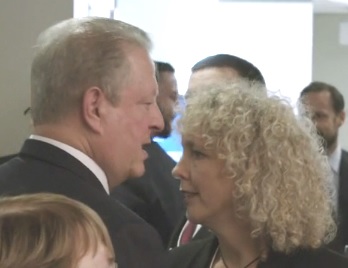
Pelosi: “Mother Earth is angry”

“If you give a climate arsonist four more years in the White House, why would anyone be surprised if more of America is ablaze?” Joe Biden thundered. “Mother Earth is angry,” Nancy Pelosi pontificated. “She’s telling us with hurricanes on the Gulf Coast, fires in the West, that the climate crisis is real.”

Despite finally starting to thin out overgrown forests, California Governor Gavin Newsome resorted to the longstanding party line about his state’s wildfires: Manmade “climate change is real. If you don’t believe in science, come to California and observe it with your own eyes.” Washington Governor Jay Inslee agreed. “These are climate fires,” he said. “And we cannot, and we will not, surrender our state and expose people to have their homes burned down and their lives lost because of climate fires,”

It’s ideological nonsense, intended to deflect blame and avoid responsibility for decades of public policy errors and forest mismanagement – and to justify new laws that would multiply government control over energy, industries, jobs, living standards, lives, property, and freedom to choose where and how we live.

One could argue that people shouldn’t have built homes in and near these forests. That they should have been persuaded or compelled to live in crowded urban areas, where crime, riots and Covid run rampant. But they do live in rural areas – and our politicians, land managers and judges have a duty to implement policies and practices that protect their homes, communities and lives, as well indigenous wildlife.

Perhaps slightly warmer or drier summers have made the wildfires slightly more likely or frequent. But decades of laws, lawsuits, fire suppression policies and forest mismanagement practices have guaranteed the buildup of massive amounts of dead and diseased trees, dry brush and grass, and decaying leaves, needles and debris. With every wet spring spurring plant growth that dries up every dry summer, just one lightning strike, careless camper, gender-revealing pyrotechnic or angry arsonist can ignite an inferno.

Timber harvesting and thinning have been banned for decades

Because timber harvesting and thinning have been banned for decades, thousands of scrawny trees grow on acreage that should have just a few hundred full-sized mature trees. As of 2017, tens of billions of scrawny trees mix with 6.3 billion dead trees in 11 Western states; state and federal forests in California alone had over 129 million dead trees. Those numbers have most assuredly skyrocketed since 2017, while steadily increasing dry brush and debris now provide even more tinder for super-heated conflagrations.

Flames in average fires along the ground in managed forests might reach several feet in height and temperatures of 1,472° F (800° C), says Wildfire Today. But under conditions now found in western tinderboxes, flame heights can reach 165 feet (50 meters) or more, and crown fires can generate critter-roasting, soil-baking temperatures that exceed 2192 degrees F (1200 C). Wood bursts into flame at 572 F. Aluminum melts at 1220, silver at 1762, and gold at 1943 degrees F (1064 C)! 2192 degrees is hellish.

Most of this heat goes upward, but super-high temperatures incinerate endangered wildlife – as well as organisms and organic matter in thin western soils that for decades afterward can support only weeds, grass and stunted, spindly trees. Western conflagrations jump fire breaks because these ferocious fires are fueled by the unprecedented increase in combustibles that radical environmentalist policies have created.

These monstrous fires generate their own high winds and even mini tornados that carry burning branches high into the air, to be deposited hundreds of feet away, igniting new fires.

None of this has a thing to do with climate change. To say a 0.1, 0.5 or even 1.0 degree change in average global temperatures would alter these forest fire dynamics defies credibility. To say the monumental fuel buildups in our forests are irrelevant is like claiming a minimally furnished home will burn as easily and ferociously as one filled to the brim with furniture, books, old newspapers and cans of gasoline.

The solution is simple

The solution is simple, though expensive and time-consuming at this point. Cut the red tape. Remove some of that fuel, so that fires don’t get so big, hot, powerful, and destructive. Clear wider areas around buildings, homes and communities. Create more, wider fire breaks. Build more roads that let people escape the flames. Send the timber to sawmills, to create jobs and tax revenues, and American lumber for affordable homes. Clear out brush and grass under transmission lines – and upgrade the transmission lines. Bolster rapid-response airborne and ground-based firefighting capabilities.

Up to now, all this has been prohibited, litigated and shut down in states that now have horrific fires. Radical Greens have even blocked cattle grazing that would control grass and brush in national forests.

Still not convinced? Look at recent major fires that petered out when they reached managed forests.

For years, San Carlos Apache Indian Reservation foresters chain-sawed overgrown trees, harvested better timber, improved timber stands, and used controlled, prescribed burns, weed killer and other measures to keep their forests healthy, protect sacred sites, and preserve jobs and wildlife. They even turn scrubby trash trees into particle board and sell it for furniture, as part the tribe’s timber business.

In 2017, the Wallow Fire, the most destructive wildfire in Arizona history, burned 538,000 acres – but fizzled out when it reached the reservation’s well-managed forest. A year later, the Rattlesnake Fire torched more than 20,000 acres in the Apache-Sitgreaves National Forest – but likewise faded out when it reached the neighboring White Mountain Apache timberlands, which had also been managed responsibly and proactively, using the same management practices that guide San Carlos Apache foresters.

For decades, the Southern California Edison electric utility employed selective logging, prescribed burns and other management strategies in its Shaver Lake Forest

Similar success stories can be found in the most unlikely place: California. For decades, the Southern California Edison electric utility employed selective logging, prescribed burns and other management strategies in its Shaver Lake Forest. This year’s Creek Fire raged through treetops and several hundred thousand acres in the Sierra National Forest. But when it reached the SoCalEd timberlands, it dwindled into a low-intensity surface or ground fire – which doesn’t incinerate big trees and wildlife.

Back in August 2013, the monstrous high-intensity Rim Fire immolated 180,000 acres in the Stanislaus National Forest. Thankfully the National Park Service (NPS) had been employing prescribed burning and other proactive management practices for years in Yosemite National Park next door. When the wildfire reached the park, it turned into a far less destructive surface fire.

The ferocious Rough Fire of 2015 roared through California’s Sequoia and Sierra National Forests, totally torching 150,000 acres. But it too became a ground fire when it reached Sequoia National Park, where the NPS had also used prescribed burns and other good management practices for decades.

A final point. The raging fires in our long mismanaged forests are not natural. They are not what used to burn with regularity through America’s forests. A century of fire suppression and fuel accumulation means they turn into superheated infernos. Manage them properly first. Then let nature work again.

The lesson? Regardless of what Earth’s climate may do – regardless of who or what may be responsible for any fluctuations – we must take responsible, appropriate, effective measures now. Doing so will save habitats, wildlife, homes and human lives today, and tomorrow.

We cannot and must let more megafires incinerate forests and people for decades to come, under an hubristic, misguided, ideological belief that we can eventually end global fossil fuel use and control planetary climate and weather conditions, thereby somehow making monster wildfires a dim memory.

A Technical Study in the Relationships of Solar Flux, Water, Carbon Dioxide and Global Temperatures, July 2020 Data


From the attached report on climate change for July 2020 Data we have the two charts showing how much the global temperature has actually gone up since we started to measure CO2 in the atmosphere? To show this graphically Chart 8 was constructed by plotting CO2 as a percent increase from when it was first measured in 1958, the Black plot, the scale is on the left and it shows CO2 going up a bit over 31.0% from 1958 to July of 2020. That is a very large change as anyone would have to agree.  Now how about temperature, well when we look at the percentage change in temperature from 1958, using Kelvin (which does measure the change in heat), we find that the changes in global temperature (heat) are almost un-measurable. The scale on the right side had to be expanded 10 times (the range is 40 % on the left and 4% on the right) to be able to see the plot in the same chart in any detail. The red plot, starting in 1958, shows that the thermal energy in the earth’s atmosphere increased by .40%; while CO2 has increased by 31.0% which is 78 times that of the increase in temperature. So is there really a meaningful link between them that would give as a major problem? The numbers tell us no there isn’t.

The next chart is Chart 8a which is the same as Chart 8 except for the scales which are the same for both CO2 and Temperature. As you see the increase in energy, heat, is not visually observably in this chart hence the need for the previous chart 8 to show the minuscule increase in thermal energy shown by NASA in relationship to the change in CO2. Based to these trends, determined by excel not me, in 2028 CO2 will be 428 ppm and temperatures will be 15.0 degrees Celsius and in 2038 CO2 will be 458 ppm and temperatures will be 15.6 degrees Celsius. This is what the data shows no matter what the reasons are, so I have no idea how the IPCC gets to predict that the world will end in ten or even twenty years.

The full 40 page report explains how these charts were developed and why using NASA and NOAA data that are used without change to prove that The New Green Deal is not required and any attempt to complete that plan will be a worldwide disaster.

Click on the link below for the full report that you can download.

BLACKBODY TEMPERATURE 2020-07

A Technical Study in the Relationships of Solar Flux, Water, Carbon Dioxide and Global Temperatures, June 2020 Data


From the attached report on climate change for June 2020 Data we have the two charts showing how much the global temperature has actually gone up since we started to measure CO2 in the atmosphere? To show this graphically Chart 8 was constructed by plotting CO2 as a percent increase from when it was first measured in 1958, the Black plot, the scale is on the left and it shows CO2 going up a bit over 31.0% from 1958 to April of 2020. That is a very large change as anyone would have to agree.  Now how about temperature, well when we look at the percentage change in temperature from 1958, using Kelvin (which does measure the change in heat), we find that the changes in global temperature (heat) are almost un-measurable. The scale on the right side had to be expanded 10 times (the range is 40 % on the left and 4% on the right) to be able to see the plot in the same chart in any detail. The red plot, starting in 1958, shows that the thermal energy in the earth’s atmosphere increased by .40%; while CO2 has increased by 31.0% which is 78 times that of the increase in temperature. So is there really a meaningful link between them that would give as a major problem? The numbers tell us no there isn’t.

The next chart is Chart 8a which is the same as Chart 8 except for the scales which are the same for both CO2 and Temperature. As you see the increase in energy, heat, is not visually observably in this chart hence the need for the previous chart 8 to show the minuscule increase in thermal energy shown by NASA in relationship to the change in CO2. Based to these trends, determined by excel not me, in 2028 CO2 will be 428 ppm and temperatures will be 15.0o Celsius and in 2038 CO2 will be 458 ppm and temperatures will be 15.6O Celsius. This is what the data shows no matter what the reasons are, so I have no idea how the IPCC gets to predict that the world will end in ten or even twenty years.

The full 40 page report explains how these charts were developed and why using NASA and NOAA data that are used without change to prove that The New Green Deal is not required and any attempt to complete that plan will be a worldwide disaster.

Click on the link below for the full report that you can download.

BLACKBODY TEMPERATURE 2020-06