The Broken Bond Market – All Noise, No Signal


Tyler Durden's picture

Via Global Macro Monitor blog,

The Fed tightens on Wednesday and bonds rally.  What the hay?

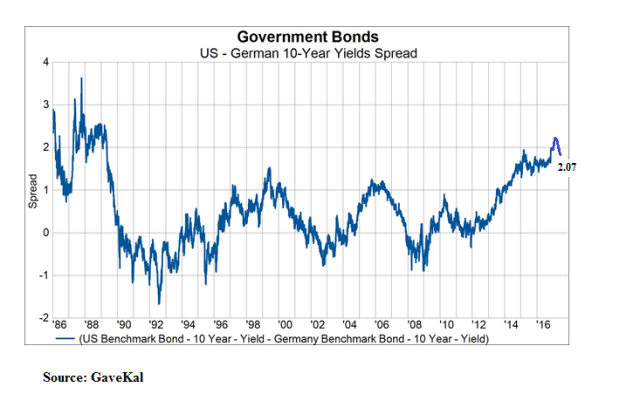
GaveKal, Jeff Gundlach,  and Jim Bianco nailed it in that every spec and their mother are/were short 10-year Treasuries.

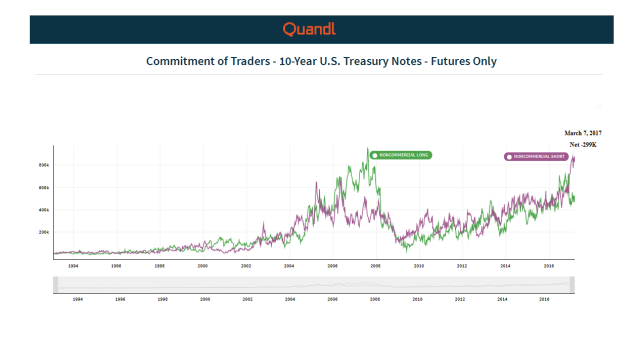
Source: Quandl (see here for interactive chart)

But this is only a small part of the story:  The global bond markets are broken.

There are no signals, there is no noise.  Trying to infer any sense of economic or financial information from bond yields is futile.
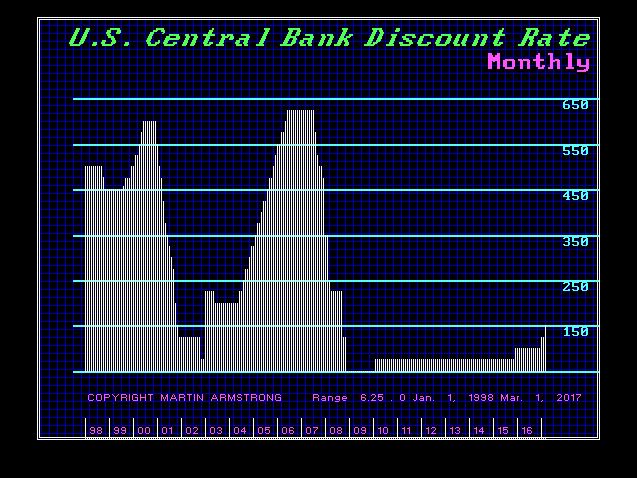
QE Distortion

The intervention into the bond markets by central banks through quantitative easing (QE) in the big four sovereign bond markets – U.S., Japan, Eurozone, and UK – has created a structural shortage of risk-free instruments and distorted the most important price in the world — the yield on 10-year hard currency sovereign bonds.

Furthermore, past QE in the U.S, coupled with the recycling of foreign capital flows back into the U.S. bond market, has, in particular, created an acute structural shortage of longer-term Treasury securities.  The totality of short positions of the fast money in both the cash and derivatives market are probably a much larger proportion of the effective float of longer-term marketable Treasury securities than what the market currently perceives.  Hence the stickiness of U.S. bond yields.

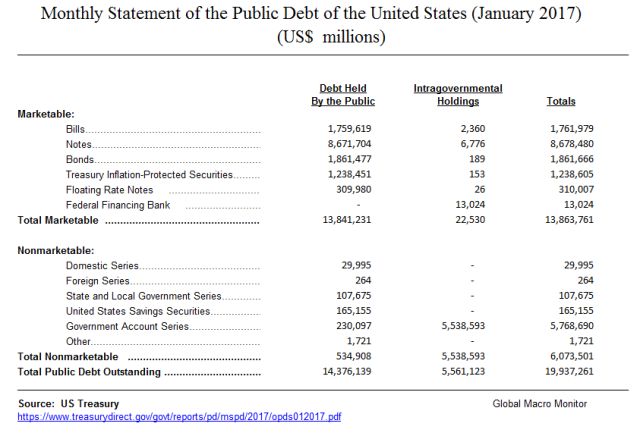
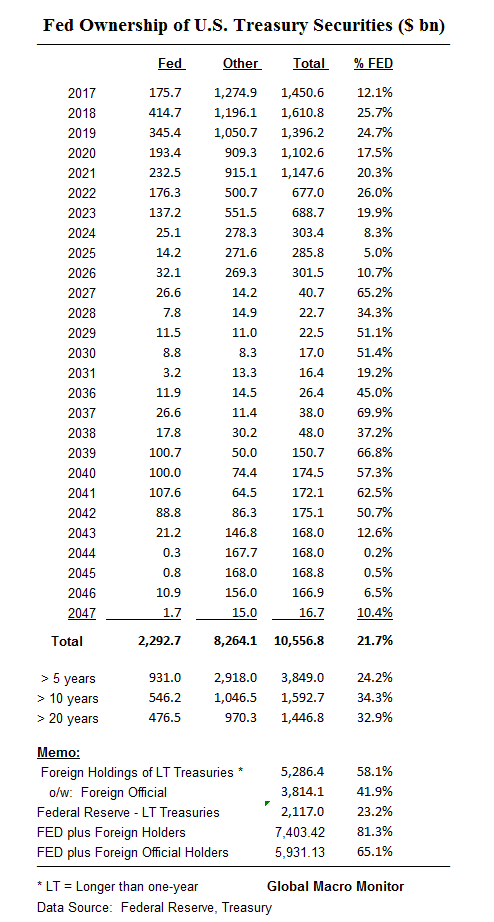
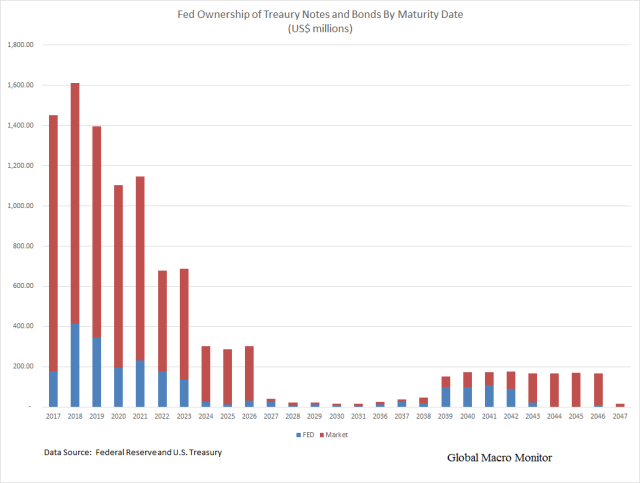
Fed and Foreign Ownership of the U.S. Yield Curve

The table and chart below illustrate just how small the actual float of longer-term marketable U.S. Treasury securities is available to traders and investors.  The data show the Fed owns about 35 percent of Treasury securities with maturities 10-years or longer.  Note the data only include notes and bonds and excludes T-Bills.

The Fed’s holdings combined with foreign ownership of longer maturities — more than 1-year — exceeds 80 percent of marketable Treasuries outstanding.   The Fed combined with just foreign official holdings, mainly, foreign central banks,  is 65 percent of maturities longer than 1-year.  Thus, almost 2/3rds of tradeable Treasuries longer than 1-year are held by entities with no sensitivity to market forces.

Note, the Treasury International Capital  (TIC) data does not break down foreign holdings by year of maturity, only by short-term and long-term – that is, greater than 1-year.

.

.

Foreign Holding of Treasuries

We hear a lot these days about a 1994 bond market debacle.  We lived through that bond bear and it wasn’t fun.   However, the microstructure of the Treasury market  is entirely different today than it was back then.

First,  the Fed did not hold long-term Treasuries.   Second,  foreign holdings of Treasuries were only about 15 percent of the outstanding debt versus around 50 percent today and everybody, including, Ross Perot, who said the trade was “a no brainer”,  were levered long riding the yield curve – short short-term, long long-term.

Foreign inflows,  mainly the result of the recycling of U.S. current account deficits,  resulted in Alan Greenspan’s bond market conundrum and the Fed losing control of the yield curve just prior to the 2007-08 financial crisis.

In this environment, long-term interest rates have trended lower in recent months even as the Federal Reserve has raised the level of the target federal funds rate by 150 basis points. This development contrasts with most experience, which suggests that, other things being equal, increasing short-term interest rates are normally accompanied by a rise in longer-term yields.

…In the current episode, however, the more-distant forward rates declined at the same time that short-term rates were rising. Indeed, the tenth-year tranche, which yielded 6-1/2 percent last June, is now at about 5-1/4 percent. During the same period, comparable real forward rates derived from quotes on Treasury inflation-indexed debt fell significantly as well, suggesting that only a portion of the decline in nominal forward rates in distant tranches is attributable to a drop in long-term inflation expectations.

Alan Greenspan,  Feb 2005

A paper published by the Federal Reserve Board (FRB) in 2012 estimated the impact on interest rates of the capital flow recycling into the U.S. bond market,

We find that a $100 billion increase in foreign official inflows into U.S. Treasury notes and bonds lowers the 5-year yield by roughly 40 to 60 basis points in the short run. However, our VAR analysis shows that in the long-run, when we allow foreign private investors to react to the effects induced by a shock to foreign official holdings, the estimated effect is roughly -20 basis points per $100 billion. Putting these results into context, between 1995 and 2010 China acquired roughly $1.1 trillion in U.S. Treasury notes and bonds. A literal interpretation of our long-run estimates suggests that if China had not accumulated any foreign exchange reserves during this period, and therefore not acquired these $1.1 trillion in Treasuries, all else equal, the 5-year Treasury yield would have been roughly 2 percentage points higher by 2010. This effect is large enough to have implications for the effectiveness of monetary policy. – FRB

Extrapolating the above analysis to the current stock of foreign official Treasury holdings of around $4 trillion leads to nonsensical results, such as the 5-year yield should be 800 basis points higher than it is today.   Obviously, the analysis should truncate the dependent variable – 5-year note yield — and ceteris paribus (other things being equal) does not hold in the real world.

But we should not miss the article’s main point that market interest rates would be much higher if not for foreign central bank interventions into their FX markets and the recycling of those reserves back into the Treasury market.    We take the above analysis seriously but not literally and wonder if the Trump Administration considers it when they rail on “so-called” currency manipulators.

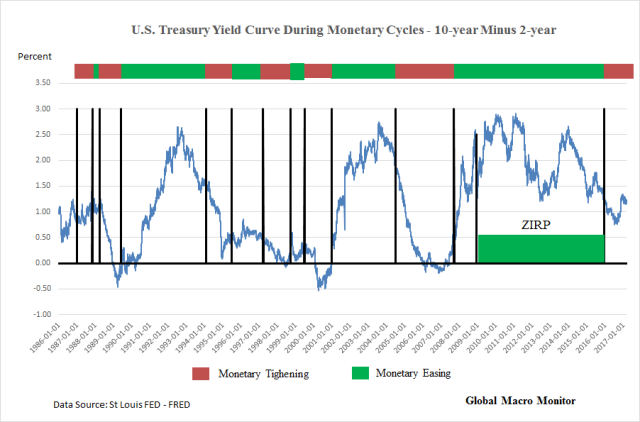
The Yield Curve During Monetary Tightening

We have looked at the data and constructed some charts that show that in monetary tightening cycles in the U.S. the yield curve (10-2 years) usually flattens.

.

In only two of the past six prior tightenings did the 10-year bond rise in yield from the day of the first tightening to the day of the first easing.  This is entirely possible due to the fact the Fed often “tightens until something breaks” and the bond market front runs the expected easing cycle.

During the 2004-07 tightening cycle,  the era of the Greenspan bond market conundrum,  for example, the 10-year yield managed to rise only a maximum of 64 bps during the entire cycle from a beginning yield of 4.62 percent to a cycle high yield of 5.26 percent.   This as Greenspan raised the fed funds rate by 4.25 percent, from 1.0 percent to 5.25 percent.

Was the market forecasting the coming financial crisis?   Hardly.

Alan Greenspan blames the Fed’s loss of control of the yield curve, mainly due to the recycling of capital flows by foreign central banks,  as a major cause of the housing bubble.  Notice the importance of the 10-year yield on the allocation of resources and on how its distortion can be at the root of financial and economic bubbles.

This Time Is Different

Those dreaded words, “this time is different.”   We should warn readers that this time is truly different, however.   When the Fed first raised interest rates in December 2015, for example, the 10-year yield was at 2.24 percent and more than 50-75 percent lower than at the beginning of any other monetary tightening cycle over the past 30 years.  There are many “unprecedents” in this cycle and therefore more uncertainty.

.

Forecasting With The Yield Curve

Given the technical distortion of the bond market, we find it kind of silly with statements such as “what is the bond market telling us?”   Nothing!

There is no price discovery.  Given the intervention and distortion to bond yields caused by the Fed and foreign central banks, who knows what the right interest rate is for longer-term Treasury securities.

We will never forget the words of a prominent market strategist when rates were super depressed.

“ We’re in a depression. That is what the bond market is telling us.”

Even at the Friday close,  we hear equity traders are worried about why the 10-year yield is so low and fell after Wednesday’s Fed tightening.

Information Feedback Loops

One of just many dangers of the lack of price discovery in the bond market is the potential formation of positive feedback loops, where other markets fail to discount these distortions and act accordingly.   That is, for example, the equity markets sell off because they freak out interest rates are declining when they should be rising.  Or the private sector fails to invest in CapX as they wrongly anticipate an economic downturn because of falling or excessively low bond yields.   Their actions thus become a self-fulfilling prophecy.

A flatter than normal yield curve could also adversely affect bank lendingLook at how financial stocks have been underperforming recently as the yield curve has flattened about 7 bps this year.

Conclusion

Welcome to Bond Market Conundrum 2.0.

Asset prices are artificially elevated and foreign exchange rates are distorted due to the repression of the risk-free interest rates because of lack of supply.   Capital has been misallocated and the Fed has once again lost control of the yield curve simply by the very fact it owns the yield curve.

Monetary policymakers probably won’t regain control of the yield curve until they begin to reduce their balance sheets and the supply/demand balance moves closer to equilibrium.

That’s when we suspect everybody and their mother will front run the central bank selling and we will have the real bond market debacle some in the market have been expecting. Will or can that day ever come?  We don’t know.

Of course,  governments could go on a tax cut/spending binge and increase the primary supply of government bonds.   Possible but doubtful and a longer term story,  if any.

Until then?   We still believe bonds are in a slow bleed bear market, which will see fits of massive nutcracking short covering, as interest rates slowly drift higher.

Remember,  there are no signals, there is no noise.   Here’s to hoping the markets understand that.

A Few Caveats

The data points presented above should be taken as rough, but good, approximations.  The dates of each source of data may differ and the same is true for the different data sources.

Furthermore, we may be entirely wrong in our conclusions.

Abraham Lincoln used to tell a story as a young Illinois circuit court lawyer when trying to convince the jury to render a verdict in his favor.

The story goes that Lawyer Lincoln was worried he had not convinced the jury during the closing argument of a civil case against a railroad.   The jurors had gone to lunch to deliberate.  Lincoln followed them and interrupted their dessert with a story about a farmer’s son gripped by panic,

“Pa, Pa, the hired man and sis are in the hay mow and she’s lifting up her skirt and he’s letting down his pants and they’re afixin’ to pee on the hay.” “Son, you got your facts absolutely right, but you’re drawing the wrong conclusion.”

The jury ruled in Lincoln’s favor.

Similarly, when looking at data and charts — the facts —  we often draw the wrong conclusion about future direction.

Stay tuned.

Data Appendix

Morgan Stanley: “Only One Thing Will Allow Central Banks To Keep The Party Going”


Tyler Durden's picture

Last week, we presented readers with the latest note from SocGen strategist. Albert Edwards, who explained why after so many years of false rate hike starts, the market not only responded to last week’s hike in a dovish manner – interpreting last Wednesday’s 0.25% hike as a 0.25% rate cut- but as Goldman Sachs showed previously, the dovish reaction was one of the strongest ones since the financial crisis, in other words: “the market no longer believes the Fed.” This is what Edwards said, citing his FX colleague Kit Juckes:

[T]he Fed’s reluctance to send an aggressive tightening signal, instead preferring to again shuffle upwards its dots just slightly, has disappointed markets. But to be fair, the problem isn’t really with the famous dots. It’s with the market, which just doesn’t believe the Fed will tighten as fast as they say they plan to (see left-hand chart below). If the market took the FOMC at their word and discounted a 3% Fed Funds rate at the end of 2019 and beyond, then we’d probably have a 3% nominal 10-year Treasury yield by now.”

That said, a 3% Fed Funds rate would also lead to steep selloff in risk assets as the dividend yield on the S&P, currently at about 2%, would be about 1% below the risk free rate, leading to a wholesale “great rotation” out of stocks.

And while the market may not believe the Fed is ready – and willing – to push rates that high, the relationship also cuts both ways.

As RBC also noted last week, explaining that while the Yellen put is alive and well, the market will simply not tighten financial conditions on its own, forcing Yellen to aggressively hike further… which the Fed may be reluctant to do.

That is the argument in a note released late last week by Morgan Stanley’s credit strategists, who note that while the party is still going strong, some 93 months into the current cycle, it may not continue should the Fed engage in an aggressive rate hike scenario. This is what they say:

At 93 months, the current cycle is already longer than all but two post-war recoveries (out of 12 total). We could certainly debate why this expansion is already longer than normal, but strong growth is clearly not the reason. In fact, quite the opposite – a lackluster economic backdrop for years, leading to massive central bank support,has likely kept the cycle going more than anything else. Last year is a good example. As we show below, early in the year, with oil collapsing and the economic data rolling over, recession risks were seemingly rising. As Exhibit 3 shows, central banks across the globe responded. Even the Fed provided stimulus (verbally) by allowing the market to go from pricing in almost three rate hikes at the end of 2015 to almost zero rate hikes in summer 2016. Markets recovered, and the economic data followed.

What is Morgan Stanley’s conclusion? Simple: for the party to continue, not only must the Fed revert back to its quasi-dovish mode, but for that to happen the recent economic “rebound” has to end (the sooner the better), extinguishing any reflationary impulse, removing the impetus for Yellen to hike aggressively further, and allowing the Fed to remain on hold for an indefinite period of time.  In short: “In our view, for the cycle to last another several years, we want to see more of the same – a continued environment of ‘ok’ growth and low inflation, which allows central banks to keep the party going.”

Hopefully Trump, whose policies threaten to upstage this delicate balance benefitting the 1%, has read the memo.

The Long Run Economics Of Debt Based Stimulus


Tyler Durden's picture


Onward vs. Upward

Something both unwanted and unexpected has tormented western economies in the 21st century.  Gross domestic product (GDP) has moderated onward while government debt has spiked upward.  Orthodox economists continue to be flummoxed by what has transpired.

What happened to the miracle? The Keynesian wet dream of an unfettered fiat debt money system has been realized, and debt has been duly expanded at every opportunity.  Although the fat lady has so far only cleared her throat (if quite audibly, in 2008) and hasn’t really sung yet, it is already clear that calling this system careening toward a catastrophic failure.

Here is the United States, since the turn of the new millennium (starting January 1, 2001) real GDP has increased from roughly $10.5 trillion to $18.6 trillion, or 77 percent.  Over this same time government debt has spiked nearly 250 percent from about $5.7 trillion to $19.9 trillion.  Obviously, some sort of reckoning’s in order to bring the books back into balance.

Throughout this extended episode of economic and financial discontinuity, the government’s solution to jump-starting the economy has been to borrow money and spend it.  Thus far, these efforts have succeeded in digging a massive hole that the economy will somehow have to climb out of.  We’re doubtful such a feat will ever be attained.

In short, additions of government debt over this time have been at a diminishing return.  Specifically, at the start of the new millennium the debt to GDP ratio was about 54 percent.  Today, it’s well over 100 percent.

US GDP and US federal debt, indexed (1984 = 100). Mises noted back in the late 1940s already that “it is obvious that sooner or later all these debts will be liquidated in some way or other, but certainly not by payment of interest and principal according to the terms of the contract.”  If it was obvious then, it is glaringly obvious today. Greece and Cyprus demonstrated what happens when modern socialist welfare states have no independent access to a printing press and are thus unable to extend and pretend in the traditional Keynesian way. The Potemkin village disintegrates on the spot at the first whiff of suspicion. All the nations that have postponed the reckoning by printing money and the flight forward mechanism of amassing even more debt have simply made the eventual denouement more profound – click to enlarge.

The idea that the government could spend borrowed money to grow the economy out of debt has become patently ridiculous.  Nonetheless, government economists continue to advocate these policies because, academically, they have no other alternatives.  At the same time, politics may now conspire to push the U.S. government into debt default.

Arrested Development

This week the Obama administration’s debt ceiling suspension expired, and a debt ceiling of $20.1 trillion was triggered.  This reestablished debt ceiling is just a horse’s hair above the U.S. government’s current debt level.  Furthermore, getting the debt ceiling lifted will likely require an epic Congressional battle, including elaborate displays of Kabuki theater.

There’s a possibility a new debt ceiling agreement won’t be reached before the Treasury’s money runs out sometime in late-summer or early-fall.  This would put the U.S. government in a position of not being able to pay its debts.  At a minimum, even if some Congressional deal’s worked out at the 11th hour, the full faith and credit of the U.S. government will be tarnished.

Best case, a timely debt ceiling resolution will cut into President Trump’s plans to boost the economy by borrowing money and spending it on infrastructure and defense.  This will also cut into his plans to reduce taxes.  A stumble in either of these areas could prompt a long overdue stock market panic.

The debt ceiling could become a real problem this time, as the treasury has massively drawn down the cash balance it amassed by issuing humongous amounts of debt to US money market funds in 2016. In the final quarter of 2016, i.e., the dying days of the Obama administration, the federal deficit exploded by a stunning 208 billion dollars – click to enlarge.

The fact is, perpetual economic growth is required to sustain life as we know it in today’s debt-driven economic social order.  Any slight blip, such as 2008, massively disrupts the lives of hundreds of millions of people.  What’s more, economic growth must be at a level where the plebs believe they’re adequately reaping the fruits of their labors.

What that rate of economic growth happens to be is uncertain.  But so far the U.S. economy of the 21st century has failed to attain it.  What is known is that an economy that expands at 3 percent annually, will double the average living standard every 24 years.  In contrast, an economy that expands at an annual rate of 2 percent, will take 36 years to double the average living standard.

The average annual rate of real GDP growth of the U.S. economy in the 21st century has been at a 1.78 percent state of arrested development.  The average annual rate of real GDP growth of the U.S. economy for the 16 preceding years was 3.43 percent – nearly double.  Alas, it has been 12 years since the U.S. economy’s eked out a single year of 3 percent GDP growth.

In spite of statistical distortions reaching fresh heights of absurdity year after year (their goal is generally to make “inflation” look smaller and GDP larger than they really are), economic output as measured by GDP is seemingly on a permanent downward trajectory. Many European countries look even worse. For instance, France had strong growth for more than two decades after WW2, but it collapsed thereafter. Today, government spending in France accounts for 58% of GDP and the country’s microscopic growth rates have become downright embarrassing. But don’t worry, Europe’s political elites and bureaucrats continue to prosper! – click to enlarge.

The Long Run Economics of Debt Based Stimulus

“In the long run, we are all dead,” said 20th Century economist, John Maynard Keynes.  This, in a nut shell, was Keynes’ rationale for why governments should borrow from the future to fund economic growth today.  Why wait for recessions to do the work of equilibrating the economy when a little counter-cyclical stimulus can push growth onward and upward?

J.M. Keynes is certainly dead, but we are still alive and can rightly be referred to as his victims. Keynes is often depicted reading a book, but evidently he must have read the wrong book. And all those who assert that he “didn’t really mean it this way or that way”  should perhaps take the time to read what he wrote. Keynes really was a Keynesian!

Of course, attempting to spend a nation to prosperity using borrowed money is not without consequences.  In the short run, an illusion of wealth can be erected.  In the long run, that illusion slips into decay and disrepair.

Over the past week we’ve been roaming the streets of Mexico City, visiting family and conducting  field research on your behalf.  In particular, we’ve been investigating the chronic effects of what happens when a government spends too much borrowed money, and then attempts to lighten its debt burden by inflating its currency. 

What follows a brief summation of our findings.

On surface, what happens is what you’d expect.  The currency gets utterly destroyed.  This has the effect of blowing the price of just about everything – especially imports – through the roof.  But it’s what happens after which is less obvious.  For the ill-effects of a debased currency express themselves in asymmetric ways.

On a Saturday afternoon walk through the historic city center along Avenida Francisco I. Madero between El Zócalo and the Palacio de Bellas Artes we were greeted with the appearance of consumer prosperity.  Bustling crowds of shoppers made their way through the chic fashion stores that are interspersed between historic 17th and 18th century colonial mansions and buildings.  Modern skyscrapers were in the distance.

Similarly, during a Friday night visit to El Moro, the famous churro and chocolate restaurant that has been in operation since 1935, we encountered a line extending out the door and down the street.  Customers were dressed to impress.  There was hardly a hint of economic hardship about the place.

The original El Moro outlet in Mexico City.

But venture outside the most inner streets of the city’s center and the conditions quickly deteriorate.  An endless sea of multilevel residential dwellings mixed with commercial and industrial properties in varying degrees of decay extend for miles and miles across the high altitude Valley of Mexico.  It appears that, perhaps 50 or 60 years ago, these structures were clean and well-kept.  However, that was before crumbled concrete and exposed rebar became the norm for these vast residential dwellings.

Contrary to what Keynes posited, counter-cyclical debt based stimulus didn’t produce the nirvana of rising long run living standards.  Rather it produced the disparity of stagnating GDP and rapidly rising government debt.  Later it produced the hell of declining living standards over the long run.

The truth is, in the long run we’re not all dead.  Actually, some of us are still here, living with the consequences of shortsighted economic policies.

Residents of Mexico know this all too well.  In the United States, the scope and magnitude of debt has been able to support an illusion of prosperity.  Still, as far as we can tell, many residents are experiencing the transformation of small pockets of slums into vast expansive ghettos.

Storing up a small hoard of gold and silver bullion may’ve never been more critical than the present, in the off chance the inevitable dollar debasement comes sooner rather than later.  So, too, one would be well advised to develop a side hustle now.  From our observation, everyone in Mexico City was working… though many didn’t have jobs.

On Monday we traveled north of the city limits to the ruins of the ancient pre-Aztec city of Teotihuacán.  There we climbed up the Pyramid of the Sun and into the open areas of the Pyramid of the Feathered Serpent.  We walked the Avenue of the Dead toward the Pyramid of the Moon.

Teotihuacán – view from the pyramid of the moon. Aztec priests once ripped out the hearts of sacrificial victims to appease their gods (among those in need of appeasing were Huiztilopochtli, the god of war and the sun, Tlaloc the rain god and not to forget, good old Xipe, a.k.a. “Our Lord, the Flayed One”, god of sacrificial pain and suffering. And you should see their mama… (wait for it). The Aztecs had a god for everything, so there was a lot of sacrificing to do.

At its peak, around 450 AD, Teotihuacán was the largest city in the pre-Columbian Americas, with a population estimated at 150,000.  Yet by the 6th century the population began to decline and the city ceased to exist sometime in the 7th or 8th century.  No one quite knows what happened.

Well, here she is… Coatlicue, the primordial earth goddess, mother of the gods, the sun, the moon and the stars. Judging from her teeth, this multi-tasker was a carnivore.

One theory is that the city’s decline coincided with an extended drought.  Another is that there was an internal uprising.  Maybe a 99 percent situation developed. We kicked a few rocks.  We put our ears to the ground.  We looked.  We listened.

The spirits didn’t answer.  They didn’t have to.  We’d already seen and heard enough.

Taxing Property Going Crazy


Dog House Property Tax

The Left is fighting so hard to keep dominating everyone else, that it is hard not to see how society in starting to implode in the West. In Norway, the hunt for taxes has been so bad, they have now even been raising property taxes to include a dog house in the back yard.

Meanwhile in Greece, people are not taking property that is left to them because they cannot pay the inheritance taxes to accept the property. This was one of the final stages in the collapse of Rome. People just walked away from their property because of taxes.

Why the Crash & Burn is Public not Private


ECM-1970-2084

QUESTION: Hi Mr. Armstrong,
You mentioned the crash and burn applies to government assets, not private sector assets. Can the private sector stand on it’s own two feet?
Thanks again,
MB

Continental Currency-6th-$8-2-26-1777

ANSWER: There are times when the private sector cannot stand and everyone runs to bonds/cash. Likewise, there are times when government can no longer stand and the only thing that survives is private assets. This took place during the collapse of the Weimar Republic (German Hyperinflation) and it has been the case throughout history even at the birth of the USA and the collapse of the Continental Currency.

Sectors Capital Movement

Whenever something happens in one sector, people turn to the next one. Capital will move from region to region and within each region there is still a domestic cycle. The 1987 Crash send capital fleeing from the USA to Japan. Then there was the Japanese Bubble 1989 and capital fled to South East Asia. That then peaked and capital began to rush to Europe for the birth of the Euro. That then peaked and it began to flow back to the USA.

People get burned on real estate, they then move to stocks. The get burned in stocks, then run to bonds/cash. Then they run to commodities. The key remains when there is a great alignment, which we are headed into. That warns the big Crash & Burn lies in government not private for this one

Dollar Drops As Consumer Inflation Expectations Crash To Record Lows


Tyler Durden's picture

Having warned in November 2015 of a “deflationary mindset”, University of Michigan survey director Richard Curtin notes that things have done nothing but get worse.

While reflation trades run amok in capital markets, real people’s expectations of inflation in the medium-term has collapsed to its lowest on record…


In the latest massive setback for the Federal Reserve, which is desperate to break the recent “deflationary mindset” to have gripped the US population (see Japan for the results), long term inflation expectations declined to the lowest level since 1980: an annual rate of 2.2% was expected in the next five years, down from 2.5% last month and 2.3% in December. Just 6% expected long term deflation. These lows were supported by the fewest complaints of rising prices eroding their living standards—just 6%, the lowest since 2002 and barely above the all-time low of 4%.

Sponsored By Legg Mason

Need A Strategy For Income? Find Out About The Three Rs of Dividends

ClearBridge Dividend Strategy Portfolios target total return, risk management and dividend potential. Discover the strength of Legg Mason – A Leader In Separately Managed Accounts.

And this is weighing on the dollar…


The Dollar Index is very close it slowest since the election – seemingly erasing the hope of reflation and exuberance.

Trump – Dollar & Why He Will Fail


World-Capital-Flows-1995-2003

QUESTION: Hi Martin, How is the dollar supposed to continue to rise when Trump and all of his cabinet members want a weaker dollar? They constantly blame others with currency manipulation, all the while they are in fact manipulating the dollar lower with their comments. Hello pot, meet kettle!!! The last 2 Fridays the dollar has sold off drastically wiping out the entire week gains even on positive US market news. When will the dollar index start to breakout again?

ANSWER: Nobody can manipulate the currency market forcing it to change trend. Trump will fail because he cannot manipulate the dollar down when the FX market’s $5.3 trillion per day in trading volume dwarfs the equities and futures markets. Yes, the Treasury has less than $150 billion in its bad to try to manipulate the currency. Good luck. Trump is wrong about China manipulating its currency. You see China going after Bitcoin trying desperately to prevent capital flight. There is nothing Trump can do to prevent the rise in the dollar when you have Europe on life-support as is the case in Japan, and China keeps trying to stop its citizens from putting money offshore.

Even banning all the government together cannot reverse the global capital flows. If the economics of Europe are in crisis and election after election seeks to exit the EU, there is far more at stake than just politics. We are looking at a crisis in European banking as their reserves are made of of Euro members. The ECB hold 40% of member states bonds. A breakup of the Eurozone holds far more chaos than anything you have read about Europe – AND THAT IS AN UNDERSTATEMENT.

We are preparing an institutional risk report on this subject, and it is massively under-reported and not even comprehended. Trump will fail because he and his team lack the scope of international understanding. If we look only at trade, the share of manufactures in world merchandise trade fluctuated in the range of 55-60% between 1973 and 1985, then increased sharply, reaching 75% by 1995. One might expect total recorded world trade, exports plus imports, over all countries to equal financial flows payments plus receipts. But in fact, during 1996–2001, the former was $17.3 trillion, more than three times the latter, at $5.0 trillion. The problem is our accounting system for trade. To reduce the trade surplus Japan had with the USA during the 1990s, we instructed our clients to buy gold on the COMEX and take delivery. The golds was thus exported and resold again into London. The trade surplus was reduced for there is no distinction between a manufactured product and raw commodities.

Likewise, most financial capital flows are not recorded at all. Financial transactions between international financial institutions are cleared by netting daily offsetting transactions. Hence, U.S. banks have claims on Japanese banks for $10 billion and Japanese banks have claims on U.S. banks for $12 billion. Therefore, the net flow recorded in the transactions will be cleared through their central banks with only $2 million from the United States to Japan. Then if the purchase of the good in the USA by Japan are financed, the goods may travel but no money moves between the countries. Since the collapse of Bretton Woods, the introduction of the floating exchange rate system has rendered the global capital flows gibberish from a formal accounting standard since the value of the dollar rises and falls making comparisons impossible using a system that was designed with a fixed exchange rate system in mind. Since the 1970s, this has resulted in a sustained and unexplained balance-of-payments discrepancies in both trade and financial flows.The unrecorded capital flows in netting out positions distorts the real picture. We have to obtain raw data to overcome these problems and then run it through the filter of floating exchange rates to come up with any hope of understanding capital flows

Largest New Discovery of Oil in USA Puts USA in Top Ten


Oil Platform

Another major discovery of oil has been made in Alaska of 1.2 billion barrels. It is the largest find of conventional oil for 30 years on US territory. The discovery was made by the Spanish oil company Repsol on Thursday with its US partner Armstrong Energy. According to a report from the company, the production potential is up to 120,000 barrels of oil per day, and production is scheduled to start in four years. This will probably increase the US standing to overtake Nigeria entering the list of top ten.

Rank Country Barrels (bbl)
1 Venezuela 298,400,000,000
2 Saudi Arabia 268,300,000,000
3 Canada 171,000,000,000
4 Iran 157,800,000,000
5 Iraq 144,200,000,000
6 Kuwait 104,000,000,000
7 Russia 103,200,000,000
8 United Arab Emirates 97,800,000,000
9 Libya 48,360,000,000
10 Nigeria 37,070,000,000
11 United States 36,520,000,000
12 Kazakhstan 30,000,000,000
13 Qatar 25,240,000,000
14 China 24,650,000,000
15 Brazil 15,310,000,000
16 Algeria 12,200,000,000
17 Mexico 9,812,000,000
18 Angola 9,011,000,000
19 Ecuador 8,832,000,000
20 Azerbaijan 7,000,000,000

The Fed Raises Interest Rates & Markets Rally!


CNBUSA-M 3-15-2017

The stock market, gold, silver, and oil all rallied when the Federal Reserve delivered the widely expected increase in its benchmark interest rate on Wednesday, the Ides of March. It said that the domestic economy remained on a path of slow and steady growth. In a statement the Fed said that the United States economy continued to move along expanding at a “moderate pace.” The consumers were spending with businesses and employers were still hiring.

The Fed also noted a recent increase in inflation after a long period of sideways movement. Prices are now rising at roughly the 2% on an annual pace that the Fed regards as optimal, however, picking up the rug reveals that healthcare costs are acting more like oil did during the 1970s. This raises concern that we may be entering really stagflation and not true inflation driven by expanding demand. The Fed now said its focus would be stabilizing inflation. They really need to look closely at the driving forces. As more and more states move into crisis like California, we will see rising taxation to cover the crisis in pensions. This will feed stagflation – and prevent rising inflation from demand.

The Fed’s forecasts have moved in the direction of tightening, and despite what they say publicly, the most serious stimulus is rising stock prices. There was one vote against the rate hike, Neel Kashkari, president of the Federal Reserve Bank of Minneapolis, who said that the Fed’s statement did not provide a reason for Mr. Kashkari’s vote. However, this is because the real reason behind the rate hike has been the rise in the stock market.

CBDFOR-Y

The computer forecast back in 2011 showed that the trend would change in 2015. Indeed, the first rate hike came that December. The next target was 2017 and we have seen the rates continue to rise. The next key target will be 2019.

CBDFOR-Y 3-15-2017

Here is the current Yearly Array. We still see 2019 as a major target objective. Note the Directional Changes either side and higher volatility should begin to appear starting next year.

CBDFOR-Q 3-15-2017

Honing in with the quarterly level, it appears we should be looking at the 1st quarter 2018 as the main target. Note the Directional Change coming the 3rd quarter here in 2017.

CBDFOR-M 3-15-2017

CBDUSA-Q 3-15-2017

We see the resistance standing at 2.25%. So we have a full 1% above the current level to rise before one must consider the crisis in interest rates begins. Keep in mind that low interest rates helps government but kills pensions. Higher rates will help ease the Pension Crisis but create a budget crisis.

Bond Holders will Blame Others for Their Losses


Pointing finger blaming others

QUESTION: Hello Martin

I am beside myself when I look at the disconnect that we are seeing in relation to the US equity market and the US bond market.
Are the bond traders and holders of Bonds going to hold them and incur losses from here on in or will they wake up
and look for a better return?
R
ANSWER: Yes. The rating agencies still regard government debt as less risky than corporate. Therefore, pension funds who sell off government debt and replace it with corporate, face argument with rating agencies. The bulk of government debt will undermine pension funds and banks as we move through this crisis. They are victims of tradition and nonsense. They will suffer losses and blame others.