Stocks, Dollar Tumble As Gold Tops $1250; Dead Bill Bounce Dies


Tyler Durden's picture

It appears the false narrative of the failed healthcare reform bill being somehow great news for stocks has been eviscerated in early Asia trading. The dollar has tumbled to its lowest since Nov 10th, Gold has ripped back above $1250, and S&P futures have plunged to 6 week lows.


The Bloomberg Dollar Index has almost erased the entire post-Trump-election gains…

Sponsored By Legg Mason

Need A Strategy For Income? Find Out About The Three Rs of Dividends

ClearBridge Dividend Strategy Portfolios target total return, risk management and dividend potential. Discover the strength of Legg Mason – A Leader In Separately Managed Accounts.


US equity futures are tumbling – Dow is down over 700 points from its highs…


And gold is back above $1250…


It appears faith is fading fast in Trump trades.

On The Edge Of An “Uncontrollable Liquidity Event”: The Definitive Guide To China’s Financial System


Tyler Durden's picture

While most traders over the past month have been obsessing over developments in Washington, the real action – most of it under the radar – has played out in China, where as discussed over the past few weeks, domestic liquidity has tightened notably, culminating with an unexpected bailout by the PBOC of various smaller banks who defaulted on their interbank loans as interested rates particularly on Certificates of Deposit (CD) – which have become a preferred funding conduit for many Chinese banks – soared. Ironically, these mini PBOC bailouts took place only after the PBOC itself decided to tighten conditions sufficient to choke off much of the shadow debt funding China’s traditional banks.

As a result, the interbank CD rate rallied strongly, leaving a narrower or negative spread for some smaller banks, whose legacy carry trades (see below for details) suddenly became unprofitable. Also, as reported last Tuesday, several small banks failed to meet overnight repo obligations. This liquidity tightness has been mainly due to escalating financial deleveraging, as the PBOC has lifted market rates and rolled out stricter macroprudential policy rules.

But all those events in isolation seem as merely noise against what otherwise appears to be a relatively benign, even boring, backdrop: after all, neither China’s stock, nor bond markets, has seen even remote volatility in recent months, and certainly nothing compared to what was experienced one year ago, when the Chinese turmoil nearly led to a bear market across developed markets. Then again, maybe the markets are simply once again behind the curve due to all the inherent complexity of China’s unprecedented, financialized and extremely complex pre-Minsky moment ponzi scheme.

Last last week, Deutsche Bank analysts led by Hans Fan released what is the definitive research report summarizing all the latest troubling trends facing China, which judging by capital markets, nobody is paying any attention to. They should, because as Deutsche Bank puts it, if taken too far, they threaten an “uncontrollable liquidity event“, i.e., the financial cataclysm that Kyle Bass and other perma-china-bears have been waiting for.

And, as usual, it all started with rising interest rates, which in turn is leading to increasing funding pressure, which if left unchecked, could lead to dire consequences for China’s underfunded banking system.

Here is a fantastic explanation of everything that has happened in China in recent weeks, and more importantly, what may happen next, courtesy of Deutsche Bank. We urge readers to familiarize themselves with the content as we will refer back to this article in future posts.

* * *

Only in early stage of financial deleveraging

China’s monetary policy has been shifting gradually towards a tightening stance since 2H16. Targeting the liabilities side of the banking sector, the PBOC hiked rates of monetary tools, such as MLF, SLF and OMO (Figure 1), and withdrew liquidity on a net basis after the Chinese New Year (Figure 2). At the same time, it targeted the asset side of the banking sector when it rolled out stricter MPA rules by including off-BS WMP credit in broader credit assessment and imposing stricter-than-expected penalties on banks that fail to comply.

As a result, the key indicators in the money market, including repo and CD rates, all suggest stretched domestic liquidity. For example, the 7-day repo rate, which is the most representative liquidity indicator, has exceeded the interest rate corridor ceiling of 3.45% several times this year (Figure 3). Moreover, the interbank CD rate spiked to 4.6% on 20 Mar 2017, up c.180bps from last year’s low (Figure 4).

We summarize in the below diagram recent financial deleveraging efforts by regulators.


Why push forward financial deleveraging?

We believe the PBOC aims mainly to contain the fast-growing leverage in China’s financial sector. In our view, the country’s financial leverage basically relates to speculators borrowing excessive wholesale funding to grow assets and chase yield, rather than relying on vanilla deposits. To measure this, we believe one of the good indicators of financial leverage is the credit-to-deposit ratio, calculated as total banking credit as a percentage of total deposits. The higher the ratio, the more fragile the financial sector, and the more likely the banking system will run into difficulties to finance unexpected funding requirements. Traditionally the loan-to-deposit ratio was widely used to measure system liquidity risk, but has become increasingly irrelevant in China, as banks are growing their bond investments and shadow banking books to extend credit.

As shown in Figure 6, the credit-to-deposit ratio in China’s banking system has risen sharply by 27ppts since 2011 to reach 116% as of February 2017. We see the rising credit-to-deposit ratio basically is a function of increasing reliance on wholesale funding to support strong credit growth. As of end 2016, borrowing from banks and NBFIs accounted for 17% of total liabilities, against 8% 10 years ago (Figure 7).

Which banks are more leveraged? Joint-stock banks and city/rural banks

As we have long argued, the risks are not evenly distributed in China’s banking system; there are notable differences in the balance sheet structures of different types of banks. As shown in Figure 8, medium-sized banks, which mainly include joint-stock banks, recorded the highest credit-to-deposit ratios and hence are most reliant on wholesale funding. At the same time, small banks, which mainly include city/rural commercial banks, also delivered notable increases in credit-to-deposit ratios, despite a lower absolute level. The credit-to-deposit ratio for small banks has increased by 30ppts since 2010, vs. 14ppts for the big-four banks in the same period.

On the liabilities side, medium-sized and small banks mainly rely on wholesale funding, i.e. borrowing from banks and NBFIs. As of 1H16, wholesale funding made up 31% and 23% for medium-sized and small banks, respectively, against only 13% for big-four banks, as shown in Figure 9.

A closer look into interbank CDs – funding pressure ahead

Wholesale funding for smaller banks has been obtained mainly by issuing CDs in the interbank market. Interbank CDs have supported 20% of smaller banks’ assets expansion over the past 12 months. Since the introduction of interbank CDs in 2014, CD issuance recorded strong growth and the balance jumped 89% yoy to Rmb7.3tr in Feb 2017 (Figure 10), or 3.4% of total banking liabilities.

Joint-stock and city/rural banks account for 99% of issuance (Figure 12). In the coming months these banks have ambitious CD pipelines. More than 400 banks announced plans to issue CDs worth Rmb14.6tr in 2017. This represents 60% yoy growth from the issuance plan in 2016. Investor-wise, WMPs, various asset management plans and commercial banks themselves are the major buyers, which combined make up 79% of the total balance (Figure 13).

However, we view banks that are more reliant on CDs as more vulnerable to rising rates and tighter regulations.

Reflecting tighter liquidity, the interbank CD rate has rallied strongly, with the 6-month CD pricing at 4.6% on average. Some CDs issued by smaller rural commercial banks have been priced close to 5% recently. This would have pushed up the funding cost and notably for smaller banks. If banks invest in low-risk assets such as mortgages, discounted bills and treasury bonds, this would lead to a negative spread. Alternatively, banks can lengthen asset duration, increase the risk appetite, add leverage or slow down asset growth. Among these alternatives, we believe a slowdown in asset growth is the most likely.

Caixin previously reported CDs are likely to be reclassified as interbank liabilities, capped at 33% of total liabilities. This potential regulation could add funding pressure for banks with a heavy reliance on interbank liabilities. With Rmb4tr interbank CDs to mature during Mar- Jun 2017 (Figure 16) and interbank liabilities exposure approaching the limit (Figure 17), joint-stock and city/rural banks are subject to notable funding pressure.

We show the listed banks’ issuances in the chart below. INDB, SPDB and PAB are among the most exposed to interbank CDs.

* * *

What are the implications?

Are we close to a “tipping point”?

For now, probably not, especially in a year of leadership transition. In our view, the risk of an uncontrollable liquidity event is low, as the PBOC will do whatever it takes to inject liquidity if needed. In the domestic liquidity market, the PBOC exerts strong influence in both the volume and pricing of liquidity. With 90%+ of financial institutions directly or indirectly controlled by the government, PBOC will likely continue to give liquidity support. In 2H15, the central bank established an interest rate corridor to contain interbank rates within a narrow range and pledged to inject unlimited liquidity to support banks with funding needs.

However, continuing liquidity injections do not come without a cost. A bigger asset bubble, persistent capital outflow pressure and a lower yield curve over the longer term are side effects that China will have to bear. At the same time, the execution risk of PBOC itself is rising.

Implications on system credit growth

We expect system credit growth to moderate from 16.4% yoy in 2016 (16.1% in Feb’17) to approximately 14-15% yoy in 2017 (Figure 23). As a result, the credit impulse is likely to trend lower from the current high level (Figure 24). The slower credit growth is mainly attributable to several factors: 1) a tighter liquidity stance to push up the funding cost of smaller banks and to force them to slow down asset growth; 2) further curbs on shadow banking; 3) a higher  bond yield to defer bond issuance; and 4) slower mortgage loan growth.


Appendix A – Liquidity flows in China’s interbank market

New deposits supported 55% of asset growth in China’s banking system in 2016. The remaining 45% of new assets were mainly funded by borrowing from PBOC (19%) and borrowing from each other (19%, including bond issuance). While borrowing from NBFIs remained flat for the entire system, it was the main funding source for medium-sized and small banks. We summarize the liquidity flows in China’s interbank market in Appendix A.

Liquidity injection from PBOC. Over the past 12 months, to offset the liquidity drain from falling FX reserves, the PBOC has injected a huge amount of liquidity worth Rmb5.8tr into the banking system, which is equivalent to 400bps of RRR cuts (Figure 29). Of this injection, 30% and 24% have been made to support joint-stock banks and policy banks, respectively (Figure 30). For details, please see our report, PBOC liquidity facilities: Doing whatever it takes, 23 January 2017.

Borrowing from interbank market. Policy banks and big-four banks are net interbank lenders, while joint-stock and city/rural commercial banks are net borrowers. Joint-stock and city/rural banks not only borrow from policy/big banks, but also from each other. This could potentially lead to stronger contagion effects if some of them run into liquidity stress.

Lending/borrowing between banks and NBFIs. There has been a sharp rise in net claims to NBFIs from banks (Figure 33). We believe this is due to rising shadow banking transactions and also arbitrage activities with funds self-circulating within the financial sector. Clearly as shown in Figure 34, small banks are key lenders to NBFIs

Appendix B – What is driving the financial leverage?

From the accounting perspective, we believe the rising credit-to-deposit ratio is mainly due to bank credit circulating back into the banking system as non-deposit liabilities. In normal cases, when a bank makes a $100 corporate loan or purchases a $100 corporate bond, the bank books the credit to a corporate on the asset side while it also books a deposit on the liability side. We show a normal case in Figure 35. However, if a bank’s money circulates back into the banking system, just like in the two cases we illustrate in the diagram below, the $100 deposit is removed but interbank borrowing or borrowing from NBFIs would increase by $100. While there are likely to be many variants of bank credit circulation, we elaborate on two cases in detail.

Case #1: Bank credit circling via NBFIs

It is well known that NBFIs have been serving as SPVs to channel shadow banking credit from banks to corporates in past years. What is  insufficiently addressed though is that NBFIs also have been acting as channels for bank credit circling. Let us show a simple example below:

  • First, Bank A invests in an asset management plan packaged by an NBFI. This is booked as a receivable investment on Bank A’s balance sheet.
  • Second, the NBFI invests further in a CD issued by Bank B. Bank B books the CD under interbank borrowing. The money circulates back into the banking system and no deposit is generated.
  • In some cases, if the yield of the CD does not cover the cost of issuing the asset management plan, the NBFI will leverage up in the bond market by pledging the CD through repo transactions. The leverage could be built up by two transactions: 1) entrusted bond investment (“Daichi” in Chinese); or 2) entrusted investment (“Weiwai” in Chinese), which we discuss in detail in our 2017 outlook report.
  • In this case we use the investment in a bank’s CD as an example. In reality it applies to investment in interbank CDs, interbank negotiated deposits and financial bonds issued by banks, which are all circulating money back into the banking system.

The bank credit circling through NBFIs is growing rapidly. This is evidenced by strong growth in banks’ receivable investments, which reached Rmb21tr as of end-2016 to account for 10% of commercial banking assets, as shown in Figure 36. This represents 80% CAGR in balance since 2013. The majority of these investments was made by medium-sized and small banks. Note that not all receivable investments are credit circling, but we believe it should make up a notable portion. We summarize the structure of banks’ receivable investments in Figure 38.

The NBFI here could be any trust company, broker, fund subsidiary or insurance company. We believe brokers and fund subsidiaries should be the key players, as their bond trading leverage in the interbank bond market is much higher than other participants (Figure 37).


Case #2: Bank credit circling via corporates

Corporate loans may circle back into the banking system as well. This is because many corporates use borrowed but idle cash to buy bank WMPs. Below is a simple example:

  • Firstly, Bank A makes a loan to a corporate.
  • Secondly, the corporate uses the loan proceeds to buy a wealth management product issued by Bank A.
  • Thirdly, Bank A invests the WMP fund in a financial bond issued by Bank B. This corporate deposit would circle back to the banking system as a non-core liability.
  • To make this process economic, in many cases it would require leverage. The corporate borrowing cost may be at 4%, but the financial bond issued by Bank B may only yield 3.5%. To compensate the yield shortage, Bank A has to entrust the WMP fund to a third party and to leverage up by pledging the bonds through repo transactions. This process is called entrusted investment (“Weiwai” in Chinese, or entrusting to an external party).

This type of transaction is not an individual case. As shown in Figure 39, corporates purchased Rmb7.7tr WMPs in 1H16. This accounted for 7% of total corporate debt in China, or 29% of total WMP AUM in the system. SOEs, large private corporate and listed companies enjoy ample bank lending resources with low interest cost. However, the lack of attractive investment projects in their own business prompts them to invest in the financial market (i.e. bank WMPs).

Is Bankruptcy For Illinois The Answer?


Tyler Durden's picture

Authored by Mark Glennon via WirePoints.com,

Could a formal bankruptcy proceeding for the State of Illinois be the answer to it’s fiscal crisis? If you think that’s out of the question, as many do, you’re wrong. On the contrary, though Congress isn’t working on it now, the option is quite viable, though subject to obstacles and open issues. The question is certain to gain growing national attention as a number of states sink further into insolvency, so it’s time to get up to speed. I have yet to see a single Illinois politician or reporter raise the question, but plenty of others outside the state are talking about it for Illinois. More on that later.

This article summarizes the basic issues.

First, why? Why would Illinois or any other state consider bankruptcy? Just as for insolvent corporations and municipalities that reorganize, a successful state bankruptcy would provide a fresh start by putting a state on a sustainable path that frees up funding for needed services — funding that’s getting crowded out by legacy debts. It would do that in three primary ways:

  • Debt that cannot be repaid gets cancelled. In the case of governments, that includes unfunded pension liabilities insofar as there’s no realistic hope of paying them. For Illinois, that means part of its $130 billion pension debt could be erased notwithstanding the state constitutional pension protection clause. Unsecured bonds and other debts could also be cut. Illinois will never have a truly balanced budget or be restored to competitiveness unless those cuts are made, as we’ve written so often before.
  • Unfavorable contracts and leases can be cancelled in bankruptcy, which include employment contracts and collective bargaining agreements.
  • Bankruptcy provides an orderly, rational process to sort out who gets what. Without it, a free-for-all eventually sets in for any entity that can’t meet its obligations. Creditors start suing and racing to courts to get the first judgement liens. Bankruptcy halts that tsunami of litigation and foreclosures.

There are constitutional objections to expanding bankruptcy to states. Bankruptcy for governments is a matter of Federal legislation — Chapter 9 the United States Bankruptcy Code. Today, it covers only cities, towns and other municipalities, but not states.

Expert legal opinions differ on whether Chapter 9 could simply be expanded by Congress to states, but my sense is that the weight of opinion is that Congress could, and eventually will, do so.

Congress unquestionably has the power to make bankruptcy laws — it’s expressly granted in the Constitution. Further, its power to apply bankruptcy to municipalities was upheld by courts over seventy years ago. Skeptics think putting state finances under control of a Federal bankruptcy court would upset the notion that states, unlike municipalities, are “sovereigns.”  They cite the 10th Amendment, which reserves to states powers not granted to the Federal government, and the 11th Amendment, which prohibits lawsuits in Federal courts against a state by citizens of another state. For those interested in the details, see the article linked here by Michael McConnell, a Stanford Law School professor.

A leading expert on the other side is David Skeel, a law professor at the University of Pennsylvania. He wrote outright that, “The constitutionality of bankruptcy-for-states is beyond serious dispute.” The key, as he sees it, is that bankruptcy would be entirely voluntary, which should eliminate any concerns about Federal intrusion on state sovereignty.

A professorial legal analysis, however, probably wouldn’t matter in the end. Courts often bend the rules or make new ones when major emergencies or humanitarian issues arise. Even Professor McConnell, who doesn’t like the idea of state bankruptcy, agrees with that:

If we were facing a genuine fiscal meltdown, which could be solved only through bankruptcy or some equivalent process, and if the use of that process enjoyed the support of Congress, the President, and the affected states, it is not hard to imagine the Court swallowing its theoretical objections.

Beyond the legal issues, some fear that merely authorizing the option of bankruptcy would drive up state borrowing cost because potential bond buyers would face the added risk of having debt cancelled. That’s probably true for states in or near insolvency, but wouldn’t it also instill the needed borrowing discipline never to get to that point?  Bankruptcy would only be available upon insolvency — that’s already required under the Code — which means inability to pay what’s owed. If you can’t pay you won’t pay, bankruptcy or no bankruptcy, so it might not make a difference in the long run. In any event, higher borrowing costs would only result during the period from when it was authorized to when a state filed.

Remember that most objections to bankruptcy come from the municipal bond industry, so take them with a huge grain of salt. That industry primarily just wants to protect against losses on bonds already issued. The state shouldn’t be concerned about those; only future borrowing costs should matter. Future borrowing costs are lowered, not raised, if a successful bankruptcy reduces legacy debt.

And remember that the muni bond industry is already well aware that Congress could extend bankruptcy to the states. Rest assured they know all that’s being written here, and much more. They are way ahead of the curve. To some extent, they’ve already built bankruptcy risk into what they will pay for state bonds. And their efforts to shore up their position to assure they come ahead of taxpayers and other creditor are underway, discussed in our earlier article.

Public employee unions and their supporters also don’t like bankruptcy because of the threat it poses to pension obligations. That’s perhaps rational, if you assume states will in fact eventually find some way to pay scheduled obligations. Not Illinois, in my opinion. All sides need to get on the same page about the plain math. And a bankruptcy court should not be expected to cut pensions if it’s indeed feasible to pay them in full. Unions would be wise to recognize that bankruptcy courts so far have typically favored public pensioners over unsecured bondholders. However, time is not on the pensioners’ side: The muni bond industry is hard at work doing all it can to get first liens and other mechanisms to attain priority over pensions.

Unions also worry that collective bargaining agreements could be cancelled. Well, maybe. This highlights the most important general question about how state bankruptcy would work. And the issue applies to municipal bankruptcies as well: Who controls the bankruptcy proceeding?

The key here is that, on the face of Chapter 9, the bankrupt government — basically, the incumbent politicians — have exclusive power to submit the plan of reorganization. But it’s essential, if a bankruptcy is to be successful, that the same politicians and special interests responsible for bankrupting a government not control the bankruptcy, too. Otherwise, that government is doomed forever and a day.

That problem can be overcome in a number of ways that could be written spacifically into legislation expanding Chapter 9 to states. That is, Chapter 9 would not be extended ‘as is’ to states; appropriate changes for states certainly would be made.

Puerto Rico offers a particularly interesting way to address the problem. For Puerto Rico, Congress last year passed legislation similar to bankruptcy, known as PROMESA, that included appointment of a qualified ,seven-member oversight board. That board effectively has control over most major financial issues and will have to sign off on any reorganization plan that cuts debts. Opponents of bankruptcy for states are terrified that PROMESA may have set some sort of precedent. A national television ad campaign opposed PROMESA while Congress was considering it for just that reason. We’ll be writing separately about PROMESA and whether parts of it could work for Illinois.

The problem of who controls the bankruptcy can also be overcome at the state level. Detroit handled the problem in its bankruptcy by having the state appoint an emergency manager empowered to negotiate its reorganization plan. The same concept could work for appointment of a financially competent control board similar to New York City’s during its crisis in the 1970s.

Various “bankruptcy-light” proposals have also been floated. They would have Congress use its bankruptcy power to allow states cut pension debt through a proceeding short of a full bankruptcy. One, proposed by the Manhattan Institute, was the subject of a Chicago Tribune guest article last year.

But that’s about all you’ll find from the Illinois press about bankruptcy for states. Outside, however, the discussion has proceeded for some time. In 2011 the New York Times reported that policymakers were working behind the scenes to come up with a way to let states declare bankruptcy. They did their work “on tiptoe,” according to the Times, to avoid alarming the municipal bond community. Supporters included Jeb Bush and Newt Gingrich.

Legislation never materialized but the discussion continues. Bloomberg-Business Week wrote last year under the headline, “The Case for Allowing U.S. States to Declare Bankruptcy.” Significantly, William Isaac also wrote last year that both Illinois and Chicago should already be in bankruptcy. He’s the former Chairman of the FDIC and a nationally recognized insolvency expert.

I’m not quite to the point of saying bankruptcy for Illinois is unavoidable, but it’s getting mighty close.

*  *  *

For those who dismiss the possible need for bankruptcy, I’ll let two points suffice here:

  • The only legal ways to cut the state’s $130 billion unfunded pension debt, thanks to the Illinois Supreme Court’s interpretation of the Illinois Constitution, are 1) amendment of the state’s constitution, or 2) bankruptcy. However, the constitutional amendment might not work because serious objections would remain under the United States Constitution. Further, amending the state constitution then cutting pensions would would raise the question, “Why only pensions?” Shouldn’t other debts, especially unsecured bonds, be cut equally?  That would be an entirely fair objection, and the only way to fairly cut those other debts along with pensions is bankruptcy. Nobody has ever proposed a solution for Illinois that truly balances the budget and pays its debt. Pensions already consume about 25% of the state’s budget even though they remain badly underfunded, which keeps the pension debt growing rapidly.
  • The reason why Illinois can’t get a budget solution in place is there’s not any real one to be had. The true budget deficit is two to three times the official one that lawmakers can’t balance. See the numbers linked here. Spending has already been slashed, and tax increases attempting to stabilize the state would be suicide — they would backfire by accelerating the flight of our tax base, ultimately lowering revenue. Illinois will continue to sink rapidly into further debt unless existing obligations, especially pension debt, get cut.

Your Pension Will Be At The Center Of America’s Next Financial Crisis


Tyler Durden's picture

Authored by Jeff Reeves via The Hill

I’m not a fan of the “greed is good” mentality of Wall Street investment firms. But the next financial crisis that rocks America won’t be driven by bankers behaving badly. It will in fact be driven by pension funds that cannot pay out what they promised to retirees. According to one pension advocacy organization, nearly 1 million working and retired Americans are covered by pension plans at the risk of collapse.

The looming pension crisis is not limited by geography or economic focus. These including former public employees, such as members of South Carolina’s government pension plan, which covers roughly 550,000 people — one out of nine state residents — and is a staggering $24.1 billion in the red. These include former blue collar workers such as roughly 100,000 coal miners who face serious cuts in pension payments and health coverage thanks to a nearly $6 billion shortfall in the plan for the United Mine Workers of America. And when the bill comes due, we will all be in very big trouble.

It’s bad enough to consider the philosophical fallout here, with reneging on the promise of a pension and thus causing even more distrust of bankers and retirement planners. But I’m speaking about a cold, numbers-based perspective that causes a drag on many parts of the American economy. Consider the following.

Pensioners have no flexibility

According to a Bureau of Labor Statistics report from 2015, the average household income of someone older than age 75 is $34,097 and their average expenses exceed that slightly, at $34,382. It is not an exaggeration, then, to say that even a modest reduction in retirement income makes the typical budget of a 75-year-old unsustainable — even when the average budget is far from luxurious at current levels. This inflexibility is a hard financial reality of someone who is no longer able to work and is reliant on means other than labor to make ends meet.

Social Security is in a tight spot

So who will step up to support these former pensioners? Perhaps the government, via Social Security, except that program itself is in crisis and will see its trust fund go to zero just 17 years from now, in 2034, based on the current structure of the program. If millions of pensions go bust and retirees have no other savings to fall back on, it will be nigh impossible to cut benefits or reduce the drag on this program. But won’t a pension collapse mean we desperately need Social Security, even in an imperfect form, well beyond 2034?

Pensions

The guaranty is no solution

There is an organization, the Pension Benefit Guaranty Corporation (PBGC), which is meant to insure pensions against failure. However, it was created in 1974 as part of a host of financial reforms and is far from a perfect solution, primarily because it is funded by premiums from defined-benefit plan sponsors and assets seized from former plan sponsors that have entered bankruptcy.

What happens when a handful of troubled pension funds turns into dozens or hundreds? Remember, the PBGC guarantees a certain amount that is decidedly lower than your full pension — as members of the Road Carriers 707 pension fund learned when the group “protected” their pensions by helping to pay benefits, which had been reduced from $1,313 per month to $570. That’s better than zero, but hardly encouraging.

This is not about helping Baby Boomers fund an annual cruise to the Caribbean. Older, low-income pensioners are not saving their money. Instead, they’re spending it on necessities such as food, housing, healthcare and transportation. That means every penny you reduce from their budget means a penny in spending that is removed from the U.S. economy.

Anyone who has taken Econ 101 knows about the “multiplier effect” where $1 in extra spending can produce a much larger amount of economic activity as that dollar circulates around businesses, consumers and banks … or in this case, how $1 less in spending causes a an equally powerful cascade of negative consequences.

By helping ward against a pension crisis, America will be protecting its economy for everyone — plain and simple. But that requires some tough decisions on all sides. For instance, the U.S. Treasury denied a cut to New York Teamsters’ pension plan that was proposed last year. But now the fund is on the brink of collapse, and its recipients are facing benefits that are in some cases one-third what they were 15 years ago.

Like Social Security, current workers can’t contribute enough to offset the big obligations owed to retirees. And as with the flagship entitlement program, it’s up to regulators and legislators to step in — even when it may not be easy — in order to keep the system from collapsing. Let’s hope they make both pension reform and Social Security reform a priority in the near futu

This Is The Nightmare Scenario For The GOP: A $2 Trillion Funding “Hole”


Tyler Durden's picture

When one strips away the partisan rhetoric and posturing, the practical impact of Friday’s GOP failure to repeal Obamacare has a specific monetary impact: approximately $1 trillion.

Since the ObamaCare repeal bill would have eliminated most of the 2010 health law’s taxes, this would have lowered by a similar amount the revenue baseline for tax reform. Essentially, with the ObamaCare taxes gone, it would have been easier to pay for lowering tax rates. Now, if Republicans want to eliminate the ObamaCare taxes as part of tax reform and ensure the bill does not add to the deficit – which they need to do to assure Trump’s reform process continues under Reconciliation, avoiding the need for 60 votes in the Senate – they will have to raise almost $1 trillion in revenue.

In other words that – all else equal – is how much less tax cuts Trumps and the republicans will be able to pursue unless of course they somehow find a source of $1 trillion in tax revenue (or otherwise simply add to the budget deficit) to offset the Obamacare overhang.

Considering Paul Ryan’s statement on Friday, it appears that at least for the time being, Republicans would leave the ObamaCare taxes in place.  “That just means the ObamaCare taxes stay with ObamaCare,” he said. “We’re going to go fix the rest of the tax code.”

Ryan also pushed back on the idea that the setback on healthcare previews difficulties with other items on the legislative agenda  “I don’t think this is prologue to other future things, because members realize there are other parts of our agenda that people have even more agreement on what to achieve,” he said. “We have even more agreement on the need and the nature of tax reform, on funding the government, on rebuilding the military, on securing the border.”

While the failure to pass the healthcare bill makes tax reform harder, “it does not in any way make it impossible,” Ryan said. “We will proceed with tax reform, we will continue with tax reform.” Earlier in the week, Treasury Secretary Steven Mnuchin said that the administration has been working on tax reform for two months and plans to release a plan in the near future. House Ways and Means Committee Chairman Kevin Brady added in a statement that Republicans on his panel “are moving full speed ahead with President Trump on the first pro-growth tax reform in a generation.”

Still, quick action on legislation is unlikely; in fact while the market narrative changed on a dime last Friday, with traders now convincing themselves the delay of Obamacare means tax reform passes quicker, this is not the case. As Larry Lindsey, a former economic adviser for George W. Bush, told CNBC’s “Power Lunch” last Friday, one of the “silliest” things he’s heard from people is that the health-care proposal not passing will be good for Trump’s tax reform. “Absolutely not,” he added.

A replacement for Obamacare “was necessary for budgetary reasons, for tax reform, because it was a revenue gainer,” said Lindsey. Trump’s goals for economic growth should also be questioned now, he warned.

“They might move on to [tax reform] next, but when you have a president who can’t deliver his own caucus, then the president’s position will be weakened on all issues,” Lindsey said. “If you’re in Congress and you don’t like something, you now have an example of how you can ‘roll’ the president.”

* * *

But wait, there’s more.

While the GOP will be hard pressed to find $1 trilion in offsetting savings or revenues, their headaches could be doubled if the proposed border adjustment tax fails to pass next. As a reminder, BAT is expected to generate as much as $1.18 trillion in offsetting revenues; should BAT no be DOA, that’s another $1.2 trillion in potential government revenues that is gone.

According to James Pethokoukis of the American Enterprise Institute of Economic Policy, the fact that the Republicans failed to pass a health-care reform bill makes the odds that they will pass a border adjustment provision much smaller, and “the odds of getting a bigger stimulus plan will drop, too”, he told CNBC on Friday. Investors “won’t get to see cuts to a 15 to 20 percent tax rate” in corporate and marginal tax rates such as those Trump has proposed, Pethokoukis added. Instead, it will likely be closer to what Obama worked toward — something closer to a 30 percent tax rate, he said. It raised the specter of more discontent among Trump’s longtime supporters, considering he campaigned on that specific promise.

Echoing this sentiment, Jared Bernstein, a senior fellow from the Center on Budget and Policy Priorities, said in an interview that tax reform and the health-care proposal were “intimately connected for precise reasons. Trump once suggested achieving growth of 2 to 4 percent, but this might look more like 1 to 2 percent now because of budgetary constraints, he added. Now, the government has less money available to hit “high revenue targets,” Bernstein said.

Summarizing the above, as a result of Friday’s failure, the tax revenue “hole” Republicans have to fill now is at least $1 trillion bigger, and perhaps as large as $2.2 trillion.

* * *

But wait, there’s even more.

As the WSJ writes overnight, in theory rewriting the tax code could be easier than revamping the whole health-care industry. Republicans pride themselves on ideological unity in favor of lower tax rates. And the stakes appear lower for Americans — paperwork and money are far different than matters of life and death. “Tax reform is less visceral,” said Rep. David Schweikert (R., Ariz.) “I can pull up a calculator and say ‘it’s this or this’…it’s hard legislating to anecdotes and stories.”

But scratch deeper, and the GOP quest for a full overhaul of the tax code is fraught with squabbles, procedural hurdles and difficult trade-offs. The party’s failure on health care – after having seven years to prepare – shows how hard it is for Republicans to write complex legislation that attracts support from their moderate and conservative wings. “It’s just a reminder of how incredibly hard transformational legislation is,” said John Gimigliano, a former GOP congressional tax aide now at KPMG LLP.

As the WSJ adds, to succeed, Republicans need to bridge at least three big gaps.

  • First, they need to balance competing desires to cut tax rates sharply and to slow the rise of national debt. Republican leaders in Congress say they want a revenue-neutral plan – one that brings in about as much money as today’s tax system. Faster economic growth might help, but it doesn’t fully bridge the divide. To accomplish revenue neutrality while sharply lowering rates, they will attempt to whack popular tax breaks, such as business deductions of interest on debt and individual state and local tax deductions. They will meet resistance from groups that want to protect those breaks.
  • Second, they have to reconcile alternate visions of what they are setting out to accomplish and who will benefit. Mr. Trump has said his priority is middle-class tax cuts for individuals. “Not the top 1%,” said Mr. Mnuchin. House Speaker Paul Ryan (R., Wis.) and Ways and Means Chairman Kevin Brady (R., Texas) want an overhaul primarily focused on promoting economic growth, even if that means tax cuts that favor the very top of the income scale.
  • The plans they all campaigned on are tilted to the top, according to independent analyses. Third, the party is at odds over the Ryan-Brady plan for border adjustment – taxing imports and exempting exports. The Trump administration has been ambivalent and sometimes critical of the idea. Senate Republicans are outright cold to it. Messrs. Ryan and Brady say it’s crucial because it provides about $1 trillion to offset corporate-tax-rate cuts and it discourages companies from shifting profits abroad.

None of those divisions inside the GOP have been resolved yet, and dozens more are lurking, including debates over tax breaks for renewable energy, credits that aid low-income households, and the treatment of carried interest income for private-equity managers.

“The notion that tax is easier than health is not borne out by the facts, ” a Senate GOP aide told the WSJ. “Having discussed health care for seven years, Republicans were 75% in agreement on the policy. On tax, none of the foundational questions have been answered.”

In short, the market is about to be significantly – perhaps “tremendously” – disappointed once again, and quite soon.

Obamacare Survives thanks to Corruption as Usual


Obamacare

COMMENT: With all the talk of the failed healthcare bill, doesn’t people realize the medical and pharma are the biggest lobbyist to Washington? That’s why Ryan didn’t pass the bill.

N

REPLY: The media will never expose reality. I believe the only way to fix all this mess is to repeal Obamcare in its entirety. Mandate that all insurance must go back to where it was. I know mine would drop by 50%. Then anyone who cannot get coverage goes to Medicaid. Obama just tried to convert healthcare to a TAX which is why the Supreme Court sustained it. It was a tax plain and simple. Any attempt to keep Obamacare and tinker with it will fail. It is 7 feet tall. Here is the original Social Security Act of 1935. (Social Security Act 1935)

Whenever a politician labels and act to pretend it is the greatest thing since sliced bread, you better look closer. The “Afforable Care Act” did not make health insurance affordable for anyone other than those who could not get it and belonged on government systems. The rest of us paid more, not less. Healthcare is a total mess and it has risen to such a high consumption level within the entire GDP, it reduces disposable income of the average household and that acts simply as an economic depressant.

We will simply have to  be pushed to the total point of collapse as healthcare keeps growing faster than anything else in the economy except government. U.S. health care spending grew 5.8% in 2015, reaching $3.2 trillion or $9,990 per person. The per capita income for the overall population in 2008 was $26,964. As a share of the nation’s Gross Domestic Product, health spending accounted for 17.8%. Healthcare is bankrupting the entire economy.

In FY 2017, total US government spending, federal, state, and local, is “guesstimated” to be $7.04 trillion. The annualy GDP is estimated at $18.855 trillion. Therefore the total cost of government is 37.3% of GDP. Adding healthcare, this means that non-productive forces have now reached 55.1% of the economy which produces NOTHING but simply consumes. When this crossed 60%, it appears we are in for the collapse of an empire in a true Byzantine manner.

OPEC, Non-OPEC Oil Producers Recommend Extending Production Cuts By Six Months


Tyler Durden's picture

Having failed to “rebalance” the oil market in the first six months following the implementation of the Vienna production cut agreement, with crude inventories in the US hitting all time highs in the interim…

… OPEC and non-OPEC oil producers found themselves in the unpleasant position of scrambling for solutions at this weekend’s Kuwait meeting – in which Saudi Arabia was conspicuously missing – where just two things were discussed: deal compliance, which OPEC paradoxically claims is more than satisfactory despite the relentless climb in inventories, and whether to extend the production cuts by another six month.

And as the Kuwait meeting in which OPEC and rival N-OPEC producing countries met to review progress with their pact to cut supplies drew to a close, a joint committee of ministers from OPEC and non-OPEC oil producers recommended extending by six months the global deal to reduce oil output by 1.8 million barrels, a draft press release from their meeting on Sunday showed.

ClearBridge Dividend Strategy Portfolios target total return, risk management and dividend potential. Discover the strength of Legg Mason – A Leader In Separately Managed Accounts.

The oil ministerial committee “expressed its satisfaction with the progress made toward full conformity with the voluntary production adjustments and encouraged all participating countries to press on toward 100 percent conformity,” said the draft, seen by Reuters.

The December accord, aimed at supporting the oil market, has lifted crude LCOc1 to more than $50 a barrel. But the price gain has encouraged U.S. shale oil producers, which are not part of the pact, to boost output.

In its statement, the committee said that “certain factors, such as low seasonal demand, refinery maintenance, and rising non-OPEC supply, have led to a further increase in crude oil stocks. At the same time, the liquidation of positions by financial players in the market was also observed.”  In other words, the committee blamed everything, including “evil selling speculators” except non-compliance with the deal, of course as that would crush what little credibility OPEC had.

Oil inventories are high because of low U.S. demand and higher supply, and the market should re-balance in the second half of the year, OPEC Secretary-General Mohammad Barkindo told reporters in Kuwait. Inventories in countries in the Organisation for Economic Co-operation and Development are currently 282 million barrels higher than their five-year average, he said at the meeting on Sunday.

It also left on a positive note: “However, the end of the refinery maintenance season and noticeable slowdown in U.S. stock build as well as the reduction in floating storage will support the positive efforts undertaken to achieve stability in the market,” it said.

“Oddly”, there was no mention of US shale production, which has soared in recent months, happy to grab market share from OPEC which has allegedly cut production by nearly 2 million barrels daily, and whose output continues to ramp higher in line with the resurgence in US oil rigs.

Before the meeting, Iraqi Oil Minister Jabar Ali al-Luaibi told reporters there were some encouraging elements that suggested the oil market was improving, and that if all OPEC members agreed measures to help price stability, Iraq would support such steps. “Any decisions taken unanimously by members of OPEC … Iraq will be part of the decision and will not be deviating from this,” Luaibi said quoted by Reuters.

Iraq’s oil production is running at 4.312 million bpd this month, Luaibi said, adding that his country had cut its oil exports by 187,000 bpd so far and would reach 210,000 bpd in a few days. Compliance with the supply-cut deal was 94 percent in February among OPEC and non-OPEC oil producers combined, Russian Energy Minister Alexander Novak said.

Russia is committed to cuts of 300,000 bpd by the end of April, Novak said, adding that a deal extension could be discussed on Sunday. “For today, obviously, this is within the sphere of our questions,” Novak said and added that he expects global oil stockpiles to decrease in the second quarter of this year. “The dynamics are positive here, I believe,” Novak said, adding that inventories in the United States and other industrialized countries had risen by less than in the past.

OPEC’s compliance rate was 106% in February, and non-OPEC nations, including Russia, have reached compliance of 64 percent, Kuwait’s Almarzooq said Sunday. The combined compliance rate of both was 94 percent, he said.

Kuwaiti Oil Minister Essam al-Marzouq said the oil market may return to balance by the third quarter of this year if producers comply fully with their production targets.

“More has to be done. We need to see conformity across the board. We assured ourselves and the world that we would reach our adjustment to 100 percent conformity,” Marzouq said.

The biggest question, however, how OPEC plans to deal with the rising shale threat, which as Goldman noted last week has become the global oil price setter, was unanswered.

This is how Goldman explained the dramatic change in the global oil cost curve over the past three years:

Shale’s short time to market and ongoing productivity improvements have provided an efficient answer to the industry’s decade-long search for incremental hydrocarbon resources in technically challenging, high cost areas and has kicked off a competition amongst oil producing countries to offer attractive enough contracts and tax terms to attract incremental capital. This is instigating a structural deflationary change in the oil cost curve, as shown in Exhibit 2. This shift has driven low cost OPEC producers to respond by focusing on market share, ramping up production where possible, using their own domestic resources or incentivizing higher activity from the international oil companies through more attractive contract structures and tax regimes. In the rest of the world, projects and countries have to compete for capital, trying to drive costs down to become competitive through deflation, FX and potentially lower tax rates.

The implications of this curve shift are major, all of which are very adverse to the Saudis, who have been relegated from the post of long-term price setter to inventory manager, and thus the loss of leverage. Here are some further thoughts from Goldman:

  • OPEC role: from price setter to inventory manager In the New Oil Order, we believe OPEC’s role has structurally changed from long-term price setter to inventory manager. In the past, large-scale developments required seven years+ from FID to peak production, giving OPEC long-term control over oil prices. US shale oil currently offers large-scale development opportunities with 6-9 months to peak production. This short-cycle opportunity has structurally changed the cost dynamics, eliminating the need for high cost frontier developments and instigating a competition for capital amongst oil producing countries that is lowering and flattening the cost curve through improved contract terms and taxes.
  • OPEC’s November decision had unintended consequences: OPEC’s decision to cut production was rational and fit into the inventory management role. Inventory builds led to an extreme contango in the Brent forward curve, with 2-year fwd Brent trading at a US$5.5/bl (11%) premium to spot. As OPEC countries sell spot, but US E&Ps sell 30%+ of their production forward, this was giving the E&Ps a competitive advantage. Within one month of the OPEC announcement, the contango declined to US$1.1/bl (2%), achieving the cartel’s purpose. However, the unintended consequence was to underwrite shale activity through the credit market.
  • Stability and credit fuel overconfidence and strong activity: A period of stability (1% Brent Coefficient of Variation ytd vs. 6% 3-year average) has allowed E&Ps to hedge (35% of 2017 oil production vs. 21% in November) and access the credit market, with high yield reopen after a 10- month closure (largest issuance in 4Q16 since 3Q14). Successful cost repositioning and abundant funding are boosting a short-cycle revival, with c.85% of oil companies under our coverage increasing capex in 2017.

Finally, with Saudi Arabia absent, the Kuwait meeting was largely moot. Khalid Al-Falih, the Saudi energy minister said in a Bloomberg Television interview on March 17 that the deal will be maintained if oil stockpiles are still above their five-year average.

In summary: It’s too early to decide on an extension of the output cuts, and OPEC will take up the issue in May, Barkindo said at Sunday’s meeting, during which ministers will monitor compliance with the targeted reductions.

* * *

For those curious, here is the full blast of Bloomberg overnight headlines covering the Kuwait meeting

KUWAIT OIL MINISTER OPEC COMPLIANCE IN FEB BETTER THAN JAN
KUWAIT: WE ARE ASKING COUNTRIES TO INCREASE COMPLIANCE
KUWAIT: WE SHOULD SEE MARKET REBALANCE END OF YEAR
KUWAIT: WE SHOULD SEE OIL STOCKS DRAWDOWN IN 3Q
KUWAIT OIL MINISTER: INDUSTRY NEEDS TO ADDRESS CHALLENGES
KUWAIT: SAUDI ARABIA, ANGOLA EXCEEDED COMMITMENTS TO CUT OUTPUT
KUWAIT: OIL MARKET WILL BE IN BALANCE IN 3Q IF COMPLIANCE 100%
KUWAIT: OIL COMMITEE REPORTS HIGH LEVEL OF CONFORMITY
KUWAIT: OPEC IS STUDYING EXTENSION OF CUTS DEAL FOR SIX MONTHS
KUWAIT MINISTER: OPEC, NON-OPEC COMPLIANCE WITH CUTS IS AT 94%
KUWAIT: COMMITTEE CALLS FOR OPEC TO MAKE RECOMMENDATION ON CUTS

RUSSIA’S ENERGY MINISTER: MINISTERS DISCUSS EXTENDING CUTS DEAL
RUSSIA’S NOVAK: OPEC/NON OPEC COMPLIANCE 94% AS OF END OF FEB
RUSSIA’S NOVAK: OPEC, NON-OPEC DISCUSS EXTENDING OIL-CUTS DEAL
RUSSIA: OPEC, NON-OPEC COOPERATING AT `VERY HIGH LEVEL’

IRAQ TO SUPPORT EXTENDING OIL CUTS IF OTHERS IN OPEC AGREE
IRAQ PRODUCED 4.312M B/D OF OIL IN MARCH: MINISTER
IRAQ’S MARCH OIL EXPORTS IN AGREED RANGE: MINISTER
IRAQ CUT OIL OUTPUT BY 187M B/D UNDER OPEC DEAL: LUAIBI
IRAQ TO CUT 210K B/D OF OIL OUTPUT IN FEW DAYS: LUAIBI

OPEC CHIEF SEES MARKET REBALANCE IN SECOND HALF OF 2017
OPEC: PRODUCERS REACHED HIGH LEVEL OF COMPLIANCE WITH CUTS
OPEC HOPES FOR HIGHER LEVEL OF COMPLIANCE WITH OUTPUT CUTS
OPEC CHIEF: TOO EARLY TO DECIDE ON EXTENSION OF OIL CUTS DEAL
OPEC CHIEF: OIL MARKET OPTIMISM IMPROVED ON OUTPUT CUTS
OPEC: OIL STOCKS ARE HIGH ON LOW U.S. DEMAND, RISING SUPPLY
OPEC: OIL STOCKS TO DECREASE IN SECOND HALF OF THIS YEAR

OMAN OIL MINISTER SAYS MAKES SENSE TO EXTEND OUTPUT CUTS 6 MOS
OMAN SUPPORTS OIL OUTPUT CUTS UNTIL END OF YEAR: MINISTER

VENEZUELA OIL MIN: WE ARE READY TO BACK EXTENDING OUPTUT CUTS

OPEC, NON-OPEC COMMITTEE SAID TO RECOMMEND OIL-CUTS EXTENSION
BARKINDO: OPEC TO DECIDE ON EXTENSION OF OIL CUTS DEAL IN MAY

The Media Has Always Been Biased?


Livermore

COMMENT: Marty; I managed to get a copy of your Greatest Bull Market in History at an auction. You do know they bring $3,000+ I presume? But what stunned me in there is that you wrote how the Wall Street Journal falsely accused Jesse Livermore of trying to influence the presidential election by saying the stock market was going to rally. When it did do what he said, the press refused to quote him again because they were wrong.

They will not quote you yet you have been the only one who has called this bull market from the very bottom. It looks like mainstream media is doing to you what they did to Livermore. History does repeat.

REPLY: You may be right. But that is a good thing. It is better to keep the info in real hands rather than just plastered around for hype. Exclusive is better. The majority would never listen anyway.

The Financial Crisis 1992-1993


Major John

QUESTION: Marty, it is well known here in Britain that you advised Thatcher of course, but it was John Major you advised and even wrote what he said during the pound crisis and the Soros attack. Would you ever like to comment on that in public about what really happened during that crisis. The press will never report anything you say. There are those of us who would like to hear from the source.

Thank you for what you do.

PJ

British Pound Sept 1992 Soros

ANSWER: For those who do not know, Sir John Major was the Prime Minister of Britain 1990-1997. One of the biggest BS stories is how they blame or credit such events to one person. Each of these market “manipulations” or attacks, are typically characterized with one member of “the Club” taking the front position. In this case it was George Soros. He was given the personal face of that event that broke the pound. It was by no means just Soros. He did not get that trade correct out of thin air. Everyone in the trading community saw it coming. It was similar to the Greek crisis in 2010. Once one member is in trouble, traders look around ans see who is next.

PlazaAccord-1

The 1992/1993 collapse of the European Exchange Rate Mechanism (ERM) was a system introduced by the European Economic Community on March 13th, 1979, to which Thatcher was against. It was part of the European Monetary System (EMS), intended to reduce exchange rate variability and achieve monetary stability in Europe in the aftermath of the collapse of Bretton Woods in 1971. Only after the Plaza Accord in 1985, did the EMS prepare for Economic and Monetary Union of Europe which gave birth to the introduction of a single currency, the euro, which took place on January 1st, 1999. The collapse of Bretton Woods, the ERM, and the coming Euro all have the same flawed understanding of economics. Governments think they can by law or regulation nullify their own failures. All three systems could never survive under the socialistic/military establishment for the politicians do whatever they want to sustain power, not to manage the economy in any meaningful manner.

china-100-yuan

Clearly, the tension within the ERM began to build up from mid-July 1992, concentrating initially on the Italian lira, then on sterling and then on a variety of other currencies. However, what was also overlooked was the fact that July 1992 was also when the Russian Ruble began trading for the first time. Meanwhile, the Bank of China required foreign visitors to China to conduct transactions with Foreign Exchange Certificates that were issued by the Bank of China between 1979 and 1994. Effectively, this was a two-tier monetary system – domestic v international. Following the ERM Crisis, this two-tier system in China was abolished, and all transactions then took place in Renminbi. The entire global foreign exchange system was changing. The biggest mistake people make looking at the British pound crisis of 1992, has been to look at it through a myopic perspective of isolation.

The pressure on the Finnish Markka was so strong at that time it was forced to abandon its peg with the ECU. Italy raised its interest rates to try to support its currency, but still the lira weakened repeatedly. The Bundesbank did not cut its interest rates enough fearing inflation and speculation would continue, which put pressures on other states. It was on September 13th, 1992 when the Italian decision to devalue Italian Lira by 7% took place (other currencies revalue of 3.5%: Lira devalues 3.5%). The pressures on lira led traders to look around and saw that the British pound was also overvalued all relative to Germany.

Hence, the pound sterling became the next target just as did Portugal after Greece in 2010.  It was Black Wednesday, September 16th, 1992, when the British Conservative government of John Major was forced to withdraw the pound sterling from the European Exchange Rate Mechanism (ERM) after it was unable to keep the pound above its agreed lower limit in the ERM. Yes, I was being called during this crisis. The first call from Britain asked me what our model was forecasting. I warned that the pound had to be devalued and that the ERM was collapsing exactly as did Bretton Woods. I was told John Major could not devalue the pound for that was his campaign promise. I thought about the crisis and called back. I wrote down the words to say that he would allow the pound to float and seek its own level. This was slightly different from a devaluation which would have still been a fixed exchange rate peg. Allowing the pound to float would let the market make the decision, rather than the politicians. Therefore, Major did not violate his promise and did not officially devalue the pound – he let it float to seek its own level.

The day after the British crisis ended with effectively withdrawing from ERM, it in turn flipped the pressure back upon Italy. Thus, the following day, the 17th of September 1992, Italy also withdrew from ERM. Once again, attempts to politically fix currencies produced a total and utter failure as was the case with Bretton Woods and of course the more recent Swiss Peg collapse. We will see the same end result with the Euro.

Deutsche Mark Sept 1992-MThe Deutsche mark was sent to significant highs even against the dollar in September 1992. The foreign exchange markets remained disturbed for the rest of that year, with a renewed outbreak of speculative pressures leading to the abandonment of Sweden’s peg to the ECU, devaluation of both the Portuguese escudo and the Spanish peseta came in November 1992 and the abandonment of Norway’s ECU-peg in December 1992. By January 1993, Ireland witnessed economic pressure due to the sterling devaluation by the UK, and this then compelled Ireland to devalue by 10%. Germany finally reduced its interest rates in February, March and April of 1993, trying to ease the economic pressure within the currencies that had not yet been realigned. The entire crisis of 1992-1994 was a prelude to the ultimate crisis that would hit the euro for similar reasons and Germany’s fear of inflation that would impose austerity on the rest of Europe. It was Germany’s high interest rates in 1992/1993 that broke the back of the ERM.

Indeed, then France presented a problem for the politicians that made clear of their commitment to the ‘franc fort’ policy, that was keeping the franc at its existing parity. France also wanted lower interest rates to relieve the recession, and it appeared willing to challenge the German economic authorities publicly, who were concerned about inflation, so they kept interest rates high out of austerity. On June 18th, the French money market intervention rate was pushed below the German rates. This was received with skepticism in the markets. Consequently, speculative pressures within the ERM continued to build. This time, those pressures turned against the French franc during July 1993. The Banque de France was forced to raise its interest rate to prevent the franc from falling through its ERM lower band. However, the Bundesbank did not lower its discount rate, and massive sales of the French franc, Belgian franc, Danish krone, Spanish peseta and Portuguese escudo took place in response. Once again, Germany’s obsession with the Hyperinflation of the 1920s dictates their response. Today, we have seen the price of German austerity upon the entire economic condition of Europe. While the ERM broke, today there is a full federalized government in Brussels attempting to maintain austerity and the same philosophies that broke the ERM during the 1992/1993 Crisis.

At this point in time, the ERM was in total crisis within Europe. One would think they learned from Bretton Woods, but politicians are blinded by their self-interest, which always comes before that of the people or country. Massive intervention was necessary to keep these currencies just above their ERM floor. On the 2nd of August 1993, the EC monetary officials and finance ministers finally agreed that the ERM bands should be widened from 2.25% to 15% (except for the Dutch-German one). With the wider bands, the system would be less vulnerable to speculation.

At the core of all of this was German’s complete misunderstanding of the Hyperinflation and their attempt to impose austerity upon all of Europe, which is deflationary and anti-economic growth.

Thailand Share-Y 3-22-2017

The ERM Crisis of 1992/1993, made George Soros famous, yes, but it awakened international hedge fund traders to the currencies markets. Traders then turned to the peripheral markets – Russia next and then South East Asia, which saw its share market peak in January 1994 and bottom in September 1998 (56 months).

Russia Ruble-Y 3-22-2017
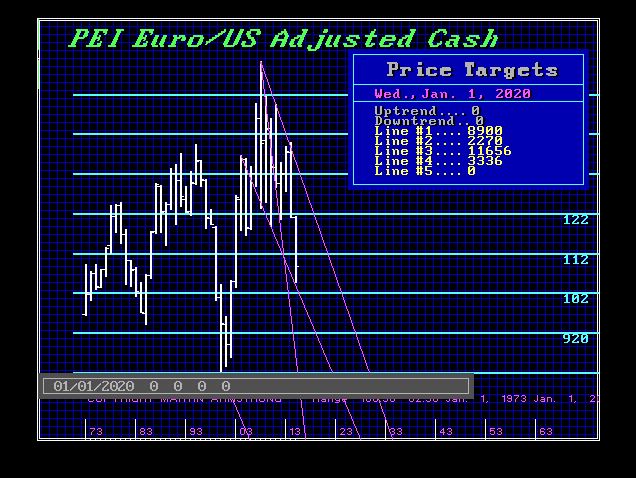
It was on October 11th, 1994, when the ruble tumbled in the Moscow interbank market by over 20% against the U.S. dollar. “Black Tuesday” became the first currency crisis in post-communist Russia also caused by politicians. From July 1992, when the ruble first could be legally exchanged for United States dollars, to October 1995, the rate of exchange between the ruble and the dollar declined from 144 rubles per US$1 to around 5,000 per US$1. It was the float of the Ruble in July 1992 that started the shift in global capital flows and currency markets. Politicians, for pride, artificially set the Ruble’s value too high against the dollar reflecting past glories, which was the exact same mistake of the British entering the ERM. Rapid changes in the nominal rate of the Russian economy reflected the overall macroeconomic instability. After the ERM crisis, traders then turned to emerging markets targeting Russia. This was the Black Tuesday with a 27% collapse in the ruble’s value against the dollar. Eventually, in July 1995, the Russian Central Bank announced its intention to maintain the ruble within a band of 4,300 to 4,900 per US$1 through October 1995. They later extended the period to June 1996. They attempted a “crawling band” exchange rate which they introduced to allow the ruble to depreciate gradually through the end of 1996, This led to a further collapse from 5,000 to 6,100.

ft-1998After the Russian introduction of the “crawling band”, traders turned their attention to the emerging market in Southeast Asia with more concerted force. This eventually manifested in the 1997 Asian Currency Crisis. Then traders turned back to Russia. I have stated many times how I was invited to the IMF dinner put on by Edmond Safra in Washington. I was being pitched then to join “the Club” and buy into Russia for they had the IMF in their pocket. The IMF would continue to guarantee Russian debt so you could buy debt and earn 5 times the amount of interest otherwise. The IMF would eliminate the risk. I said “No way, my computer warned Russia would collapse.”

Ruble 1998 - DOf course, this eventually led to the collapse in 1998, which in turn set in motion the Lehman and Bear Stearns collapse thanks to Long Term Capital Management collapse who lost on the Russian bond market.

It was all set in motion by politicians trying to fix currencies that they cannot fix.

European North v South


european_union_3d_map_1600_clr_17749

Dijsselbloem’s comments regarding the Southern Europe reflect the political bias – not the general public at large within Europe. There are different cultures throughout Europe. In some places people will not cross the street until a light changes even if there are no cars. Other parts are like New York, lights are optional. There are many cultural differences in general between north and south, but even more between members. Even in Germany there is a divide between north and south.

The blame does NOT lie in cultural differences, corruption, or even easier spending in the south and excessive pensions as in Greece. The problem that has pushed Europe to the brink is:

(1) this failed idea that ending European War can be achieved by federalizing Europe. That will not change the cultural differences. Even in the United States, there are cultural differences between the Bible Belt (anti-Abortion & anti-Gay Marriage) compared to California or New York. It is the Federalization of the United States and the attempt to impose one culture upon the whole ever since the Great Depression that is causing tensions within the United States. The same is TRUE within Europe.

IBEUUS-Y TEK TO 2020 1-22-2016

(2) The structural blame lies with Brussels. The failure to have consolidated all the debts of the members and make that the federal debt created two major errors. First, it meant the Euro would never be able to complete with the dollar for there was no single unified debt and investors would still have to make decisions based upon individual member state credit rating. That defeated the entire purpose of creating a euro and federalization. Secondly, leaving all individual member states with past debt yet converted that to euro, then resulted in their debts doubling in international value as the euro doubled going into 2008.

As I have stated numerous times, the commission designing the Euro attended our WEC in London back in 1998. I warned that the debt MUST BE CONSOLIDATED from all member states. That would have then formed a federal bond market to compete with the dollar. I then advised that thereafter, all new debt would by individual state debt simply issued in euro. That was the successful structure of the United States. I explained in detail why this worked and why it was the ONLY possible way to process or the euro would begin to collapse in 2016 (following 2015.75) on schedule (17.2 years (2 x 8.6) and the risk of its total collapse by 2019 (20 years from 1999).

The fault does NOT lie with the people of Europe – but with the politicians who have zero skill in understanding an economy no less managing one and then they rely upon academics who have never had a real job in the field. You cannot understand how capital flows around the world and why without real world observation. That would be like me trying to manage a hospital with no medical experience and telling someone how a brain surgery should be done simply because I read a book. You cannot learn everything from a book.

I maybe one of the few people to speak out, but that is because those with experience working in the industry must sign confidentiality agreements and cannot speak out for anything they say will be attributed to their employer. To actually design a system that works, one must consult not academics or analysts who have never worked in the industry, but traders on FX desks who see this first hand.