Carbon Dioxide CO2 is not making “ANY” dangerous changes to the global temperature!
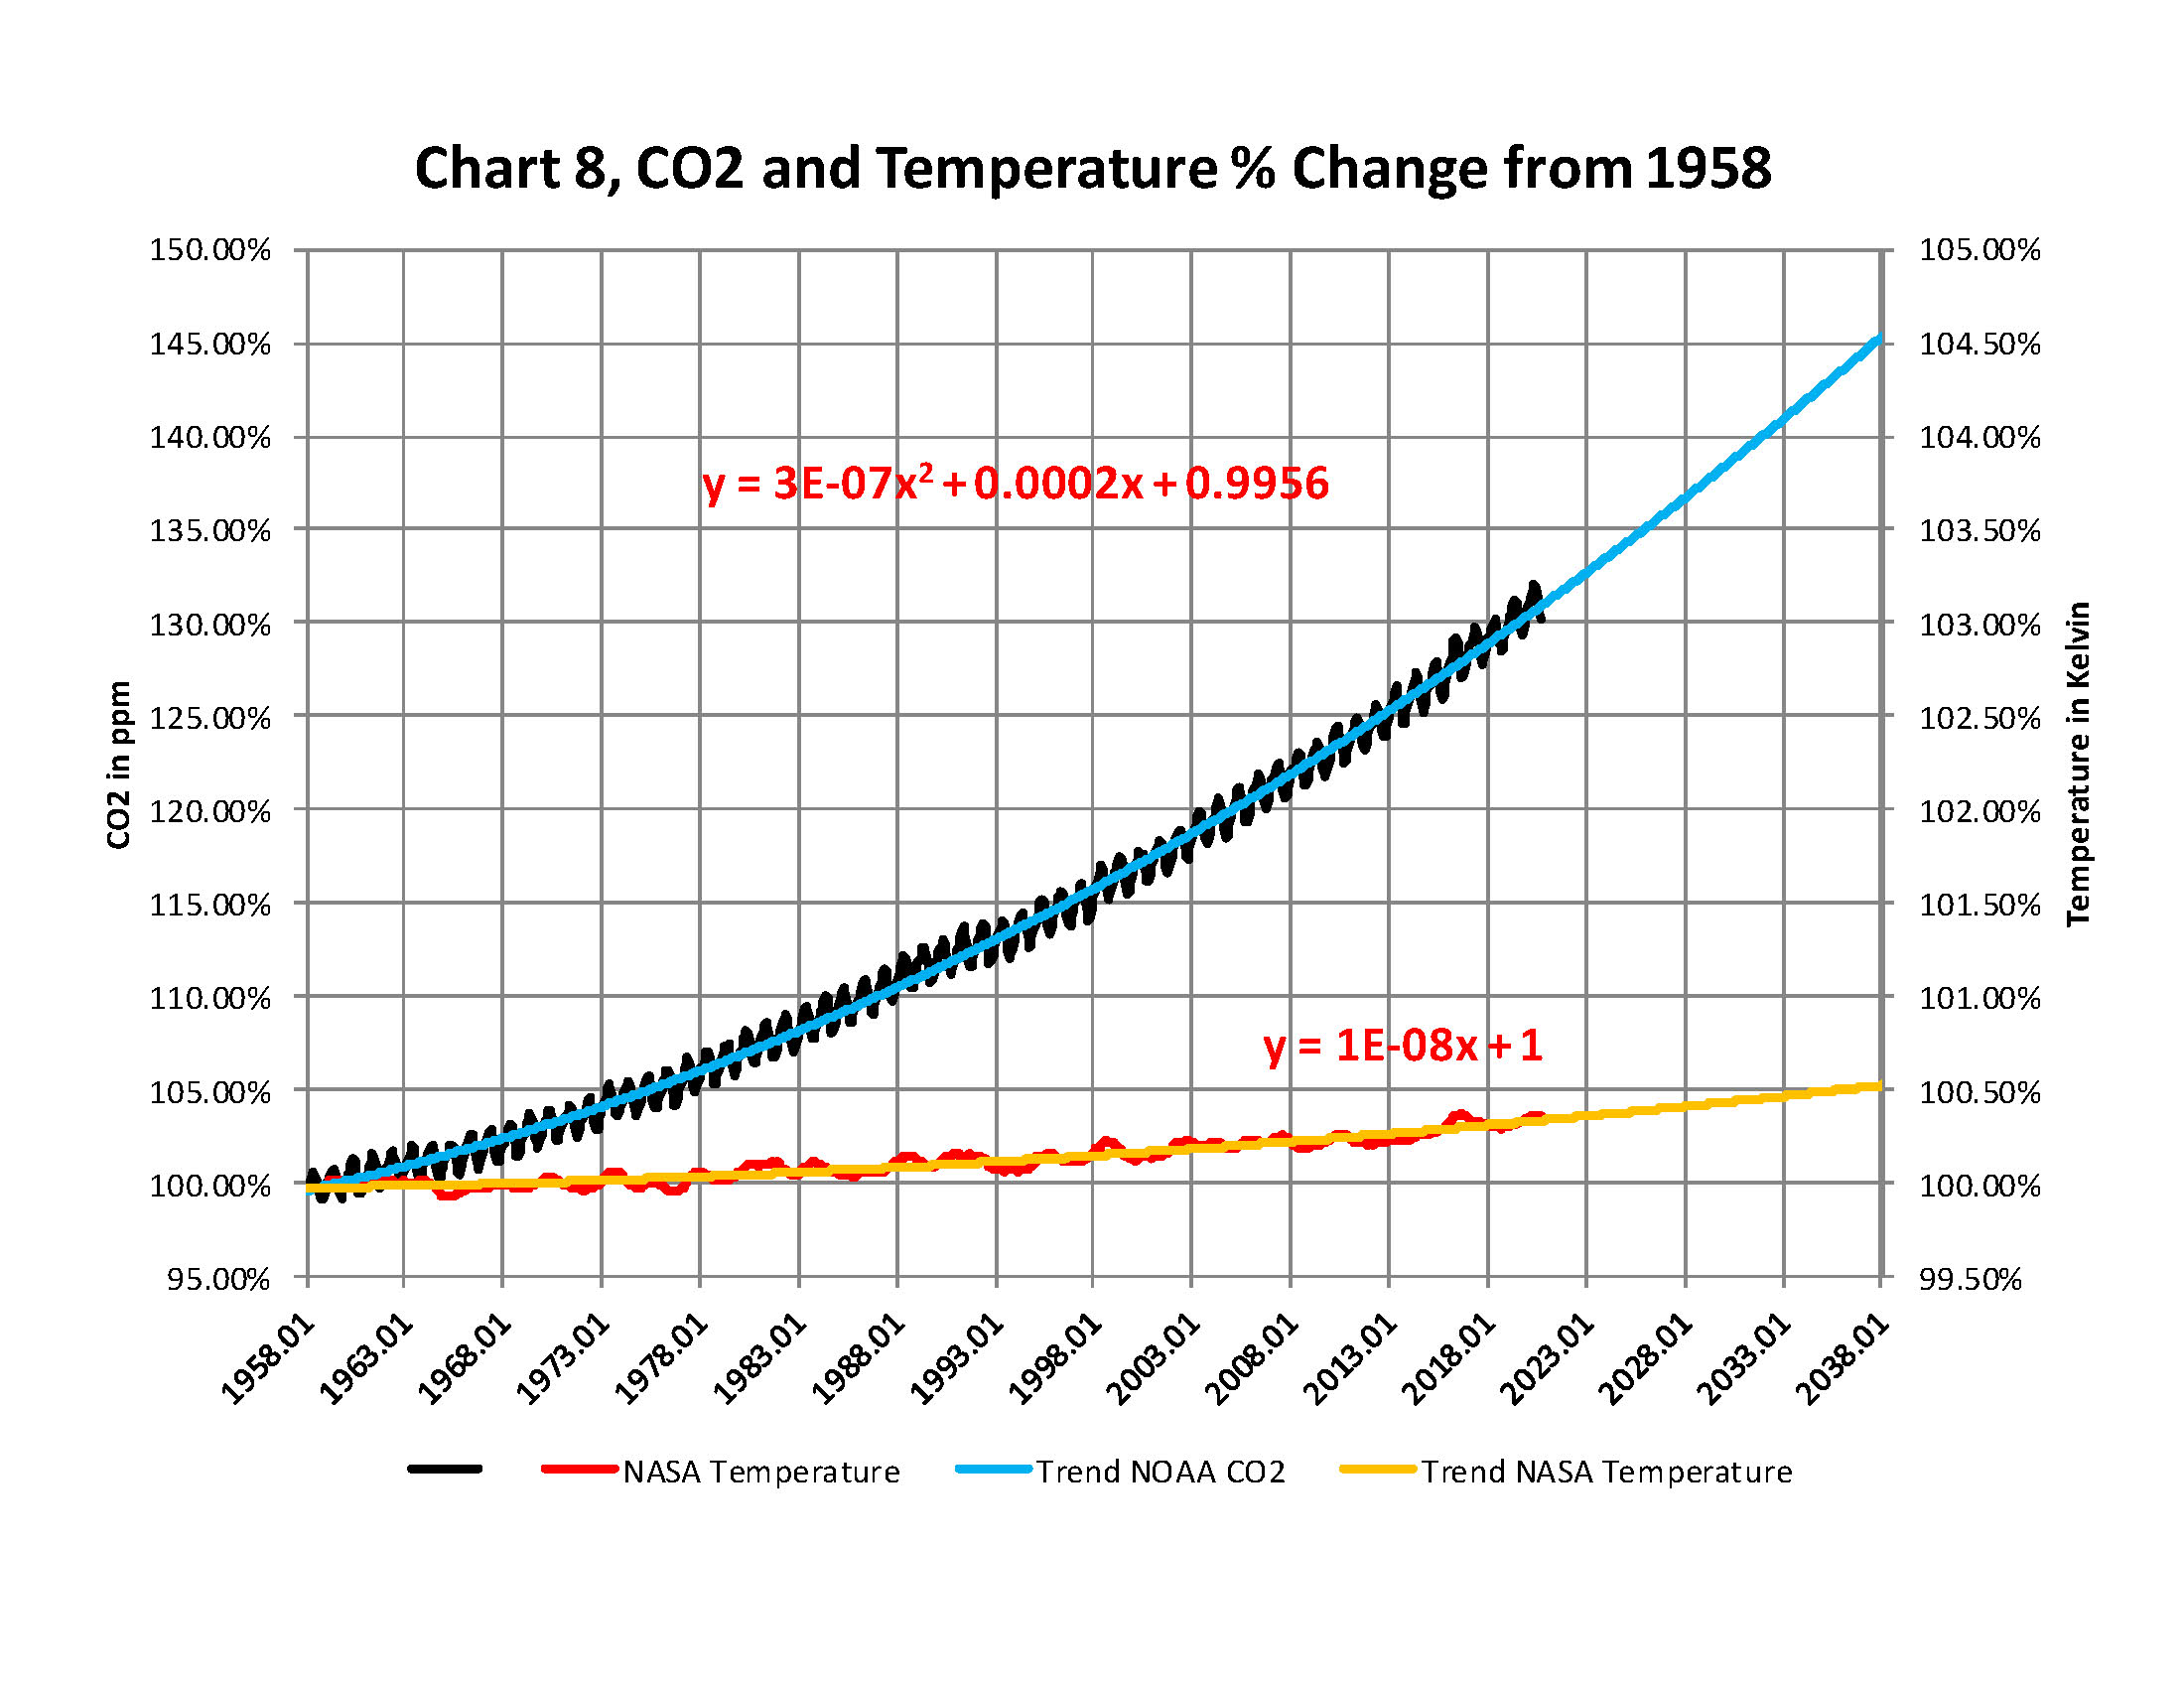
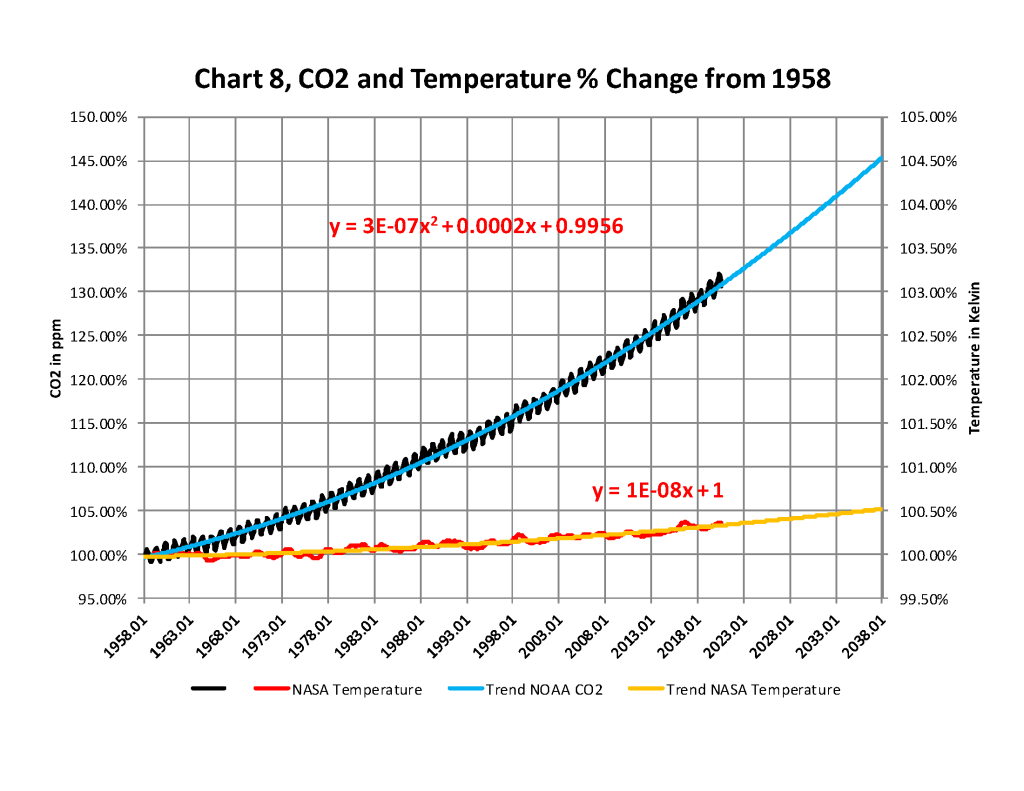
From the attached report on climate change for November 2020Data we have the two charts showing how much the global temperature has actually gone up since we started to measure CO2 in the atmosphere? To show this graphically Chart 8 was constructed by plotting CO2 as a percent increase from when it was first measured in 1958, the Black plot, the scale is on the left and it shows CO2 going up a bit over 31.0% from 1958 to October of 2020. That is a very large change as anyone would have to agree. Now how about temperature, well when we look at the percentage change in temperature from 1958, using Kelvin (which does measure the change in heat), we find that the changes in global temperature (heat) are almost un-measurable. The scale on the right side had to be expanded 10 times (the range is 40 % on the left and 4% on the right) to be able to see the plot in the same chart in any detail. The red plot, starting in 1958, shows that the thermal energy in the earth’s atmosphere increased by .40%; while CO2 has increased by 31.0% which is 78 times that of the increase in temperature. So is there really a meaningful link between them that would give as a major problem? The numbers tell us no there isn’t.
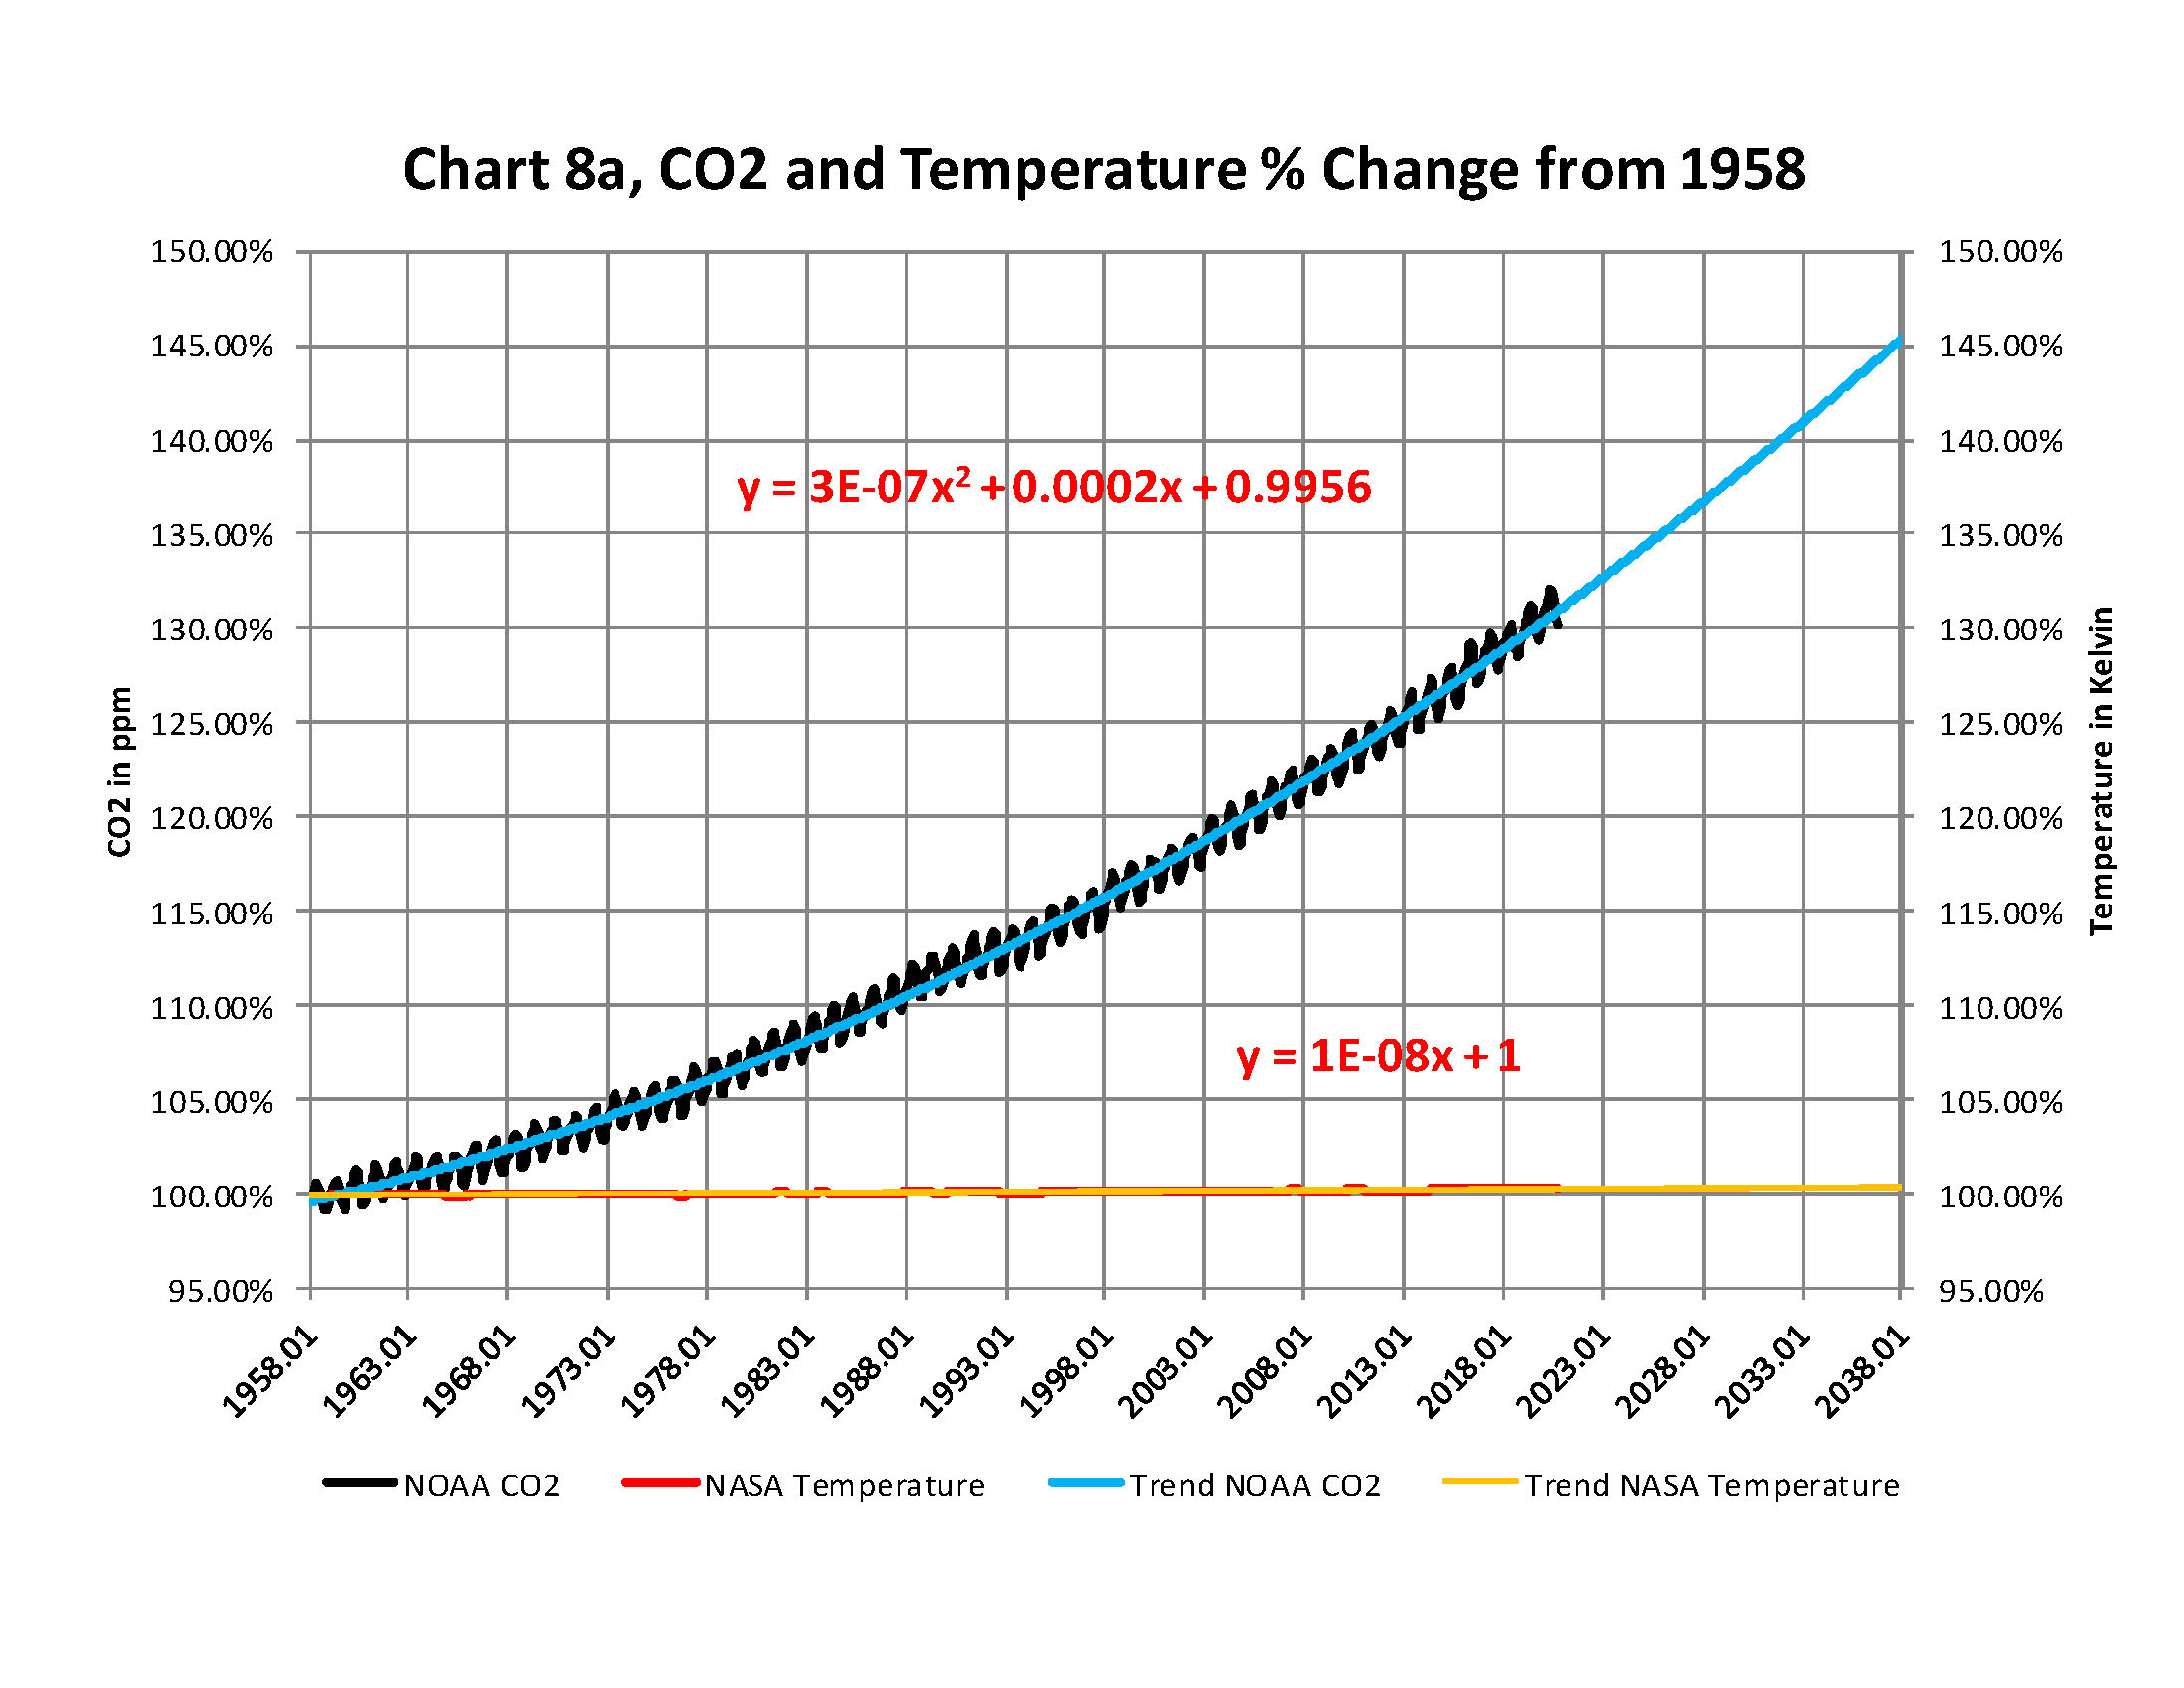
The next chart is Chart 8a which is the same as Chart 8 except for the scales which are the same for both CO2 and Temperature. As you see the increase in energy, heat, is not visually observably in this chart hence the need for the previous chart 8 to show the minuscule increase in thermal energy shown by NASA in relationship to the change in CO2. Based to these trends, determined by excel not me, in 2028 CO2 will be 428 ppm and temperatures will be 15.0o Celsius and in 2038 CO2 will be 458 ppm and temperatures will be 15.6O Celsius. This is what the data shows no matter what the reasons are, so I have no idea how the IPCC gets to predict that the world will end in ten or even twenty years.
The full 40 page report explains how these charts were developed and why using NASA and NOAA data that are used without change to prove that The New Green Deal is not required and any attempt to complete that plan will be a worldwide disaster.
Carbon Dioxide CO2 is not making “ANY” dangerous changes to the global temperature!
From the attached report on climate change for October 2020Data we have the two charts showing how much the global temperature has actually gone up since we started to measure CO2 in the atmosphere? To show this graphically Chart 8 was constructed by plotting CO2 as a percent increase from when it was first measured in 1958, the Black plot, the scale is on the left and it shows CO2 going up a bit over 31.0% from 1958 to October of 2020. That is a very large change as anyone would have to agree. Now how about temperature, well when we look at the percentage change in temperature from 1958, using Kelvin (which does measure the change in heat), we find that the changes in global temperature (heat) are almost un-measurable. The scale on the right side had to be expanded 10 times (the range is 40 % on the left and 4% on the right) to be able to see the plot in the same chart in any detail. The red plot, starting in 1958, shows that the thermal energy in the earth’s atmosphere increased by .40%; while CO2 has increased by 31.0% which is 78 times that of the increase in temperature. So is there really a meaningful link between them that would give as a major problem? The numbers tell us no there isn’t.
The next chart is Chart 8a which is the same as Chart 8 except for the scales which are the same for both CO2 and Temperature. As you see the increase in energy, heat, is not visually observably in this chart hence the need for the previous chart 8 to show the minuscule increase in thermal energy shown by NASA in relationship to the change in CO2. Based to these trends, determined by excel not me, in 2028 CO2 will be 428 ppm and temperatures will be 15.0o Celsius and in 2038 CO2 will be 458 ppm and temperatures will be 15.6O Celsius. This is what the data shows no matter what the reasons are, so I have no idea how the IPCC gets to predict that the world will end in ten or even twenty years.
The full 40 page report explains how these charts were developed and why using NASA and NOAA data that are used without change to prove that The New Green Deal is not required and any attempt to complete that plan will be a worldwide disaster.
Click on the link below for the full report that you can download.
First, San Francisco just banned Natural Gas in any new buildings, requiring them to rely on the electric grid instead. The city’s board of supervisors unanimously approved the ordinance which will apply to more than 54,000 homes and 32 million square feet of business space that was approved for construction. They do not have the power generation to support that and a power grid failure means even the food people have will go bad without electricity and they cannot even cook on a stove or microwave. What do you do if power is out for weeks?
Secondly, San Franciso passed the CEO tax. The tax applies to companies in which the highest-paid managerial employee earns 100 times more than the median worker in San Francisco. Businesses above this 100 to 1 threshold pay an extra surcharge on their gross receipts. The greater the inequality, the bigger the tax. Companies with an executive earning 200 times the median worker in the city incur a 0.2% tax, all the way up to 0.6%. For large firms (businesses with more than $1 billion in gross receipts and 1,000 employees nationwide), the tax is applied to up to 2.4% of its city payroll expenses. The bill is expected to bring in between $60 million and $140 million per year, about 0.4% to 1% of the city’s annual budget.
This tax is really problematic. It is a tax on the company rather than the executive. But generally, these large pay-outs are stock options – not cash. So if the stock doubles in price, the CEO would make a theoretical windfall and the company would pay a surcharge which could impact the shareholders and could even reduce the workforce.
QUESTION: Do you think the entire climate change is caused by the sun?
KS
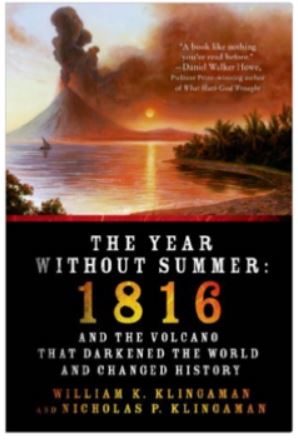
ANSWER: No. Nothing can be reduced to a single cause and effect. There is a 300-year cycle in the energy output of the sun. But solar minimum changes the output to greater intensity of gamma rays. This may be responsible for the increase in volcanic activity during solar minimum. What is clear is that it has been the volcanic activity that has caused the major declines in temperature, which have resulted in famines and drastic weather changes such as the year without a summer.
This certainly cannot be contributed to simply CO2 any more than it can be simply reduced to the sun only. There is far more complexity involved, which we really need to explore. This agenda to crush the economy and rebuilt it green is not supported by the evidence.
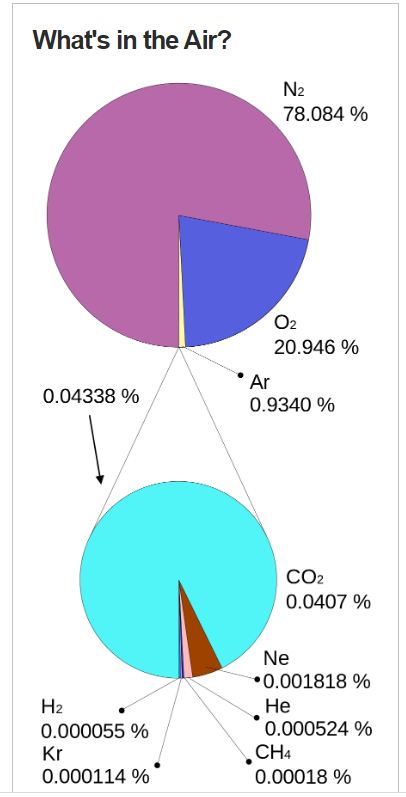
I find it fascinating how a 19-year-old can do the research that climate change is natural and that whatever impact humans have is negligible. All we have to do is go to the NASA site and look at the current composition of the atmosphere. CO2 is about 0.04%. I just do not see how we need to change the world to save the planet, but like the virus, this too seems to be a sham. It is the third attempt to impose Marxism on the entire world.
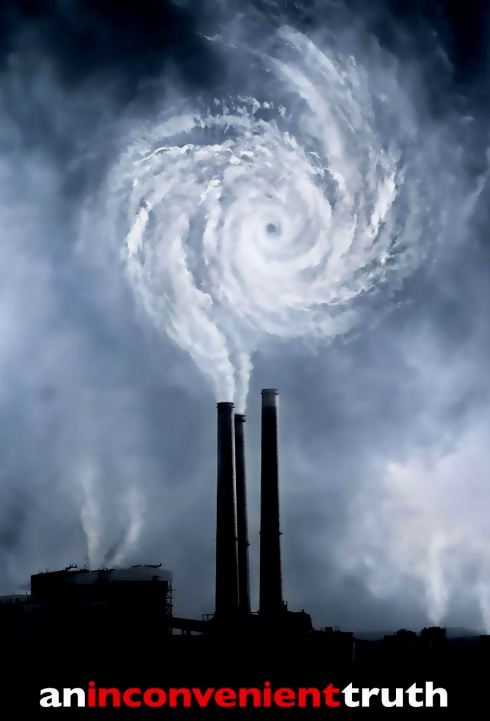
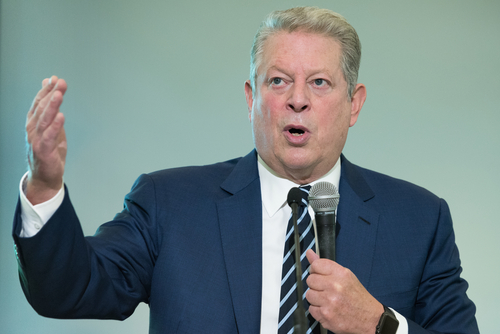
COMMENT: Just an observation after reading the blog on how scientific illiterate Al Gore is. I actually had to LOL when I noticed that on the cover of his book “An Inconvenient Truth” the hurricane image arising from the smokestack was backwards and obviously none of his genius scientific advisors knew enough to notice. A hurricane is an intense low pressure system and spins counterclockwise, they depict it spinning clockwise!
EJW
REPLY: You are correct. Gore was bad at math and science in school. I suppose he slept through the class that explained typhoons orhurricanes move differently in different parts of the world. They will always spin counterclockwise in the Northern Hemisphere, and spin in the opposite direction in the Southern Hemisphere. No wonder the judge ruled it was just opinion and not science.Categories:Climate
Carbon Dioxide CO2 is not making “ANY” dangerous changes to the global temperature!
From the attached report on climate change for September 2020Data we have the two charts showing how much the global temperature has actually gone up since we started to measure CO2 in the atmosphere? To show this graphically Chart 8 was constructed by plotting CO2 as a percent increase from when it was first measured in 1958, the Black plot, the scale is on the left and it shows CO2 going up a bit over 31.0% from 1958 to April of 2020. That is a very large change as anyone would have to agree. Now how about temperature, well when we look at the percentage change in temperature from 1958, using Kelvin (which does measure the change in heat), we find that the changes in global temperature (heat) are almost un-measurable. The scale on the right side had to be expanded 10 times (the range is 40 % on the left and 4% on the right) to be able to see the plot in the same chart in any detail. The red plot, starting in 1958, shows that the thermal energy in the earth’s atmosphere increased by .40%; while CO2 has increased by 31.0% which is 78 times that of the increase in temperature. So is there really a meaningful link between them that would give as a major problem? The numbers tell us no there isn’t.
The next chart is Chart 8a which is the same as Chart 8 except for the scales which are the same for both CO2 and Temperature. As you see the increase in energy, heat, is not visually observably in this chart hence the need for the previous chart 8 to show the minuscule increase in thermal energy shown by NASA in relationship to the change in CO2. Based to these trends, determined by excel not me, in 2028 CO2 will be 428 ppm and temperatures will be 15.0o Celsius and in 2038 CO2 will be 458 ppm and temperatures will be 15.6O Celsius. This is what the data shows no matter what the reasons are, so I have no idea how the IPCC gets to predict that the world will end in ten or even twenty years.
The full 40 page report explains how these charts were developed and why using NASA and NOAA data that are used without change to prove that The New Green Deal is not required and any attempt to complete that plan will be a worldwide disaster.
Click on the link below for the full report that you can download.
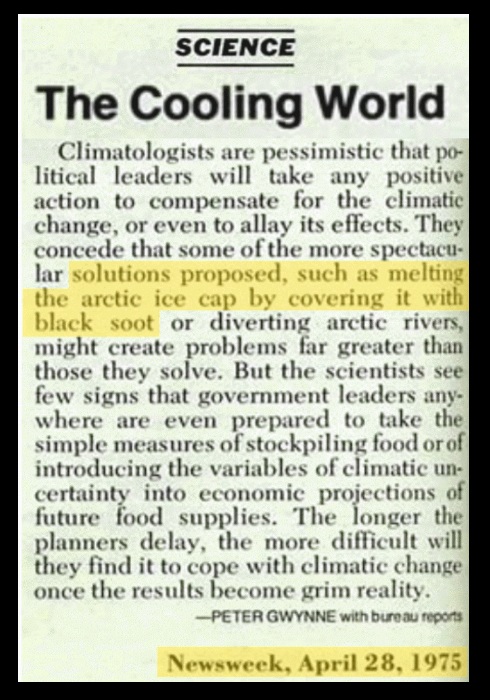
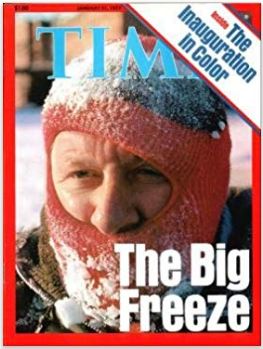
In the April 28, 1975 edition of Newsweek, they actually proposed solutions for climate change that included outlawing internal combustion engines. The interesting aspect was the fear at that time was about global cooling — not global warming. The 70s were dominated by the fear that we were facing manmade global cooling, not warming. TIME magazine’s January 31, 1977 cover featured a story, “How to Survive The Coming Ice Age.” It included “facts” such as scientists predicting that Earth’s so-called average temperature could drop by 20 degrees Fahrenheit due to manmade global cooling. Dr. Murray Mitchell of the National Oceanic and Atmospheric Administration warned readers that “the drop in temperature between 1945 and 1968 had taken us one-sixth of the way to the next Ice Age temperature.”
Global cooling was the big scare as it gained considerable support among me-too scientists as we once again see today with global warming. However, suddenly as everything is cyclical, instead of cooling as long predicted by manmade climate change advocates, the planet began to warm again. OMG! We were wrong! Something had to be done to rescue the climate change agenda from total disaster and scientists who proved they were not so scientific.
This is when Al Gore came to the rescue. Just like the poles flip on the sun every 11 years, Al Gore flipped the argument from manmade cooling to manmade warming to save the end goal — eliminating all fossil fuels regardless of the evidence. Who needs science when you can just make up the studies and cherry-pick the facts to support whatever you want.
Al Gore Sr. was a very influential and powerful Senator from Tennessee. Even Wikipedia said that Gore was “an avid reader who fell in love with scientific and mathematical theories, but he did not do well in science classes and avoided taking math.” Nevertheless, his father made sure that his son was elected to the House of Representatives, serving from 1977 to 1985, and then going on to the Senate from 1985 to 1993.
Gore’s primary issue became his obsession that the Earth would perish if we did not eliminate fossil fuels. When he advanced to Vice President under President Bill Clinton, Gore was at last able to enact policies and direct funding to ensure that the climate change agenda became a top priority of the United States Government. Gore had the authority now to create the President’s Council on Sustainable Development. Gore immediately changed the Council’s Charter on April 25, 1997, amending the “Scope of Activities” to include advise the President “on domestic implementation of policy options to reduce greenhouse gas emissions.”
It was Al Gore who steered the Council to identify and encourage the reduction in greenhouse gas emissions across diverse sectors and levels of society. This is the man who has convinced others using science he did not understand and avoided in school, yet he is prepared to push his ideas that are no different than some new religion and force everyone to accept his beliefs or go to prison for even refusing to wear a mask. He joined with Greenpeace, which was engaged in violence to push their agenda, and became a board member of the World Economic Forum to steer that organization against all opposition and to support the fall of democracy because we should not have a vote in how our future is to unfold. He disagrees with the American Constitution that we are entitled to freedom of speech, assembly, and the pursuit of our own happiness. Like all leftists, Al Gore will not tolerate dissent. It is always their way or no way which is why Marxism has killed more than all the wars of religion combined.
The Council was charged originally to advise the President “on matters involving sustainable development.” Gore rejected any alternative points of view on the science of climate change. He deliberately excluded all opposition is the tradition of a true leftist. He had made the conclusion that the Clinton administration would go in the direction of global warming reversing the very same argument from the 70s that fossil fuels were causing global cooling. In the cover letter to the President that was accompanying the 1999 report, Advancing Prosperity, Opportunity and a Healthy Environment for the 21st Century, Gore made sure that the Council concluded: “Our report presents consensus recommendations on how America can reduce greenhouse gas emissions and take other steps to protect the climate.” This was AFTER he blocked all opposition.
The world had to change and anyone who disagreed with Gore had to be rejected and criticized as fake science. This became Gore’s strategy to take over the world and force the abandonment of fossil fuels. He directed all the agencies which included the Department of Energy, Environmental Protection Agency, National Science Foundation, Department of Education, National Oceanic and Atmospheric Administration, and National Aeronautics and Space Administration, to adopt his agenda.
When physicist Dr. William Happer, then Director of Energy Research at the Department of Energy, testified before Congress in 1993 that scientific data did not support the hypothesis of manmade global warming, Gore went nuts. Gore immediately had Happer fired. It was 15 years later when Happer commented: “I had the privilege of being fired by Al Gore since I refused to go along with his alarmism. I did not need the job that badly.” Greenpeace then later tried to slander him saying he was being funded by the energy industry. They always twist the facts and then try to claim if someone is approached for their ideas and asked to do a study it somehow discredits their original conclusions.
Al Gore used his theory to gather a personal fortune that has exceeded $300 million. Gore’s movie, “An Inconvenient Truth,” put forth nothing but propaganda. It was challenged in the courts in London when they were trying to force students to watch it. The court found that Gore’s documentary contains nine key scientific errors. The judge declined to ban the Academy Award-winning film from British schools but ruled that it can ONLY be shown with guidance notes to prevent political indoctrination (see Telegraph 10/11/2007)
Hurricane Delta posed a particularly dangerous threat to Louisiana as much of the exact same area was previously hit by Hurricane Laura just six weeks ago. With massive amounts of debris from Laura still in the cleanup process Hurricane Delta was poised to deliver a troubling double-whammy. However, that said, first responders and state officials are saying there were no fatalities from Delta – Prayers Answered.
[Via ABC] Hurricane Delta, now a tropical depression, made landfall near Creole, Louisiana, on Friday evening, with nearly 11 million people in the storm’s path. More than 600,000 power outages were reported across Texas, Louisiana and Mississippi early Saturday afternoon as the storm’s remnants moved further inland.
Delta is now expected to move across western and northern Mississippi before heading into the Tennessee Valley tonight and Sunday. (more)
Material stuff can be replaced, people cannot. Now the incredible heroes from across the United States will move in to begin restoring power. Massive numbers of power crews are working to rebuild the grid; tens of thousands of tons of debris being removed. [Much of what is now called “debris” represents the cherished belongings of thousands of lives.]
Now it’s time to try and restore some sense of normalcy for those who have been impacted, and commit to a long-term rebuilding process. Stay strong. Thousands have staged. Help is on the way…
“It was quite a night,” Lake Charles resident Don Dixon said as he cleaned up branches and assessed his home in the Louisiana city. Dixon worried as the rain poured and the wind howled, but the damage was not as bad as he had feared.
“All in all, we got punched in the face, but we’re getting back up,” Dixon said.
Anther resident, Caleb Cormier, drove around all morning, and said most of the damage he’d seen was debris on the roads and one downed electrical line.
“It really is nowhere near the amount of damage that Hurricane Laura did, and I’m very grateful for that,” Cormier said as he cleared up tree branches and garbage from the street so it wouldn’t be a hazard for passing cars.
Still, damage reached far inland, with trees shorn of leaves and falling onto streets in Louisiana’s capital of Baton Rouge. Widespread power outages were also reported. LINK
A glorious melding of dirty fingernails all arriving for the recovery meet-up. Depending on your proximity to the bigger picture objectives at hand, you will cherish their arrival.
Recovery teams will begin a street-by-street review; everything needs to be evaluated prior to thinking about beginning to rebuild a grid. Your patience within this process is needed; heck, it ain’t like you’ve got a choice in the matter…. so just stay positive.
Meanwhile, you might walk outside and find yourself a stranger in your neighborhood.
It will all be cattywampus.
Trees gone, signs gone, crap everywhere, if you don’t need to travel, DON’T.
I mean CRAP e.v.e.r.y.w.h.e.r.e.
Stay away from power-lines.
Try to stay within your immediate neighborhood for the first 36-48 hours. Keep the roadways and main arteries clear for recovery workers, power companies and fuel trucks.
Remember, when it is safe to drive, every single intersection must be treated like a four-way stop…. and YOU ARE GOING TO HAVE TO PAY ATTENTION. Even the major intersections.
You’ll need to override your brain tendency to use memory in transit. You’ll need to pay close attention and watch for those who ain’t paying close attention. Travel sparingly, it’s just safer.
Stage one recovery focuses on major arteries… then secondary… then neighborhood etc. It’s a process. Oh, and don’t get mad if your fancy mailbox is ploughed-over by a focused front end loader who is on a priority mission to clear a path. Just deal with it. Those same front-end loaders will also be removing feet of sand from coastal roads. Don’t go sightseeing… stay in your neighborhood.
For the first 36-48 hours, please try to stay close to home, in your neighborhood. Another reason to stay close to home is the sketchy people who can sometimes surface, looters etc. Staying close to home and having contact with your neighbors is just reasonable and safer.
Phase-1 recovery is necessarily, well, scruffy…. we’re just moving and managing the mess; not trying to clean it up yet. It’ll be ok. There are going to be roofing nails everywhere, and you will likely get multiple flat tires in the weeks after the hurricane.
If you are on the road and there’s a convoy of utility trucks on the road, pull over. Treat power trucks and tanker trucks like ambulances and emergency vehicles. Pull over, give them a clear road and let them pass.
When everyone gets to work, if you see a line-man, pole-digger or crew say thanks. Just simple “thanks”. Wave at them and give them a thumbs-up. No need to get unnecessarily familiar, a simple: “thank you for your help” will suffice. You know, ordinary people skills.
Many of these smaller crews will be sleeping in cots, or in their trucks while they are working never-ending shifts. Some will be staging at evacuation shelters, likely schools and such. Once you eventually start getting power back, if you see a crew in a restaurant, same thing applies… “thanks guys”.
Same goes for the tanker truckers. The convenience stores with gas pumps are part of the priority network. Those will get power before other locales without power. Fuel outlets are a priority. Fuel is the lifeblood of recovery. Hospitals, first responders, emergency facilities, fuel outlets, then comes commercial and residential.
Pray together and be strong together. It might sound goofy to some, but don’t be bashful about being openly thankful in prayer.
It will be ok.
It might be a massive pain in the a**, but in the end, it’ll be ok.
Carbon Dioxide CO2 is not making dangerous changes to the global temperature!
From the attached report on climate change for August 2020Data we have the two charts showing how much the global temperature has actually gone up since we started to measure CO2 in the atmosphere? To show this graphically Chart 8 was constructed by plotting CO2 as a percent increase from when it was first measured in 1958, the Black plot, the scale is on the left and it shows CO2 going up a bit over 31.0% from 1958 to August of 2020. That is a very large change as anyone would have to agree. Now how about temperature, well when we look at the percentage change in temperature from 1958, using Kelvin (which does measure the change in heat), we find that the changes in global temperature (heat) are almost un-measurable. The scale on the right side had to be expanded 10 times (the range is 40 % on the left and 4% on the right) to be able to see the plot in the same chart in any detail. The red plot, starting in 1958, shows that the thermal energy in the earth’s atmosphere increased by .40%; while CO2 has increased by 31.0% which is 78 times that of the increase in temperature. So is there really a meaningful link between them that would give as a major problem? The numbers tell us no there isn’t.
The next chart is Chart 8a which is the same as Chart 8 except for the scales which are the same for both CO2 and Temperature. As you see the increase in energy, heat, is not visually observably in this chart hence the need for the previous chart 8 to show the minuscule increase in thermal energy shown by NASA in relationship to the change in CO2. Based to these trends, determined by excel not me, in 2028 CO2 will be 428 ppm and temperatures will be 15.0o Celsius and in 2038 CO2 will be 458 ppm and temperatures will be 15.6O Celsius. This is what the data shows no matter what the reasons are, so I have no idea how the IPCC gets to predict that the world will end in ten or even twenty years.
The full 40 page report explains how these charts were developed and why using NASA and NOAA data that are used without change to prove that The New Green Deal is not required and any attempt to complete that plan will be a worldwide disaster.
Click on the link below for the full report that you can download.
I have created this site to help people have fun in the kitchen. I write about enjoying life both in and out of my kitchen. Life is short! Make the most of it and enjoy!
This is a library of News Events not reported by the Main Stream Media documenting & connecting the dots on How the Obama Marxist Liberal agenda is destroying America