COMMENT: All of a sudden, El Niño is proof of global warming, just like the wildfires in Australia and California, as if these things never happened before. The sheep believe whatever the press tells them. That’s why you cannot stop the cycle, and 2032 is now not so far away.
HW
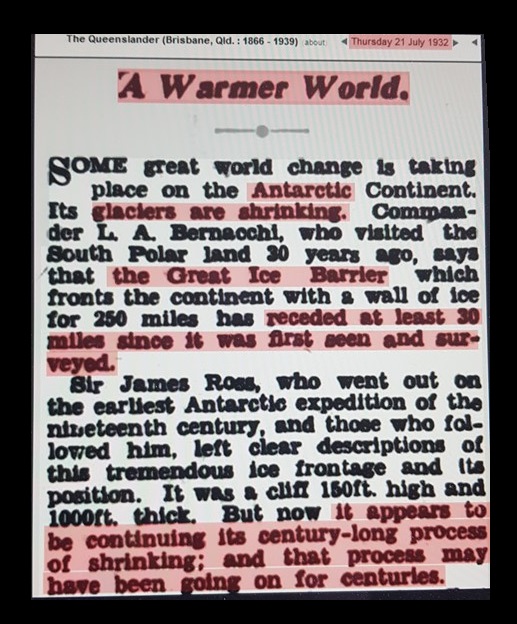
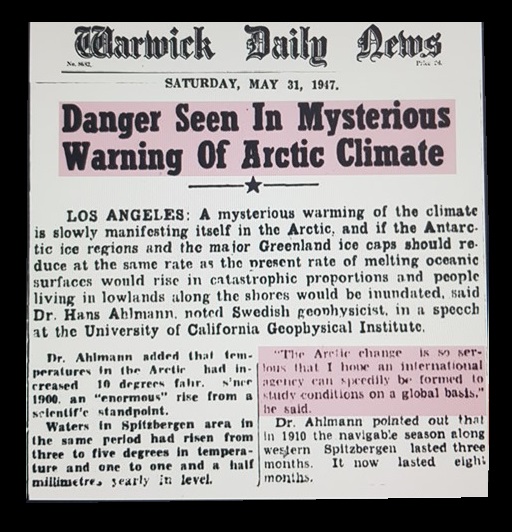
ANSWER: El Niño and La Niña are climate patterns in the Pacific Ocean that have impacted weather worldwide for centuries. This very intense cycle will increase the risk of famine in parts of the world from 2024 to 2025. Here is a chart of the temperaturesback to 1950. Look closely, and you will see that the cycle is very violent. It goes from hot and then plunges into a Panic Cycle type move immediately thereafter.
El Niño events are thought to have occurred for thousands of years, and only now are people claiming this is proof of humans changing the environment. It is believed that historically the Indians in Peru sacrificed humans to try to prevent the rains caused by a severe El Niño. Perhaps they might have had better success by offering politicians instead of virgins. These people latch on to anything and now with ZERO proof, they tell everyone that it is Climate Change that is making it hotter.
Perhaps we should just turn off the energy used by mainstream media and their propaganda as well as in Washington, and end taxes as Roman Emperor Tiberius did during an emergency. I would bet things will get a lot better and real fast.
Most people don’t have a clear understanding of the greenhouse effect (GHE). It is not complicated to understand, but it is usually not well explained. It is often described as “heat-trapping,” but that is incorrect. Greenhouse gases (GHG) do not trap heat, even if more heat resides within the climate system due to their presence in the atmosphere. The truth is that after adjusting to a change in GHG levels, the planet still returns all the energy it receives from the Sun. Otherwise, it would continue warming indefinitely. So, there is no change in the energy returned. How do GHGs produce GHE?
GHGs cause the atmosphere to be more opaque to infrared radiation. As solar radiation heats mainly the ocean and land surface of the planet, GHGs absorb thermal emission from the surface at the lower troposphere and immediately pass that energy along to other molecules (typically N2 and O2) through collisions that occur much faster than the time it would take to re-emit the radiation. This warms the lower troposphere. The density and temperature decrease rapidly through the troposphere, so molecules are colder and more separated at the upper troposphere. Now GHGs have a chance to emit IR radiation so when they finally collide with another molecule, they are colder so GHGs have a cooling effect in the upper troposphere and stratosphere.
Because GHGs make the atmosphere more opaque to IR radiation, when they are present the emission to space from the planet normally does not take place from the surface (as happens in the Moon). Part of it still takes place from the surface through the atmospheric window, but most of it takes place from higher in the atmosphere. We can define a theoretical effective emission height as the average height at which the Earth’s outgoing longwave radiation (OLR) is being emitted. The temperature at which the Earth emits is the temperature at the effective emission height in the atmosphere. That temperature, when measured from space is 250 K (-23°C), not 255 which is the calculated temperature for a theoretical blackbody Earth. That temperature corresponds to a height of about 5 km, which we call the effective emission height.
The last piece we need to understand the GHE is the lapse rate, which in the troposphere is positive, meaning that temperature decreases with height. Without a positive lapse rate, the GHE does not work. Since GHGs cause the planet to emit from a higher altitude, due to making the atmosphere more opaque to IR radiation, that altitude is colder due to the lapse rate. The Earth still needs to return all the energy received from the Sun, but colder molecules emit less. So, the planet will go through a period when it will emit less than it should, warming the surface and the lower troposphere until the new height of emission achieves the temperature necessary to return all the energy, at which point the planet stops warming.
The GHE simply states that the temperature at the surface (Ts) is just the temperature of emission (Te) plus the lapse rate (Γ) times the height of emission (Ze).
Ts = Te + ΓZe
Held & Soden (2000) illustrated it in figure 1:
This is how the GHE actually works. An increase in CO2 means an increase in the height of emission. Since the temperature of emission must remain the same, the temperature from the surface to the new height of emission must increase. The increase is small but significant. As Held and Soden say:
“The increase in opacity due to a doubling of CO2 causes Ze to rise by ≈150 meters. This results in a reduction in the effective temperature of the emission across the tropopause by ≈(6.5K/km) (150 m) ≈1 K.”Held and Soden
So, the temperature at the surface must increase by 1K. That’s the direct warming caused by the doubling of CO2, before the feedbacks (mainly water vapor) kick in, further raising the height of emission.
This also has an interesting prediction. If the warming is due to an increase in CO2 when the increase takes place and the altitude of emission increases, the planet should emit less OLR as the new altitude is colder and a reduced OLR is the warming mechanism. Once the warming takes place, the OLR will become the same as before the GHG increase. It says so in Held and Soden’s figure 1 caption: “Note that the effective emission temperature (Te) remains unchanged.” Same Te, same OLR. So, if CO2 is responsible for the surface temperature increase, we should first expect less OLR and then the same OLR. If at any time we detect more OLR that would indicate another cause for the warming. Anything that makes the surface warmer, except GHGs, will increase the temperature of emission, increasing OLR.
So, this is the test:
– Surface warming but less or same OLR: CO2 is guilty as charged
– Surface warming and more OLR: CO2 is innocent
And the test results can be evaluated for example with Derwitte and Clerbaux 2018:
“decadal changes of the Outgoing Longwave Radiation (OLR) as measured by the Clouds and Earth’s Radiant Energy System from 2000 to 2018, the Earth Radiation Budget Experiment from 1985 to 1998, and the High-resolution Infrared Radiation Sounder from 1985 to 2018 are analyzed. The OLR has been rising since 1985, and correlates well with the rising global temperature.“Derwitte and Clerbaux 2018
CO2 is innocent. Its fingerprint is not found at the crime scene. Something else is warming the planet and causing the increase in OLR.
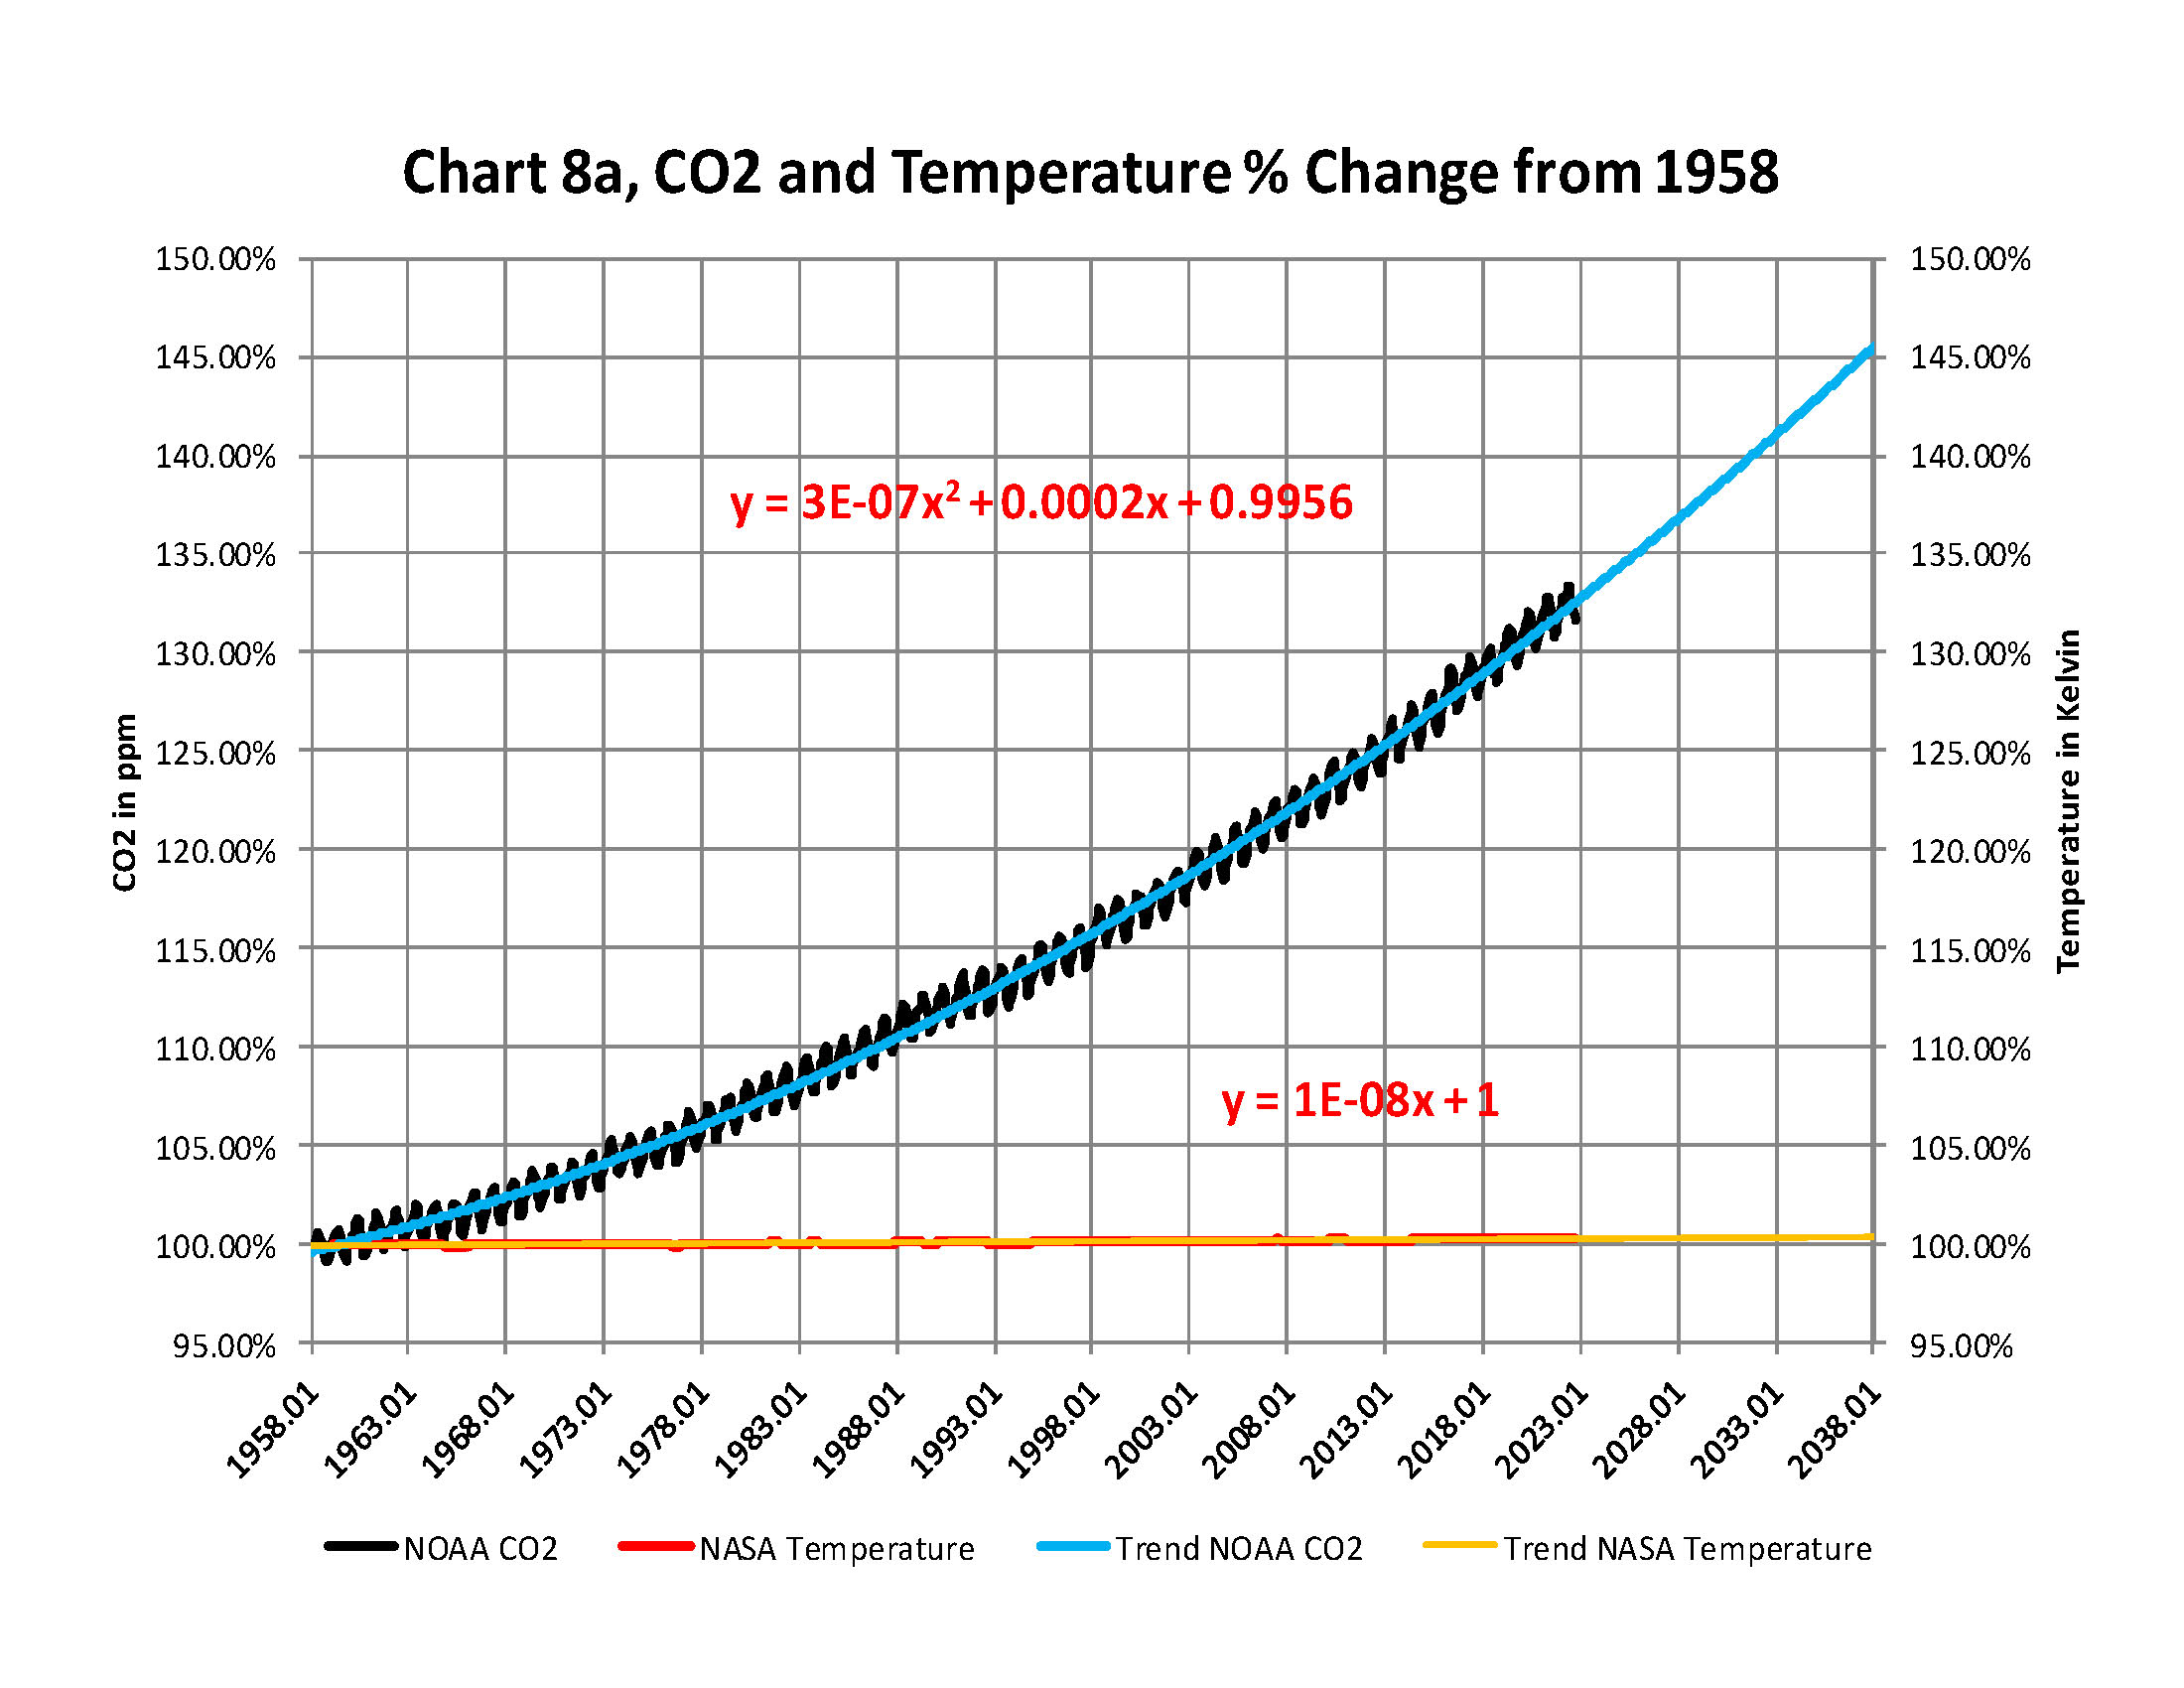
From the attached report on climate change for November 2022Data we have the two charts showing how much the global temperature has actually gone up since we started to measure CO2 in the atmosphere in 1958? To show this graphically Chart 8a was constructed by plotting CO2 as a percent increase from when it was first measured in 1958, the Black plot, the scale is on the left and it shows CO2 going up by about 32.4% from 1958 to November of 2022. That is a very large change as anyone would have to agree. Now how about temperature, well when we look at the percentage change in temperature also from 1958, using Kelvin (which does measure the change in heat), we find that the changes in global temperature (heat) is almost un-measurable at less than .4%.
As you see the increase in energy, heat, is not visually observably in this chart hence the need for another Chart 8 to show the minuscule increase in thermal energy shown by NASA in relationship to the change in CO2 Shown in the next Chart using a different scale.
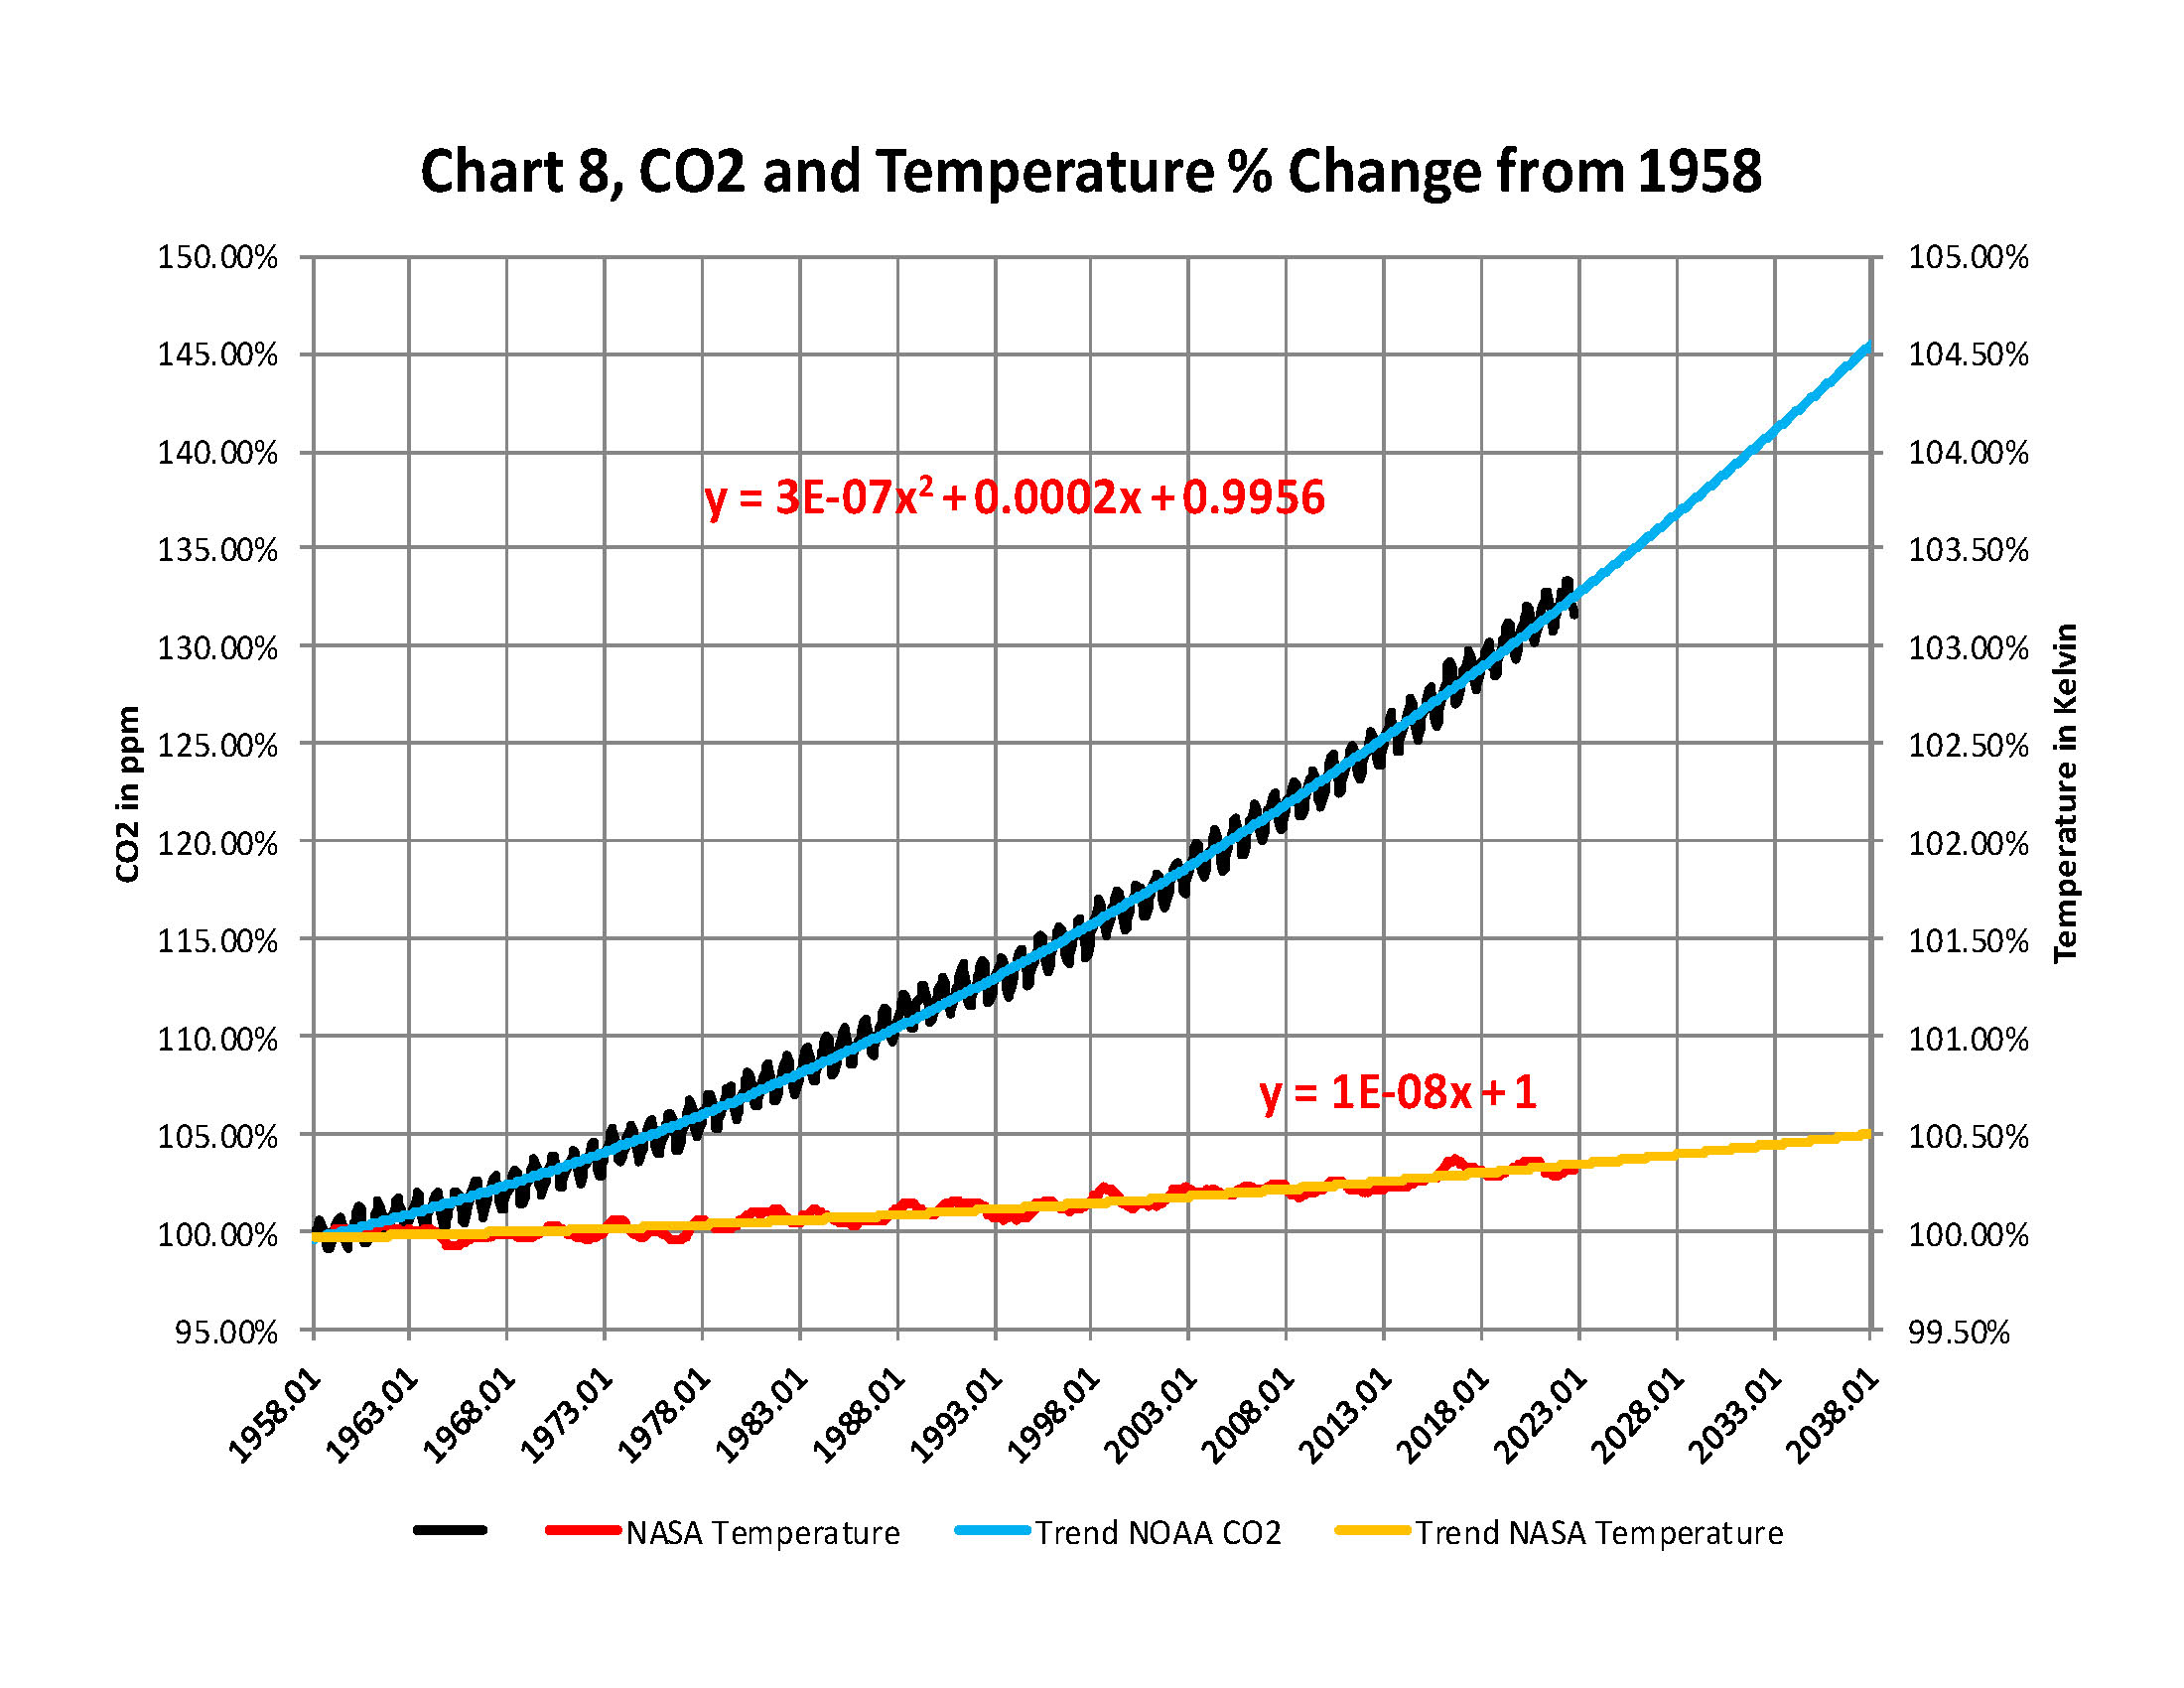
This is Chart 8 which is the same as Chart 8a except for the scales. The scale on the right side had to be expanded 10 times (the range is 50 % on the left and 5% on the right) to be able to see the plot in the same chart in any detail. The red plot, starting in 1958, shows that the thermal energy in the earth’s atmosphere increased by .40%; while CO2 has increased by 32.4% which is 80 times that of the increase in temperature. So is there really a meaningful link between them that would give as a major problem?
Based to these trends, determined by excel not me, in 2028 CO2 will be 428 ppm and temperatures will be a bit over 15.0o Celsius and in 2038 CO2 will be 458 ppm and temperatures will be 15.6O Celsius.
The NOAA and NASA numbers tell us the True story of the
Changes in the planets Atmosphere
The full 40 page report explains how these charts were developed .
Posted originally on the conservative tree house on November 24, 2022 | sundance
We have been closely monitoring the signs of a global cleaving around the energy sector taking place. Essentially, western governments’ following the “Build Back Better” climate change agenda which stops using coal, oil and gas to power their economic engine, while the rest of the growing economic world continues using the more efficient and traditional forms of energy to power their economies.
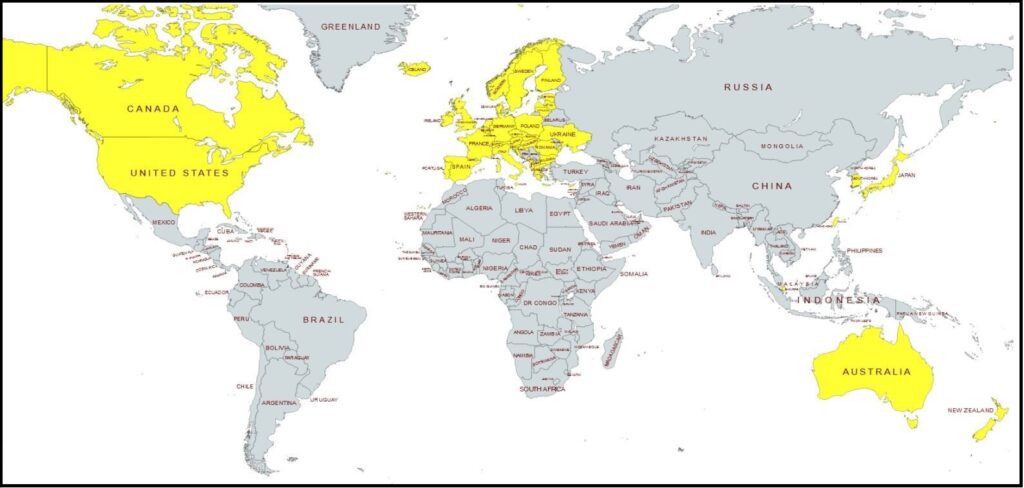
Within the BBB western group (identified on map in yellow), the logical consequences are increased living costs for those who live in the BBB zone, and increased prices for goods manufactured in the BBB zone. In the zone where traditional low-cost energy resources continue to be developed (grey on map), we would expect to see a lower cost of living and lower costs to create goods. Two divergent economic zones based on two different energy systems.
This potential outcome just seemed to track with the logical conclusion. The yellow zone also represented by the World Economic Forum, and the gray zone also represented by an expanding BRICS alliance. Against this predictable backdrop we have been watching various events unfold, some obvious and some less so.
Today, we get an obvious example:
NEW DELHI, Nov 24 (Reuters) – Fiat parent Stellantis (STLA.MI) has concluded it can’t currently make affordable electric vehicles (EVs) in Europe and is looking at lower-cost manufacturing in markets such as India, its chief executive told reporters.
If India, with its low-cost supplier base, is able to meet the company’s quality and cost targets by the end of 2023, it could open the door to exporting EVs to other markets, said Carlos Tavares, CEO of the group whose brands also include Peugeot and Chrysler.
“So far, Europe is unable to make affordable EVs. So the big opportunity for India would be to be able to sell EV compact cars at an affordable price, protecting profitability,” Tavares told reporters at a media roundtable in India late on Wednesday.
Stellantis is investing heavily in EVs and plans to produce dozens in the coming decade, but Tavares warned last month that affordable battery EVs were between five and six years away.
On his first visit to India since taking over as Stellantis CEO, he said the company was still working out a plan regarding EV exports from the country and had not yet taken any decisions. (read more)
.
Normally we would expect to see market forces determining the ultimate economic outcome. Historically, we would not expect government policy that puts their nation at an economic disadvantage. However, in this WEF controlled new western economic normal we see multinational corporations’ making decisions and government leaders creating policy to support the corporations.
There is money to be made by corporations within the climate change agenda, and there is money to be made by producing goods with low-cost wages and cheap materials. Eventually, if you keep following this to its natural conclusion, the entire yellow zone becomes a service driven economy.
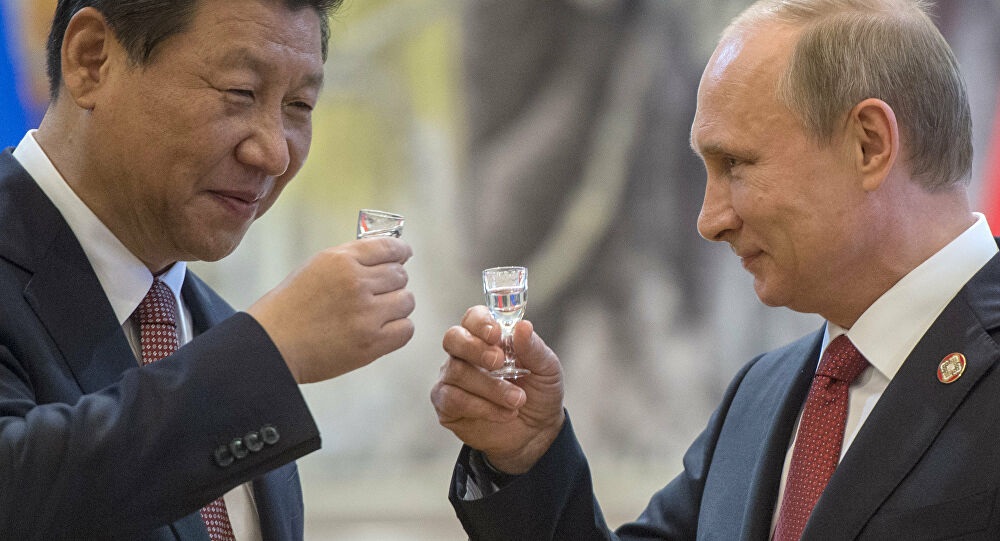
Multinational corporations in control of government are what the BRICS assembly foresaw when they first assembled during the Obama administration. When multinational corporations run the policy of western government, there is going to be a problem. Brazil, Russia, India, China and South Africa (BRICS) saw President Obama sub-contracting, actually giving away, U.S. trade policy.
In the bigger picture, the BRICS assembly are essentially leaders who do not want corporations and multinational banks running their government. BRICS leaders want their government running their government; and yes, that means whatever form of government that exists in their nation, even if it is communist.
BRICS leaders are aligned as anti-corporatist. That doesn’t necessarily make those government leaders better stewards, it simply means they want to make the decisions, and they do not want corporations to become more powerful than they are. As a result, if you really boil it down to the common denominator, what you find is the BRICS group are the opposing element to the World Economic Forum assembly.
The BRICS team intend to create an alternative option for all the other nations. An alternative to the current western trade and financial platforms operated on the use of the dollar as a currency. Perhaps many nations will use both financial mechanisms depending on their need.
The objective of the BRICS group is simply to present an alternative trade mechanism that permits them to conduct business regardless of the opinion of the multinational corporations in the ‘western alliance.’
Again, if you follow the Build Back Better agenda to its natural conclusion, the entire yellow zone becomes a service driven economy.
The United Nations proposed a new method to funnel money out of developed nations during the COP27 meeting – climate reparations. The United Nations is still negotiating who will pay what, but rest assured, the US will likely pay the most. President Biden fully supports the idea in addition to the $1 billion he was granted last year to fight third-world climate change. China is considered a developing nation, according to the UN, and will not contribute to the global fund despite being the largest polluter in the world.
The ”loss and damage fund,” as it is known, would take money from rich nations in an attempt to change the weather and prevent natural disasters that would take place even if humans did not inhabit Earth. The funds would primarily be sent to countries in Latin America, Africa, and Asia. Fears are sparking that this would act as a confession, and developing nations could sue developed nations and/or businesses for additional compensation.
Trump attempted to get America out of the Paris Accord. The GOP-majority House will likely not vote in favor of this measure. Our best bet is to hope they kick the can down the road until Biden’s term has ended.
From the attached report on climate change for October 2022Data we have the two charts showing how much the global temperature has actually gone up since we started to measure CO2 in the atmosphere in 1958? To show this graphically Chart 8a was constructed by plotting CO2 as a percent increase from when it was first measured in 1958, the Black plot, the scale is on the left and it shows CO2 going up by about 32.4% from 1958 to October of 2022. That is a very large change as anyone would have to agree. Now how about temperature, well when we look at the percentage change in temperature also from 1958, using Kelvin (which does measure the change in heat), we find that the changes in global temperature (heat) is almost un-measurable at less than .4%.
As you see the increase in energy, heat, is not visually observably in this chart hence the need for another Chart 8 to show the minuscule increase in thermal energy shown by NASA in relationship to the change in CO2 Shown in the next Chart using a different scale.
This is Chart 8 which is the same as Chart 8a except for the scales. The scale on the right side had to be expanded 10 times (the range is 50 % on the left and 5% on the right) to be able to see the plot in the same chart in any detail. The red plot, starting in 1958, shows that the thermal energy in the earth’s atmosphere increased by .40%; while CO2 has increased by 32.4% which is 80 times that of the increase in temperature. So is there really a meaningful link between them that would give as a major problem?
Based to these trends, determined by excel not me, in 2028 CO2 will be 428 ppm and temperatures will be a bit over 15.0o Celsius and in 2038 CO2 will be 458 ppm and temperatures will be 15.6O Celsius.
The NOAA and NASA numbers tell us the True story of the
Changes in the planets Atmosphere
The full 40 page report explains how these charts were developed .
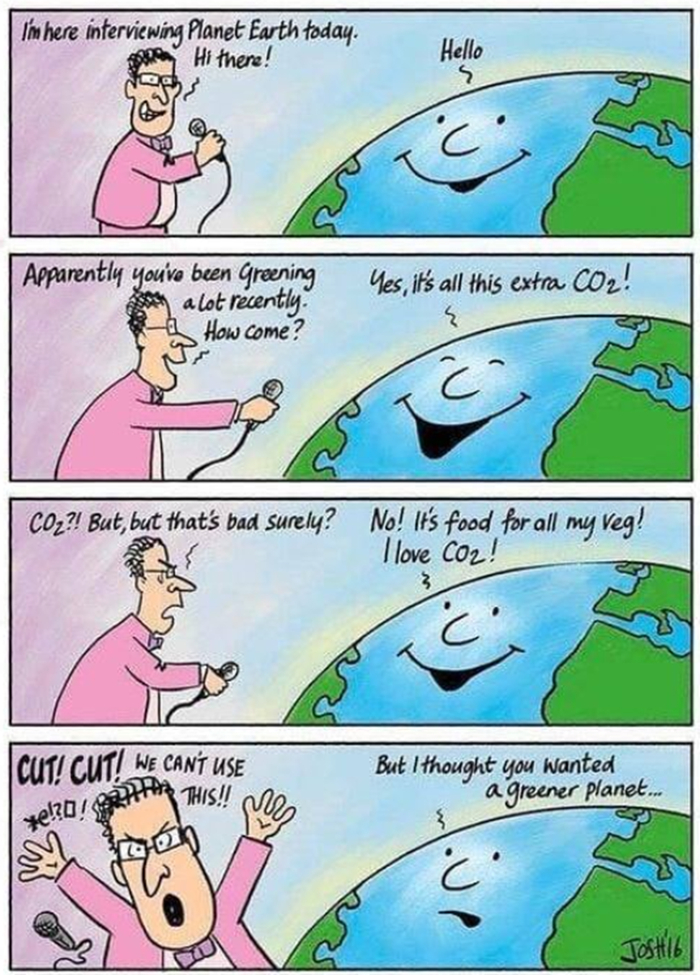
COMMENT: Dear Mr. Armstrong, As always, thank you so much for your incredible insight to what is happening in the world. You are the first news source I read in the morning because I know your site is always two steps ahead of everyone else! I wished to ask you about something you often reference: that many of these globalists are trying to destroy fossil fuels for “climate change”.
However, going by their actual behavior, it seems that they don’t *genuinely* believe in climate change, otherwise they wouldn’t be flying around in private jets, owning ocean-front property, or creating more carbon emissions than many small countries. Do you think they actually believe the earth is in danger or are they trying to force the majority of humanity back into a third world state because without the ability to travel, or heat/cool homes, communicate with one another, or have access to clean water, meat and nutritious food, etc., we not only will lose much of the population to sickness and starvation, but those who are left would become much more dependent on the state (them) and therefore easier to control?
Depopulation and crushing humanity into a smaller, weaker, more controllable feudal-system peasantry seems more like the actual reason for destroying fossil fuels, food security, and private ownership, with “climate change” merely being their flimsy excuse to do so. Do you think any of those pulling the strings on all this really believes what they’re saying about climate change?
ED
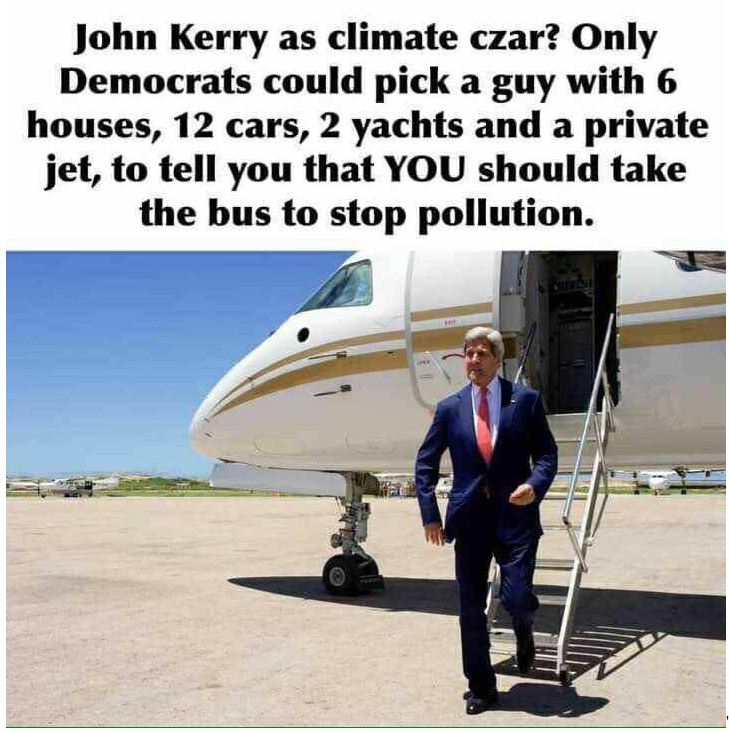
REPLY: The elite could care less about climate change. They know it is laughable. Even John McCain was pushing it only because it was to hurt Russia cutting off its resources and he was pushing nuclear energy to replace fossil fuels only as a strategic chess move against Russia – his eternal enemy.
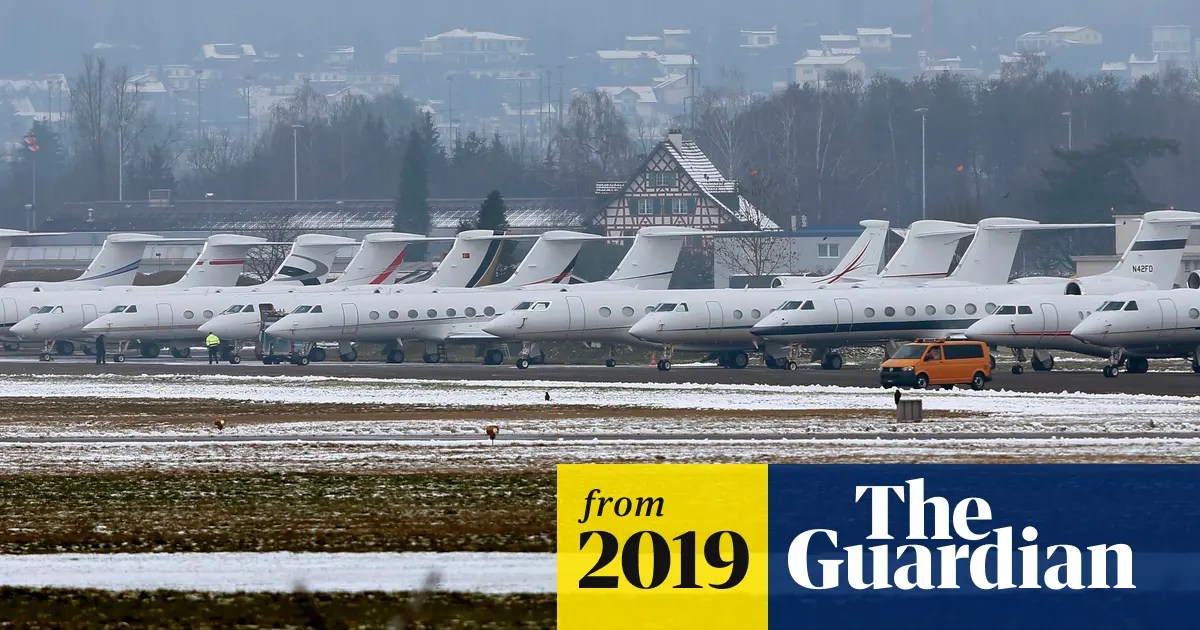
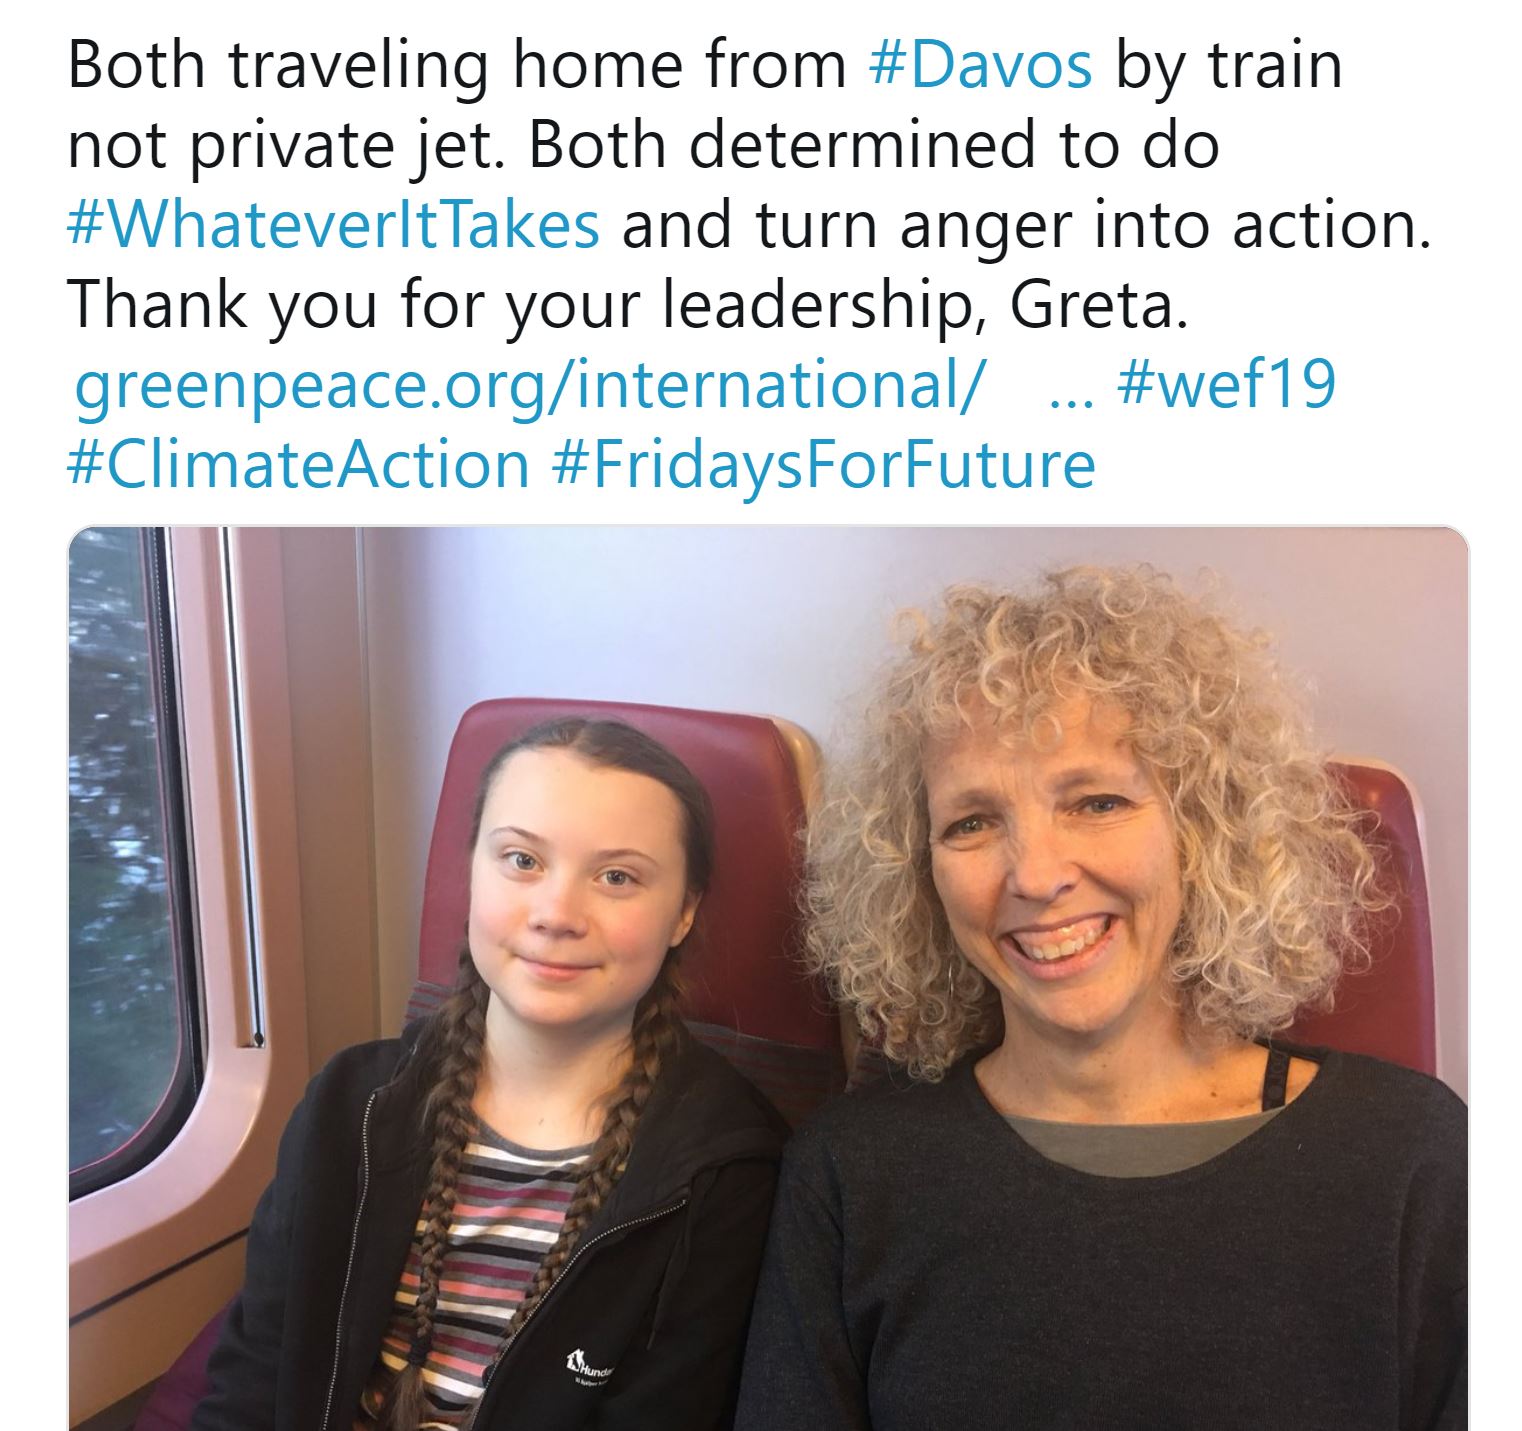
These ELITE people do not care about the climate. They all travel to Davos in private jets. Al Gore and UN Secretary-General Antonio Guterres at Davos in 2019 told delegates that humanity is “losing the race” against climate change. Al Gore conspires with Greenpeace and used Greta for their publicity stunts. I would say he is a believer, but do not count on his intelligence. He has never questioned the limited data.
The Elite have used climate change as the spearhead for the Great Reset, which is all about coming up with propaganda to cover up the Sovereign Debt default. Trust me. Many at the top are laughing their ass off at how they have sold this nonsense to people who just eat it up. John McCain was preaching nuclear energy back in the 2008 election to end dependency on foreign oil purely for military purposes – not the environment. They have brainwashed many and they just repeat the nonsense without the slightest investigation on their own. Oh, there is a drought, and skeletons are now revealed in Hoover Dam so that is proof of climate change! But they fail to take the next step and ask if that has that taken place before. There are natural cycles to climate so it always changes.
The Elite used Greta, and once they managed to get the press selling their BS and believing this changed the planet, they discarded her. They use people to achieve their goals and that is all this war is really about. To destroy the economy of Russia. Occupy the country and end fossil fuels so that Russia will be reduced to a vassal state. They have not probably reduced the population by 50% ANYHOW. The real powers do not care about Climate Change. They know this is all nonsense.
The climate change zealots have found a new scapegoat to blame for changes in the weather – the family pet. CNN has dubbed the term “carbon pawprint” and is urging owners to switch their pets over to insect-based diets or lab-grown meat and reconsider future animal adoptions.
There was a 2017 study entitled “Environmental Impacts of Food Consumption by Dogs and Cats” that claims pets are responsible for global warming. “Dog and cat animal product consumption is responsible for release of up to 64 ± 16 million tons CO2-equivalent methane and nitrous oxide, two powerful greenhouse gasses (GHGs),” the study cited. The author suggests “reducing the rate of dog and cat ownership” in favor of smaller rodents or reptiles. If someone must have a dog, they claim it is better to adopt a small breed as it eats less.
“As calculated, US dogs and cats consume as much dietary energy as ~62 million Americans, which is approximately one-fifth of the US population. Although there are fewer dogs and cats in the US than people, they derive more of their energy from animal-derived products (33% ± 6% vs. 19% for people). Thus, if pets’ consumption was included in calculations, the US would be equivalent to a country of ~ 380 million in terms of raw dietary energy consumed and a country of about 690 million in terms of animal-derived energy consumed.”
The study glosses over the fact that many animals eat meat that is not safe for human consumption and would be otherwise thrown away. The study makes numerous mentions of the mental health benefits that pet ownership provides, but still concludes that reducing the number of pets in our society is for the greater good.
I am certain that those flying in their private jets to Davos are creating a larger carbon imprint. Around 100 companies are responsible for 71% of global emissions, but the average person must always be forced to change their ways. I do not put it past the extreme leftists to implement taxes on pet ownership.
As senior U.S. military officers deployed to NATO’s front line against Russia on the border with Ukraine have boasted that they are ready to join the fight. This provoked a response from Russia’s ambassador to the United States told Newsweek that such a move would bring about catastrophic ramifications. The commanders of the U.S. Army 101st Airborne Division who are now stationed just a few miles from the Romanian border with Ukraine are also making comments that they were ready to cross over in response to any escalation or attack on NATO.
This is all calling into question who the hell is the real commander and chief? President Joe Biden has repeatedly stated he was not going to send U.S. soldiers into Ukraine itself. The US has NOT sent troops to the borders of NATO since World War II. The National Security Council Strategic Communications Coordinator John Kirby rushed to then say that “nothing has changed about the commander-in-chief’s decision that there will be no American troops fighting inside Ukraine.” This is raising serious concerns about who is really in charge and do we have a military so eager to jump in that we end up in WWIII because of all of this nonsense.
Russian Ambassador Anatoly Antonov said, “we have already officially pointed out to high-ranking members of the US Government that such bravura statements by the U.S. Army commanders are inadmissible.” He further warned that Moscow would take these comments seriously. Behind the curtain, there is serious concern that Biden is just a puppet and has no idea that his administration is pushing the world to WWIII.
Antonov added: “We are not going to tolerate a situation where military threats are mounting on Russian borders… Direct participation of the U.S. military in the fighting will lead to disastrous consequences. I am convinced that further aggravation of the situation is not in Washington’s interests.”
There is absolutely no reason for the US to have troops stationed on the border. Russia is not interested in invading NATO and they too realize what that would mean. Stationing the Hard Rock Company, 1st Battalion, 502nd Infantry Regiment, 2nd Brigade Combat Team, 101st Airborne Division (Air Assault), only increases the chance of war just like in Vietnam. This has been the first time in nearly 80 years that troops have been sent in this manner.
The Russian ambassador Antonov warned that “Washington is becoming increasingly involved in the conflict in Ukraine, turning the country’s territory into a battlefield with Russia.” If Russia sent nukes to Venezuela or stationed troops in Mexico, I seriously doubt the US would stand by silently.
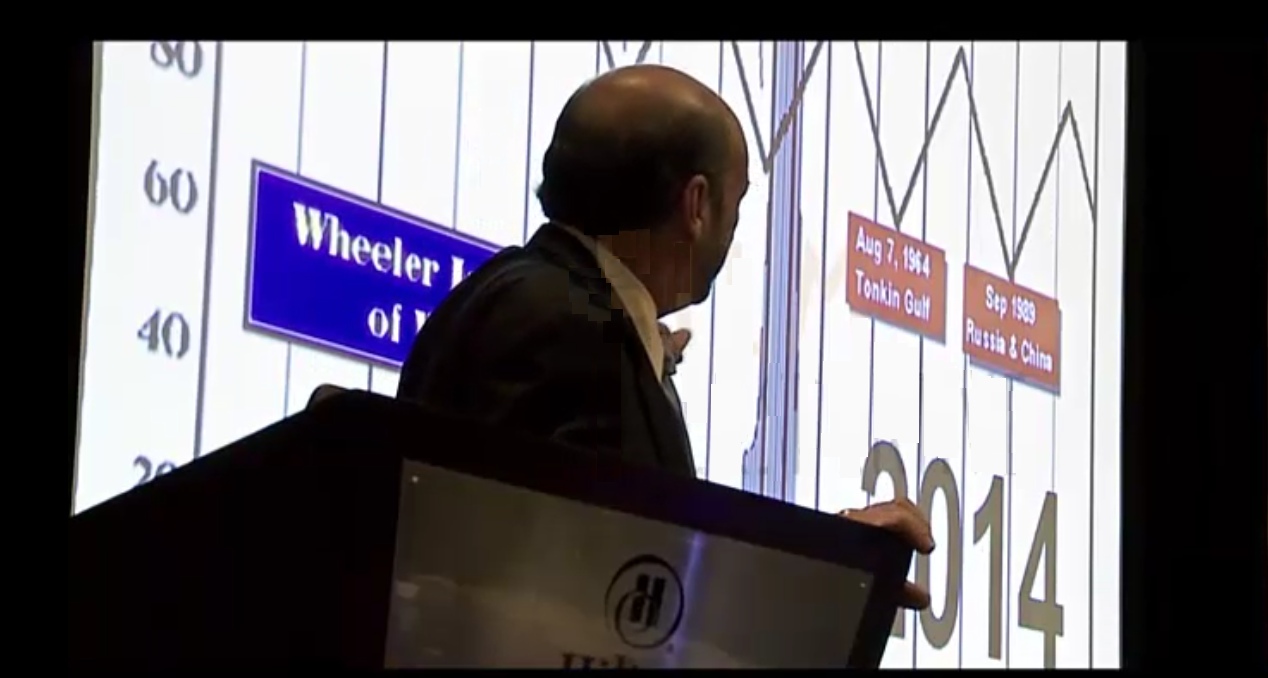
Our War Model globally turned up in 2014 as I laid out at the 2011 World Economic Conference. I have warned that history will call this the Climate Change War. The Biden Administration is being run by climate zealots telling us our pets have to eat bugs along with us and they want to impose a federal tax to even have a pet of several thousand dollars to reoccur annually no less. These zealots want to wipe out Russia because they produce energy and that is 50% of the GDP. Having Ukrainians die for climate change is no problem – there are too many people anyway.
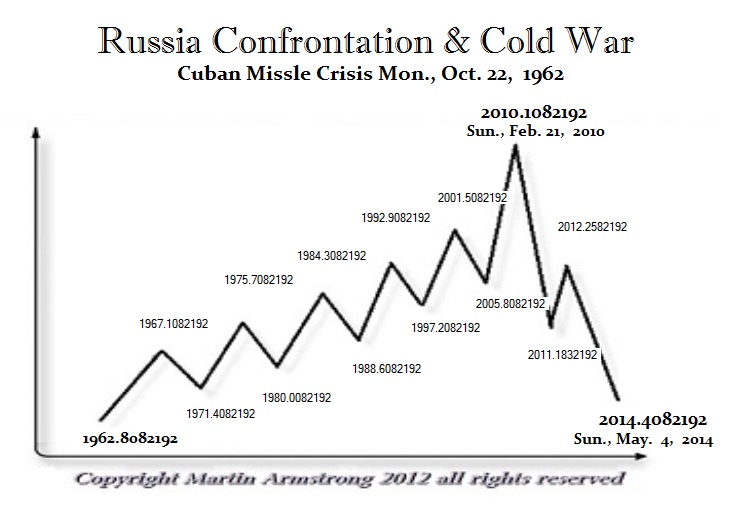
Even the Cuban Missile Crisis on a 51.6-year calculation turned back up on May 4th, 2014. The next 8.6-year wave will be 2023.008 which will be January 3rd, 2023. The peak of that wave will then be 2027.308 which is April 9th, 2027. These people have reignited the U.S.-Russia rivalry intensifying to levels not seen since the Cuban Missile Crisis of 1962. Zelensky is sacrificing his country for money. You do not put your entire nation at risk for a strip of land that has always been occupied by Russians for centuries. He takes his orders from the Biden Administration and it is public knowledge that he was told not to negotiate for peace.
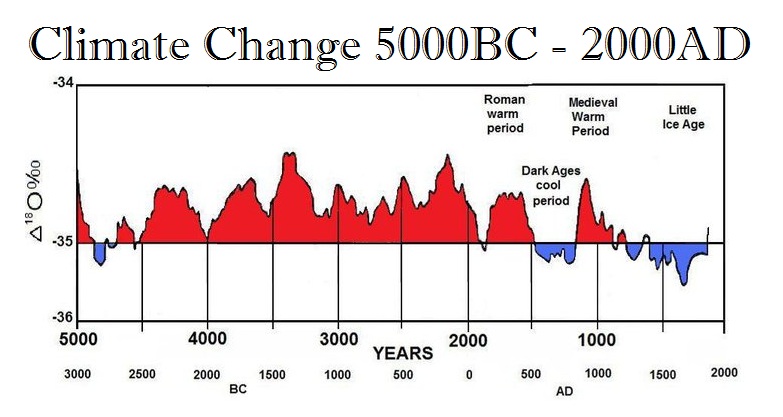
These Climate Change Zealots are bringing the world to complete disaster over total nonsense when Climate Change has been a natural cycle for millions of years. They ignore the history of the planet past 1850 because they want to simply blame everything on the Industrial Revolution. They have confused pollution with climate change and will not address that there have been warming periods and ice ages without people driving their SUVs.
The military always wants war. They get to play with all their cool stuff. They have been using Ukraine to study Russia’s tactics and weapons. This has been a fantastic learning experience for the military. The problem this time, one Russian nuclear sub can surface offshore and fire 60 nukes and we will not be able to shoot them all down.
Posted originally on the conservative tree house on October 26, 2022 | Sundance
The extreme vitriol against the recent OPEC+ decision to cut oil output, specifically the extreme Biden anger toward Saudi Arabia, now takes on additional context as the New York Times writes about a secretly negotiated deal between the Kingdom and White House officials that was never executed.
As the Times reveals, over the summer the White House thought their team had negotiated a deal with Saudi Arabia for increased oil production that would have lowered oil and gasoline costs in the U.S, strategically timed before the midterm election.
With that agreement in mind, Joe Biden went to Saudi Arabia a few months ago. However, as the western alliance began putting more pressure on Russia and increased the activity within Ukraine, the Saudi’s aligned with OPEC+ to support Russia via lowered oil outputs. The White House felt double-crossed, hence the fury.
(New York Times) – WASHINGTON — As President Biden was planning a politically risky trip to Saudi Arabia this summer, his top aides thought they had struck a secret deal to boost oil production through the end of the year — an arrangement that could have helped justify breaking a campaign pledge to shun the kingdom and its crown prince. It didn’t work out that way.
Mr. Biden went through with the trip. But earlier this month, Saudi Arabia and Russia steered a group of oil-producing countries in voting to slash oil production by two million barrels per day, the opposite of the outcome the administration thought it had secured as the Democratic Party struggles to deal with inflation and high gas prices heading into the November elections.
The move led angry Biden administration officials to reassess America’s relationship with the kingdom and produced a flurry of accusatory statements between the two governments — including a charge by the White House that Saudi Arabia was helping Russia in its war in Ukraine.
[Democrat] Lawmakers who had been told about the trip’s benefits in classified briefings and other conversations that included details of the oil deal — which has not been previously disclosed and was supposed to lead to a surge in production between September and December — have been left fuming that Crown Prince Mohammed bin Salman duped the administration. (read more)
This approach makes sense from the perspective of a White House intent on manipulating the U.S. economy to achieve ideological goals.
The climate change agenda is a larger picture scheme all about power and control. Downstream mechanisms of government, and institutions in the private and financial sector, collaboratively created by people in power, want to take advantage of the fraudulent dynamic for increased influence and affluence.
The love of money is always at the root of evil enterprise. The Build Back Better / Green New Deal is ultimately about controlling people and assembling more wealth amid a small tier of self-described elites. Inflation that crushes the working class around the world is an outcome of this larger dynamic of manipulating energy.
“The Great Reset” is designed to the benefit of the few.
…”I think they may have wanted a sword dance, lol”…
I have created this site to help people have fun in the kitchen. I write about enjoying life both in and out of my kitchen. Life is short! Make the most of it and enjoy!
This is a library of News Events not reported by the Main Stream Media documenting & connecting the dots on How the Obama Marxist Liberal agenda is destroying America