The Cycle of War & Revolution


Posted originally on Sep 1, 2025 by Martin Armstrong |  
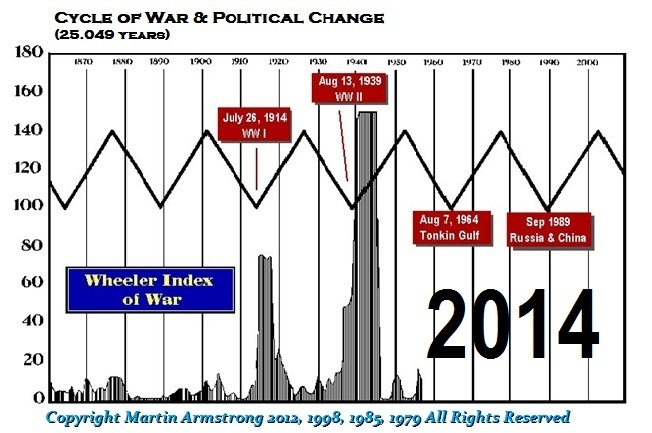
War Cycle 2014

QUESTION #1: Hi Martin,

Since the international war array started picking up in 2022 but peaks in 2026 with a panic cycle, do we in fact expect a serious deflagration potentially nuclear but very short lived and closing by 2027 since it’s the peak? Would that mean a very swift demise of European stupid leaders and we’re done for the following few years until the US and China want to face off?

Best,
PH

QUESTION #2: Marty, I was at your 2011 Philadelphia conference when you said that war would start in 2014 and that ended up with the Ukraine Revolution and Kiev attacking the Donbas, starting the Civil War. I believe you said this will build in intensity, similar to the ECM going into 2028. Do you have any updates on that?

Roger
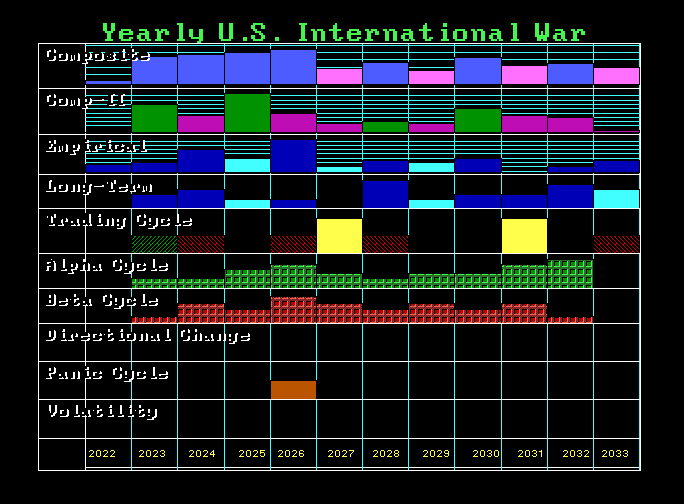
2022 Intl War Index
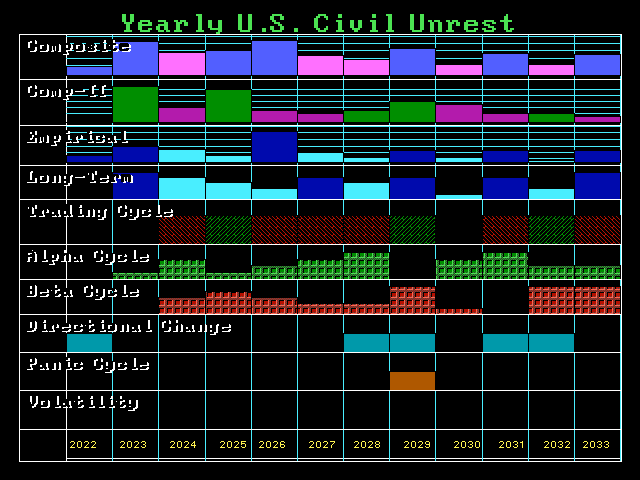
Civil Unrest 2023

ANSWER: Keep in mind that just as the Economic Confidence Model is NOT in the computer arrays, neither is the War Cycle. The array is ENTIRELY the product of Socrates with ZERO human interference. Then there are two primary databases. One is only wars between nations, and the other is purely domestic civil unrest that can emerge as revolutions, as in the cases of the American Revolution, the US Civil War, the French Revolution, the 1848 European Revolutions, the 1917 Russian Revolution, and the revolutions in Asia.

Under NO circumstances do I ever interfere with the cyclical forecasts of Socrates. That would defeat my own objective. Sociales is reliable BECAUSE it is NOT biased. Being human means we have some predetermined hardwiring toward something. I tend to be personally in favor of freedom and against controlling government actions. I cannot allow that to color my judgment, so the best way is for me to look at Socrates, which will enable me to do the timing forecasts.
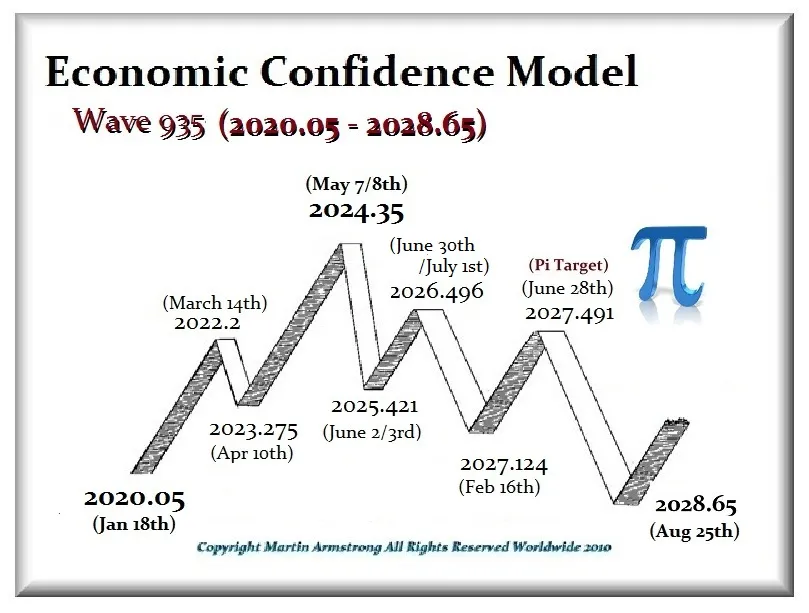
935 ECM 2020 2028
ECM Economic Confidence Model 8.6 Year Panics

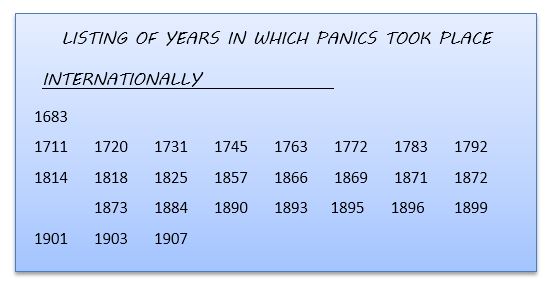
Here are two separate models. The ECM was derived from a list of panics. That is what makes this so accurate worldwide compared to Benner or Kondratieff, which were based on the economic data of the 19th century, when the dominant sector was commodities – agriculture. Because this was a list of PANICS, the sector differed, but the reaction was the same. As I have said, the 1960s taught me that panics occurred in stocks, collectibles, real estate, and gold, and eventually led to the collapse of the Bretton Woods system by 1971. This made sense to me, for what I witnessed was that the instrument did not matter. The common denominator was the human response.
1929 Wave Hitler on Pi

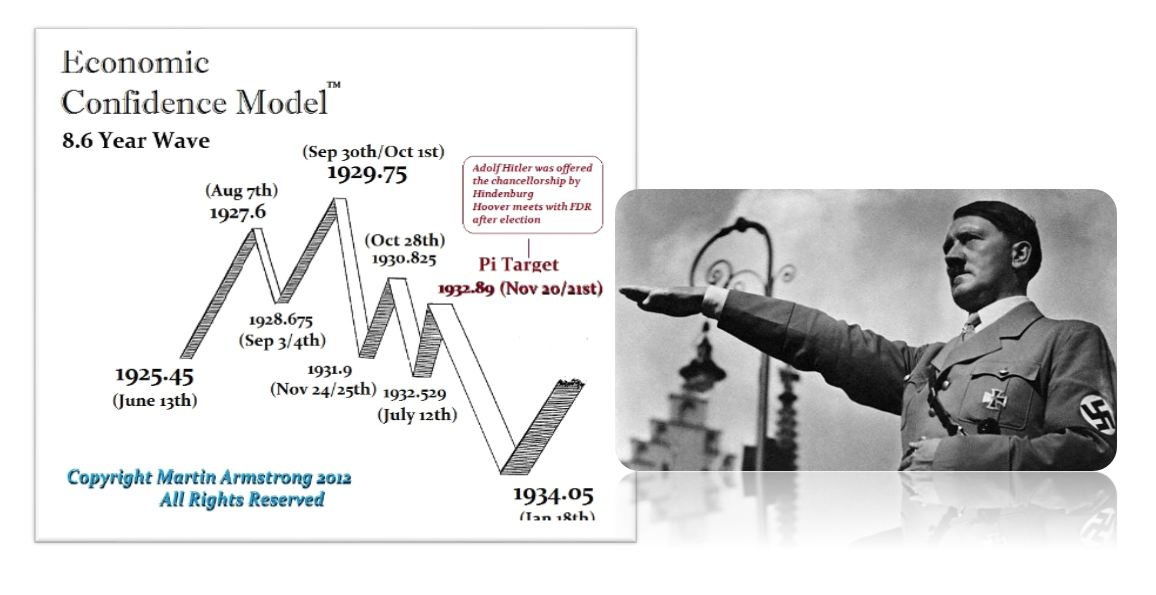
That is what the ECM is all about and why it has been accurate. In 1932, not only did we see political change with Hitler coming to power precisely on the Pi Target, but FDR was also elected in the same year. Both sought a change in the economic trend that had been in motion—the Great Depression. Their motives may have been different, but the people responded the same, seeking political change.

Japan’s economy was hit hard by the global Depression, exacerbating social unrest and militarist sentiments. In May 1932, after the assassination of Prime Minister Tsuyoshi Inukai by naval officers amid economic and political instability, Admiral Makoto Saito was appointed as a compromise leader to stabilize the government. The Depression’s impact strengthened militarist factions, influencing Japan’s shift toward aggressive expansionism. Prime Minister Makoto Saito came to power in May 1932.  In September 1932, Saito’s government signed the Manchukuo Protocol, formally recognizing the Japanese puppet state of Manchukuo in Manchuria. This followed the Japanese invasion of Manchuria in 1931 (the Mukden Incident), which had been orchestrated by the Imperial Japanese Army without government approval.
Wheat 1919 1932 14 Year Decline

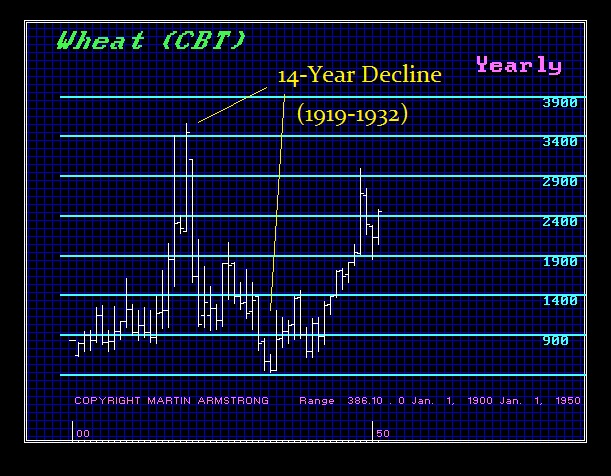
Here, we see a significant political change in 1932, which coincided with the economic collapse and decline in commodities, as well as the US stock market. The reason behind each leader may be different, but the common threat is political change.
Cycle War 3 Waves 1964 2039

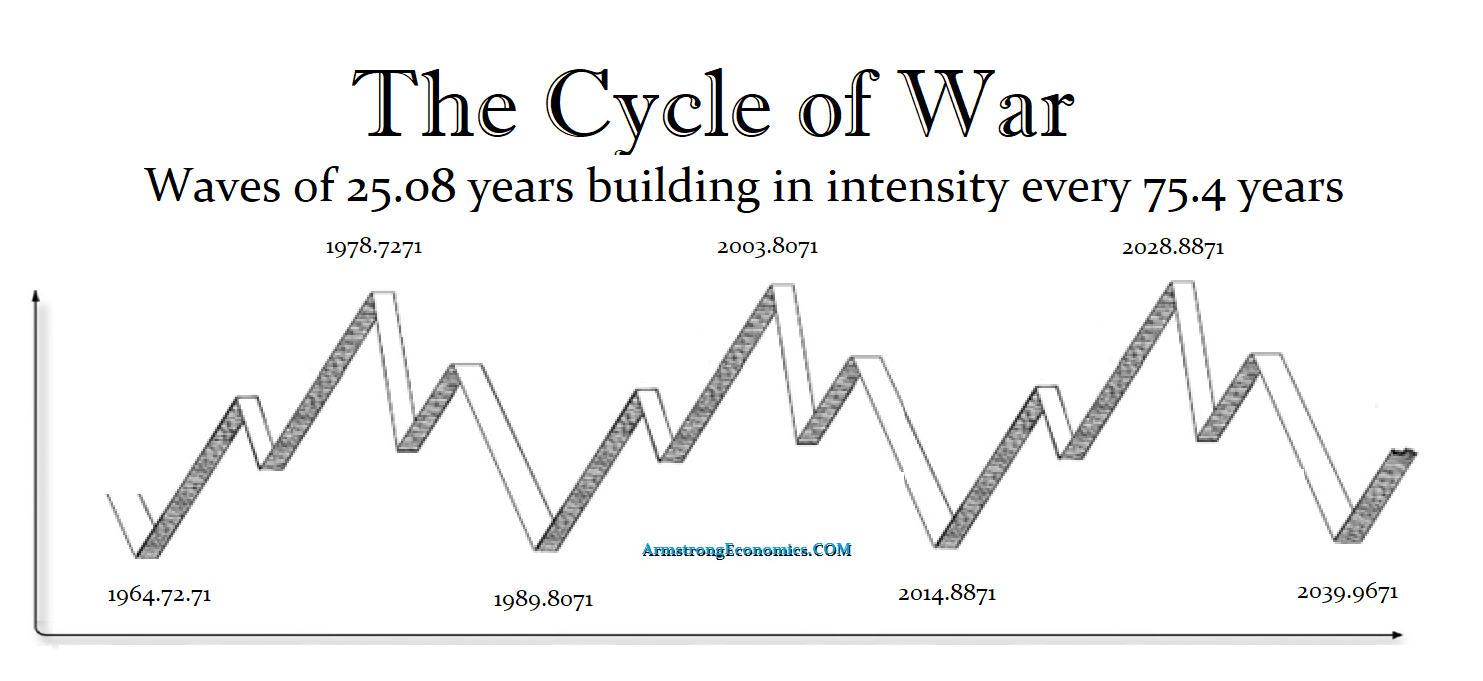
Separate from Socrates, the War Cycle builds in intensity as does the ECM. Here, the third wave, since the low of 1964 and the Tonkin Gulf Resolution of August 7th that year, brings us to a peak in 2028. When we look at the two forecasts of Socrates for 2026 for International War and 2028/2029 for Civil Unrest, and then look at this in the contaxt of the major Sixth Wave projecting to 2032 with the likelihood of the fall of our Republican forms of government worldwide, it appears the the World War III is just a prelude to the civil unrest that will ultimately bring down governments.

Cycle_of_War Revolution 2025

I am trying to merge these models into a coherent book that I hope will be out for the WEC in November. This is not an easy project. I am addressing the typical criticisms of those who refuse to believe in cycles and look at events as random and unpredictable. They are like a horse with blinders on pulling a carriage, unable to see anything other than what is directly in front of their nose. This will be the 40th Anniversary of our World Economic Conference. I seriously doubt I will make it to the 50th. So, it is time to pass on what I have learned before Scotty beams me up.
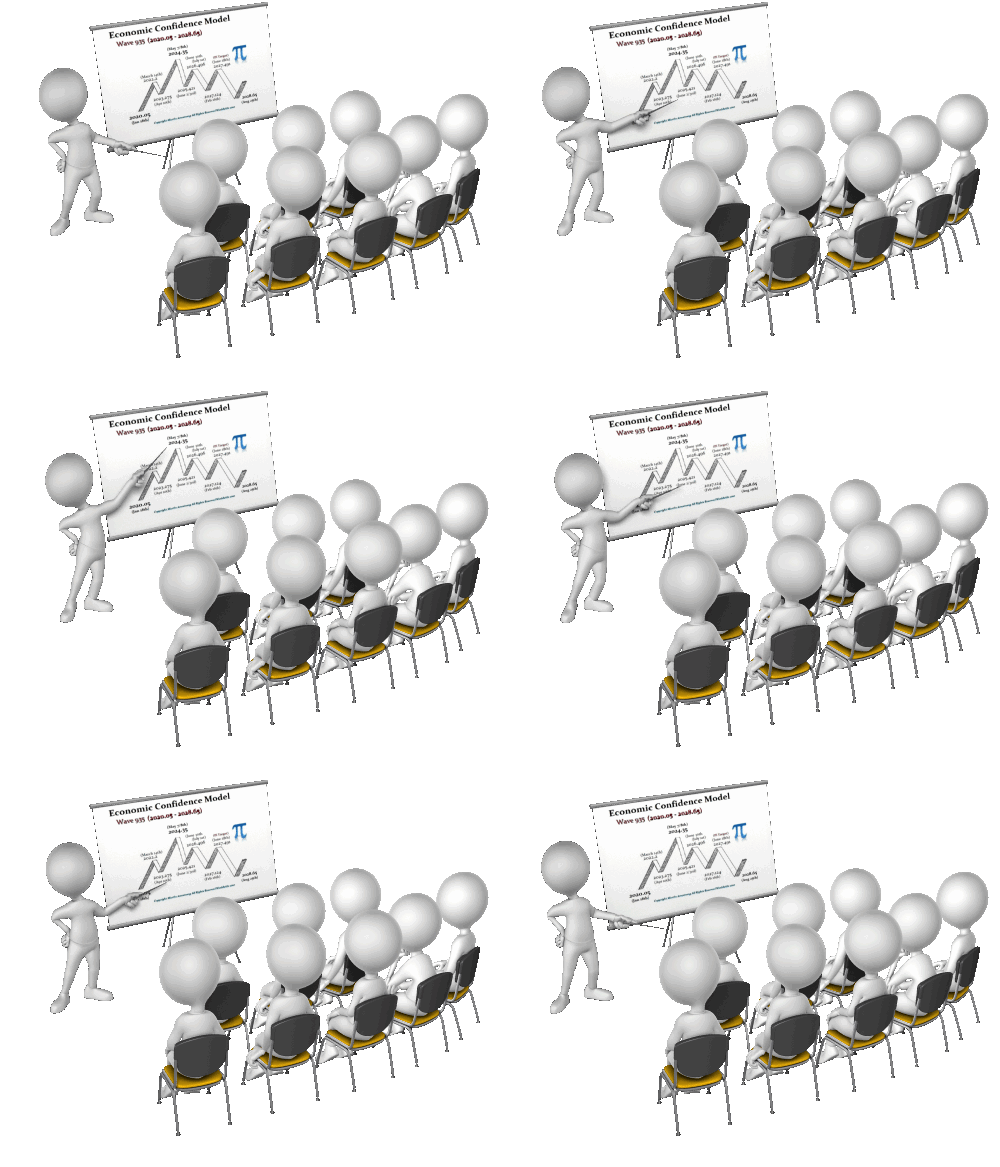
Teaching ECM

Categories:Wa

Interview: War and the Unseen Factors Driving Markets


Posted originally on Aug 31, 2025 by Martin Armstrong |  

Interview: Should Putin NUKE Ukraine?


Posted Aug 31, 2025 by Martin Armstrong |  

Categories: Armstrong in t

Interview: War and the Unseen Factors Driving Markets


Posted originally on Aug 31, 2025 by Martin Armstrong |  

Interview: Should Putin NUKE Ukraine?


Posted originally on Aug 31, 2025 by Martin Armstrong |  

Categories

AI is Getting Really Good


Posted originally on Aug 30, 2025 by Martin Armstrong |  

The Majority Must be Wrong


Posted originally on Aug 30, 2025 by Martin Armstrong |  

Why_The_Majorityy_Must_Be_Wrong WEC 2025

QUESTION: I asked GOK who thinks the stock market will crash. It gave a list of people all expecting a crash. It also noted that Buffet was bearish and J.P. Morgan was calling for a 20% drop. The reasons were “High valuations, particularly in tech and AI, are compared to historical bubbles (e.g., dot-com, railroads). Recession fears, driven by tariffs, high interest rates, and consumer debt, are seen as potential catalysts. Ongoing conflicts (e.g., Middle East, Russia-Ukraine) and trade policy shifts add volatility.”

It even said:

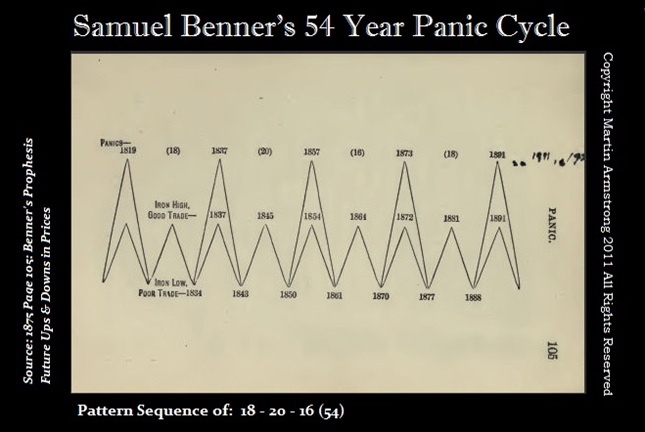
Samuel Benner’s Historical Chart (Referenced on Medium):

  • Prediction: A 150-year-old financial cycle chart by Samuel Benner, cited in a Medium article, has historically predicted major crashes, including the Great Depression, dot-com bust, and 2020 COVID crash. It suggests warning signs for a potential crash in 2025.”

You seem to be standing alone. What do you think about the Benner chart?

SY

Rogoff Davos Always Wrong

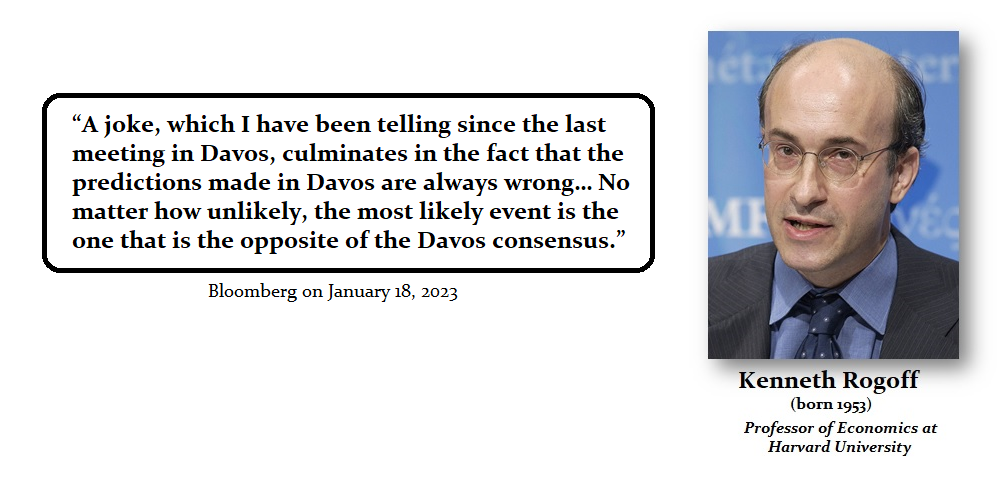
ANSWER: That’s good. The majority is always wrong. Just as Rogoff said, the forecasts at Davos are always wrong. Most of these people forecast markets based on personal opinion, and they tend to be very myopic. They do not look at the world because they believe they can forecast in isolation.

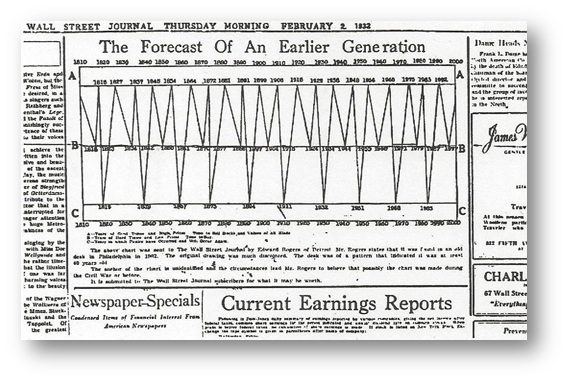
WSJ1933
Benner

The claim that Benner’s Cycle predicted the Great Depression is false. The chart that was published in the Wall Street Journal altered Samuel Benner’s cycle, which was based on agriculture. It predicted a high in 1927, not 1929, and the low in 1930, not 1932. Claims that Benner’s work calls for a crash in 2025 are flat-out wrong. His target years would be 2019 and 2035, based on his data, not the altered, fake news published by the WSJ in 1933.

Capital Flow Map 8 30 25

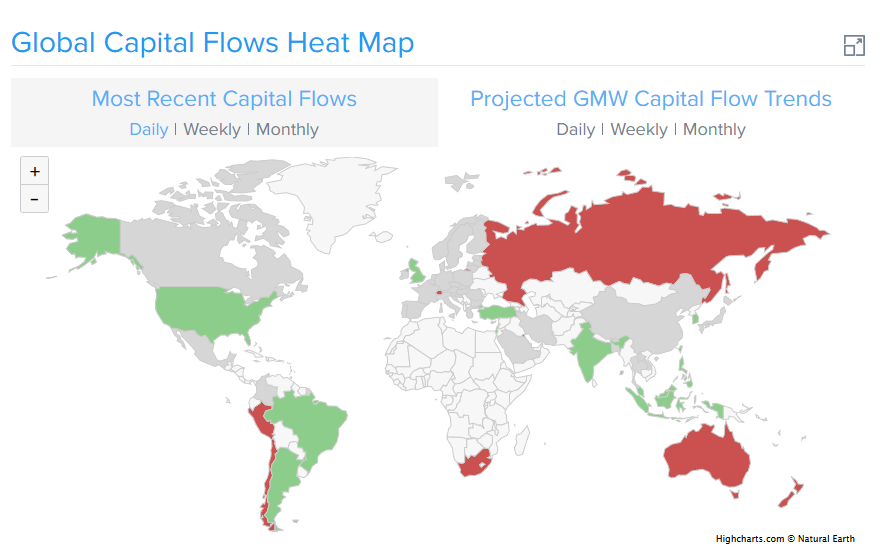
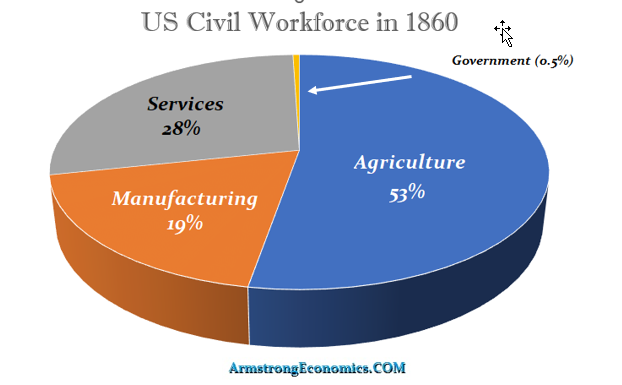
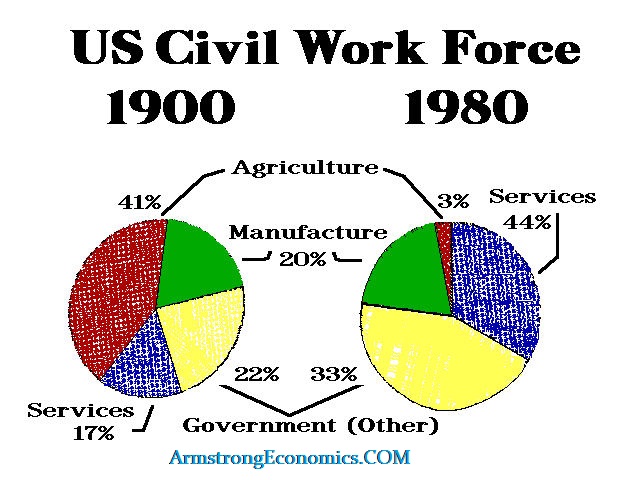
Benner was a farmer. Applying his cycle to the economy today is no longer effective, any more than the Kondratieff Wave. Both were based on the economy, with agriculture being the #1 sector. As the Industrial Revolution unfolded, those cycles remain relevant for commodities, but not the economy. Agriculture, when Benner developed his model, accounted for 53% of the economy. Today it is 3%. If they were alive today, they would have used the services industry. Capital flows are still pointing to the dollar, given the prospect of war and sovereign defaults outside the USA.

1860 Civil Workforce
Civil Work Force 1900 1980

Interview: Socrates — 300 Year Cycle of Unprecedented Change after Worldwide War


Posted originally on Aug 30, 2025 by Martin Armstrong |  

Categories:Armstrong in the Media

Interview: Prepare for World War III in 2026 (but with a TWIST)


Posted originally on Aug 30, 2025 by Martin Armstrong |  

Categories:Armstrong in the Media

Misleading Q2 US GDP Figure


Posted originally on Aug 29, 2025 by Martin Armstrong |  

GDP 3

The U.S. economy did post a headline-grabbing 3.3% gain in Q2, but that figure is misleading. It’s driven largely by the collapse in imports—not by true domestic growth. Remember the GDP formula: GDP = C + I + G + (X – M). A sharp drop in imports boosts that (X – M) term artificially, making GDP look better even while the underlying fundamentals stagnate.

Consumer spending rose only modestly at 1.6% and private domestic final sales rose 1.9%. They relay a lower estimate and then state the true figure, acting as if the figure should be celebrated. Meanwhile, business spending remained weak.

We’ve also noted that household debt surged by $185 billion in Q2, with rising mortgage, credit-card, auto-loan, and student-loan balances. Delinquency rates are up, and real incomes are under pressure. Consumers are treading in deep waters.

Imports tanked by 29.8% after nations began to panic buy last quarter ahead of tariffs. Exports declined 1.3%. The import volatility has inflated figures and does not mark sustainable economic growth. Investment into the US has also improved as capital has nowhere else to go, but again, the expansion is not enough for the long-term.

The economy contracted 0.5% in Q1, and the Commerce Department is reporting that the economy rose 3.3% in Q2, with growth averaging 2.1% or a bit above 1% per quarter. Stagflation is not simply high inflation with low growth. It is the direct result of government mismanagement. When politicians and central banks try to manipulate the economy, they destroy confidence. That is the fuel behind stagflation.