Understanding Rogue Waves


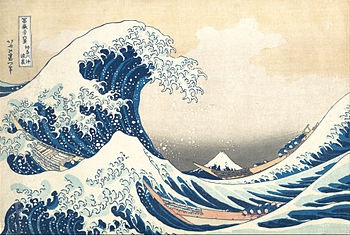
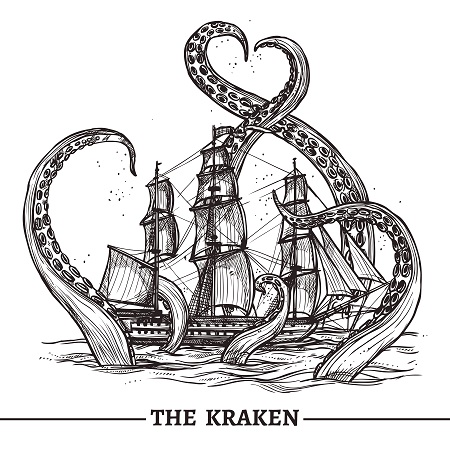
Over the centuries, sailors have told legends of monster waves that would appear out of nowhere in the middle of the open sea. Most scientists dismissed the stories as fabrications and legends. These stories were reported over the centuries by sailors who repeatedly saw these rogue waves of gigantic proportions rise up from nothing far above the surrounding waves in the middle of nowhere. In the 16th century when sailors began to venture past the Pillars of Hercules after Columbus, these stories began to commonly emerge. Many attributed them to the wake of some hidden sea monster. The ships that vanished were said to have been swallowed by these sea monsters they called the Kraken from Greek mythology.

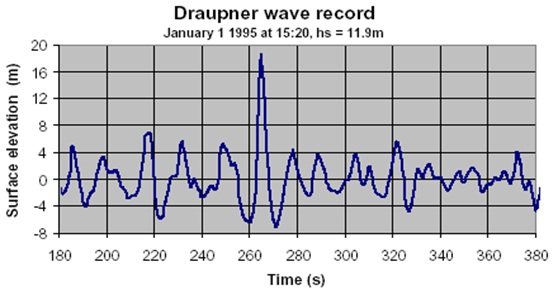
What was missing were any reliable measurements until New Year’s afternoon in 1995. On that day,  there were between ten to twelve-meter high storm waves and a wave of almost 83 feet (26 meters) high under the oil drilling platform named Draupner. This was the very first time one of these rogue waves was actually measured by the sensors on the platform. Since then, what was once dismissed as legend has entered the field of reality.

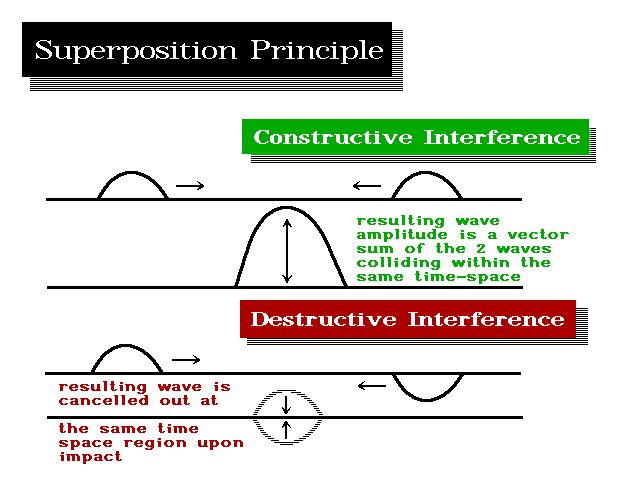
Hundreds of such monster waves have since been documented and they occur in different forms. For example, the convergence of waves in a nonlinear process can cause single superwaves to result from otherwise ordinary waves. I have found this stunning for scientists have been baffled by these rogue waves when in fact the same exact thing takes place is wave analysis of even the economy.

The Draupner wave was one of those mysterious lone superwaves that appeared to tower over all other waves. They are strikingly different from a tidal wave, which is when energy is passing through the wave until it hits shore. One of these superwaves appear out of nowhere, but they also vanish and disappear without a trace. This is what the scientists have failed to comprehend.


Since the Draupner wave discovery, finally, research has been taking place to try to understand these interesting wave formations. Essentially, a normal wave that hits the shoreline is produced by a wave of energy that flows through the water which is the medium. Those are quite distinct whereas a rogue wave is produced by the cycle of several waves that suddenly sync and produce a combined wave which is a singularity. If you look at something floating just off the beach, you will notice it rises and falls with the waves for it is not actually the water which is moving, rather it is the energy passing through the water. It is similar to what would occur if you received an electric shock; your flesh is not moving, it is the electricity passing through your flesh.

Essentially, everything in the universe is subject to cyclical theory. These rogue waves are no different from a market that suddenly erupts, crashes, and in the end, wipes out economies and investors. Politicians then respond with laws and investigations to try to blame the event on some human cause and effect.

Now, look at Bitcoin. The computer pinpointed the high in Bitcoin to the day. It understands these rogue waves, how they form, and how they will quickly vanish. We heard nothing but scenarios of the new age of knowledge and how Bitcoin would become the new reserve currency. So many people lost their shirt because they wanted to believe the hype and they ignored the reality of what takes place in a rogue wave.

Climate Change, Midwest Floods & Food Shortages


The Great Flood of 1927, flooded the lower Mississippi River valley in April 1927.  It was one of the worst natural disasters in American history. More than 23,000 square miles of land was submerged, hundreds of thousands of people were displaced, and around 250 people died. The flooding impacted areas in Arkansas, Illinois, Kentucky, Louisiana, Mississippi, Missouri, Tennessee, Texas, Oklahoma, and Kansas.

Following that Great Flood of 1927, we then see the climate swing dramatically in the opposite direction into the extreme drought that led to the Dust Bowl of the 1930s. The Dust Bowl was a period of severe dust storms that greatly damaged agriculture in the Midwest prairies during the 1930s. The Dust Bowl was a severe drought that came in three primary waves, 1934, 1936, and 1939–1940. The entire event actually complied with our Economic Confidence Model when many regions of the high plains experienced drought conditions for eight years.

Unfortunately, the global warming people are already out in force and blaming this on moms driving the kids to soccer matches. They always pretend these are catastrophic events never before seen. Cars were not really in wide use until post-1940s. They could care less about history or truth. The cycle is very clear. This major flooding which may destroy at least 6 billion bushels of wheat is a prelude to what is coming.

Long before there was the Global Warming crowd, there were the record-setting heat waves and drought of the 1930s that contributed to the Great Depression and wiping out agriculture that was employing 40% of the civil workforce at the start of the century. There were runs of extreme temperatures which broke all records. There was a stretch of 11 days straight in July with temperatures over 100. The two worst years were 1930 and 1936.

Today, they would be demanding action and 11 days over 100 degrees Al Gore would be yelling this proves he is right. Of course, back then, there were no fleets of cars to blame no less soccer moms.

This is all part of the cycle. We have extreme floods now, then swings of heat during the summer to create droughts, then the climate turns down and progressively moves into a colder pattern.


Aurora Borealis Warning the Climate May Turn Sharply Colder into 2032


There may actually be a confirmation that we are heading into a much colder climate. The Aurora Borealis, also known as the Northern Lights, can now be seen in the UK. Normally, the Northern Lights can be seen only extremely north as in Alaska. Sir Edmund Halley (1656 – 1742), the man who discovered Halley’s Comet, was a friend of Isaac Newton. He was asked to speak about the unusual events that were taking place in the sky. He addressed the British Royal Society, stating:

The Royal Society, having received accounts from very many parts of Great Britain, of the unusual lights which have of late appeared in the heavens ; were pleased to signify their desires to me, that I should draw up a general resation (sic) of the fact, and explain more at large some conceptions of mine I had proposed to them about it, as seeming to some of them to render a tollerable [sic] solution of the very strange and surprizing [sic] phænomena thereof.

During the period of Halley’s investigation, the Little Ice Age dominated the decades and it bottomed around 1680. The Aurora Borealis actually expands and moves further south during periods of a colder climate. The Northern Lights being visible in the UK is not a good sign for climate change. This may be warning that we are headed back to a prolonged colder climate. Solar cycle 14 had the record high for sunspots during February in 1906. The annual peak took place in 1957 with 190 sunspots taking place that year. Based upon our models, the ideal low was most likely 1686/1687. From the 1957 high, the collapse to just 10 sunspots per year took place in 1964 — 7 years later.

Just before the Mini Ice Age, sunspot activity peaked during 1787 at 132 (mean) and crashed for 11 years into 1798, dropping to just 4 sunspots. If we continue to witness this declining trend from the 2000 high where there are virtually no sunspots, we appear to be vulnerable to a significant decline at least into 2032.

Climate Change: Real – Fake – Exaggerated?


QUESTION: I find it interesting that you are against human-induced global warming yet you confirm that climate change is natural. You seem to be in the middle of these arguments. You warned that solar activity was declining and there was a risk of going into a mini ice-age, but you did not seem to place high odds on that one. So can you elaborate on this since you seem to be the voice of reason?

GR

ANSWER: Sunspot activity has declined on schedule. February was an incredible month void of sunspots. This is clearly contributing to the extremely cold weather we are having. Cyclically, between 1645 and 1715, there was a prolonged collapse in sunspot activity known as the Maunder Minimum. Indeed, that was a period where sunspots all but disappeared. This coincided with the “Little Ice Age,” which was a period from 1500 to 1850 in the northern hemisphere. It was so cold, Viking settlers even abandoned Greenland.

I have stated many times that a major error in analysis is the attempt to reduce a problem to a single cause and effect. This topic of climate change is no different. Many scientists have strongly suggested that the Maunder Minimum caused the Little Ice Age. As I have shown, correlating everything that took place revealed that during solar minimum there is also an increase in volcanic activity and earthquakes.

You will read that scientists seem to be debating between the two rather than comprehending that EVERYTHING is absolutely connected. We cannot reduce everything to a single cause and effect. Therefore, in order for me to confirm that we are heading into a new ice age requires more volcanic activity in addition to a prolonged solar minimum.

The sunspot cycle is also called the Schwabe cycle, and currently we are moving toward the end of cycle 24. It does appear using long-term cycle analysis that cycle 25 will probably be at the very least a quieter cycle than we are concluding here with cycle 24. There’s been this steady decline, so we are indeed heading into what could be a prolonged solar minimum.

There have been several protracted solar minimums since 1000 AD:

  1. Oort minimum (1040–1080 AD)
  2. Medieval Minor minimum (1150–1200 AD)
  3. Wolf minimum (1270–1350 AD)
  4. Spörer minimum (1430–1520 AD)
  5. Maunder minimum (1620–1710 AD)
  6.  Dalton minimum (1787–1843)

This post-Dalton minimum peaked strangely with the Economic Confidence Model on 1989.95. The peaks in solar activity have been declining with each wave subsequent to that turning point. It is now declining faster than ever previously know for nearly the last 10,000 years. Pretend scientists claim climate change it due to human activity. They were predisposed to arrive at that conclusion and not offer legitimate analysis whatsoever. Society expands during warming cycles and contracts during periods of global cooling.

I have also warned that if next year is colder than the 2018/2019 winter, and if this summer ends up with an expansion of drought, then besides keeping an extra supply of canned goods, the short-term cycle would warn of a further cold period into 2024/2025. The problem here is that if governments can blame humans, then they can tax us. When something is natural, there is no one to tax or blame except Acts of God. So YES, there is always climate change, but humans do not create it. There is far more complexity to this than a single cause and effect. REAL analysis cannot take place when the objective is always to reduce it to a single cause and effect.

India v Pakistan & the 2019/2020 Turning Point


The last time that Indian and Pakistan were at war was back in 1971. Our War Model turned up in 1964 and indeed it marked the beginning of the US Vietnam War. In reality, the separation or the partition of India took place in 1947 based upon religion. The British created two independent dominions, India and Pakistan. India became the Republic of India in 1950, and in 1957 the Dominion of Pakistan became the Islamic Republic of Pakistan. In 1971, the People’s Republic of Bangladesh came into being. On March 25, 1971, there was also the Bangladesh War of Independence against Pakistan. Bangladesh was a Sunni Muslim state as was the case with Pakistan.  The partition involved the division of three provinces — Assam, Bengal, and Punjab — based on separating Hindus from Muslim majorities.

Ironically, here we are at the 72-year mark from 1947 which equals 2019. This is PRECISELY on target for a confrontation. Back in 1971, neither side possessed nuclear weapons as both do today. Indian warplanes began bombing inside Pakistan’s on February 26, which was really the culmination of the most serious confrontation South Asia has seen in a long time.

The origins of India’s air raid can be traced to a suicide bombing on February 14th in the Pulwama district of the state of Jammu & Kashmir that killed 40 Indian policemen. That was by far the deadliest attack and the worst jihadist assault to date. Prime Minister Narendra Modi faces reelection. The Hindu hardliners argue he has been weak and thus the attacks are clearly because of the upcoming elections. Then there are those who believe his attempt to modernize India to bring jobs to his countrymen has also failed. Modi is in a place where personal power depends upon him appearing strong. Unfortunately, this is precisely on target for 2019 after 72 years.

Even the volatility model of the Economic Confidence Model component is 6 years. Where the 8.6-year wave builds into waves of 51.6 years, due to turn in January 2020, the major volatility wave coincides here as well — 72 years from 1947. It was also 1947 when the International Monetary Fund began. It was also 1947 when the Marshall Plan came into force.

Ironically, 2019-2020 is a very formidable turning point both in conflicts and war/civil unre

When is Forecasting Not Forecasting?


QUESTION: There are a number of people who claim to have called the 2008 crash. What I find absent is that there is no one who brags on calling the rallies and crashes as you have and I have witnessed from going to your WECs since 1985. I still remember you in 1985 standing up and showing us all the projections of so many economic indicators all point to the moon for the next 51.6 years. Your call on the Dow going from 1,000 to 6,000 was an eye-opener back then and to watch it unfold was unbelievable. Then at the bottom in 2009 you called for new record highs. I read Barrons even wrote on that as if it was just a foolish comment. That happened exactly the same way when you stood up at the 1987 WEC and said the same thing.

My question is this. I recently read where a value investor from Boston claimed that the stock market would produce 2% to 3% for the next 20 years not 6% to 8%. He claimed to have called the 2000 and 2008 crash. Why do these people only claim to forecast the crash and not the rally?

Your life long subscriber who has grown old with you in this journey for knowledge as you put it.

PG

ANSWER: Good to hear from you. Yes, it has been a long time. I believe your answer lies in the fact that so many analysts are focused on 1929 and constantly view the market in that light. Even Germany and its austerity policy that has devastated Europe is fixed on the hyperinflation of the 1920s. In both cases, they failed to ever do the research to comprehend the real reasons behind the events of the 1920s and 1930s. So you will always find people claiming to predict every crash. There is an absence of those who forecast rallies. This is the result of the very same reason. They are all focused only on the events of 1929. You even have the Goldbugs constantly telling people everything will collapse and only gold will rally based upon their understanding of the 1930s which again is completely wrong.

If you are going to forecast any market, you have to be UNBIASED and willing to forecast the rally and the decline or else it is not forecasting. All the pretend gold analysts who only constantly forecast rising prices are really preaching, not forecasting, and they typically have skin in the game and will never say down when they own gold or mining stakes. When I was called by the Brady Commission for the Crash of 1987, the investigation showed that the theory that computer trading caused the crash was proven wrong because most people did not follow the computers and unplugged them because they did not believe in them.


All you have to do is look at our Energy Models. They track the strength and weakness of a market and show you when the energy in a market is declining even though you may not see that in a chart pattern. Likewise, the energy was immediately making new record highs coming out of the major low.

You must also understand that the press needs content. They have their stable of people to put on and they prefer to show a consistent prediction. They do not want to put me on the air as I contradict everything they are putting out there. This immediate rally has been the most hated bull market in history. Every high there was someone forecasting the crash of all time. Even Goldman Sachs told everyone to sell 2019. Granted, at the Orlando WEC I stood up and said the market would make a correction and we should drop to retest the Monthly Bearish. We dropped to 21712 when the target was 21600.

But we have to look at this UNBIASED from every angle. You cannot forecast from a personal opinion perspective. I find it really funny when someone tries to argue against me and offers some logical fundamental, reducing everything to a single cause and effect. They fail to understand I am NOTmaking forecasts on what I “think” or my “opinion” personally I have been wrong and the model proves to always win if I dared to try to compete.

I suppose when you are always forecasting every high as the big one, then you can claim to call the crash. But nobody asks how many highs before then did they say the same thing. Markets are like the two sides to a coin. If you cannot forecast the rally and the decline, then you are not really forecasting

50 to 1 Project – Marc Morano Interview


Published on Aug 29, 2013

SUBSCRIBE 3.8K
http://www.50to1.net – Topher interviews Marc Morano, accused ‘criminal against humanity’ and alleged ‘central cell of the climate denial machine’ and gets an insiders look into the politics and collateral damage caused by clumsy political responses to fears about climate change.


Lord Christopher Monckton – The Economics Behind Windmills


Published on Feb 5, 2018

SUBSCRIBE 21K
Lord Christopher Monckton joins us on stage for a quick talk to discuss the economics behind windmills and the problems behind them.


Dan Britt – Orbits and Ice Ages: The History of Climate


Published on Feb 8, 2012

SUBSCRIBE 33K
Another lecture in IHMC’s award winning lecture series. http://www.ihmc.us Climate change has become a major political issue, but few understand how climate has changed in the past and the forces that drive climate. Most people don’t know that fifty million years ago there were breadfruit trees and crocodiles on the shores of the Arctic Ocean, or that 18,000 years ago there was a mile-thick glacier on Manhattan and a continuous belt of winter sea ice extending south to Cape Hatteras. The History of Climate provides context of our current climate debate and fundamental insight how the climate works. Dr. Daniel Britt is a Professor of Astronomy and Planetary Sciences at the Department of Physics, University of Central Florida. He was educated at the University of Washington and Brown University, receiving a Ph.D. from Brown in 1991. He has had a varied career including service in the US Air Force as an ICBM missile launch officer and an economist for Boeing before going into planetary sciences. He has served on the science teams of two NASA missions, Mars Pathfinder and Deep Space 1. He was the project manager for the camera on Mars Pathfinder and has built hardware for all the NASA Mars landers. Britt currently does research on the physical properties and mineralogy of asteroids, comets, the Moon, and Mars under several NASA grants. Honors include 5 NASA Achievement Awards, election as a Fellow of the Meteoritical Society, and an asteroid named after him; 4395 Dan Britt. He is currently President of the Division for Planetary Sciences of the American Astronomical Society. He lives in Orlando with his wife Judith. They have two sons, ages 16 and 21.

Food Riots of 1795 Due to Climate Change


The British had a long tradition of striking tokens for political purposes. There was Climate Change back then as well and it resulted in massive riots over shortages of food. The British also even issued a protest Bank of England note that stated the mere possession of a counterfeit was punishable by death. The protest was people who unknowingly accepted a bank note that was counterfeit were being routinely hanged, but the law also meant that all their assets were then forfeited to the Crown and any family was thrown out on the street. Therefore, there has been a wealth of private tokens issued by the British to record various political issues over the centuries.

On February 1st, 1796, the weather had turned bitterly cold and crops had been failing. There were food riots emerging over the price of bread which culminated in in an assault upon King George III and Queen. In fact, Queen Charlotte was struck by a stone as she and King George return from a trip to the theatre.

It was during the extremely cold winter of 1794-1795 where even the Thames River froze over and temperatures reached -6 (21c). A deep freeze began on December 20th, 1794, and continued until February 7th, 1795. Even when the thaw came, this resulted in major flooding of the rivers which devastated the surrounding farmlands. The weather resulted in a great famine.

According to the Geast chronicler, the government had to act providing the poor a public subscription that provided bread and coal to be sold at a subsidized price. In some exceptional cases, it was provided free only when it was obvious the people could not pay. The number of deaths between 1794 and 1795 more than doubled because of the weather and crop failures. The death records of this period show that as food became scarce, disease spreads. About one-third of the deaths are attributed to disease rather than just hunger. Clearly, when there is malnutrition, diseases such as Small Pox spread rapidly.

Nevertheless, as spring and summer arrived during 1795, it never really warmed up very much. There were recorded frosts well into June of 1795. Countless animals also died from the bitter cold as the grounds froze and nothing grew. The wheat harvest of 1794 had been very poor, for the summer showed extreme volatility in temperature. As we see today, the summer of 1794 was very hot and dry resulting in crop failures during that season due to the lack of rain. Today, they would call this proof of Global Warming when in fact historical records reveal such extreme swings between heat and cold are not modern events.

The prices of all agricultural and livestock products rose dramatically.  Then, the extreme cold and floods of the following winter affected crop production and prevented farmers from undertaking fieldwork. The bad weather during the spring of 1795 was also detrimental to agricultural production. A sack of flour costing £2.4s. [£2.20] in 1794 cost £4.3s. [£4.15] in 1795. Food prices soared because of the weather.

Our models are warning that we DO NOTface Global Warming, but these same dramatic swings in temperature with colder winters and dryer summers. TIME Magazine on March 4th, 2019, ran a piece on the Australian drought and attributed it, of course, to human-caused climate change. The exact same patterns of the 1790s demonstrate that this is a natural cycle, not unknown to history, and it must be understood what is really happening or millions of people will die waiting to people to end airfare and stop driving their cars and politicians to find someone else to tax.

Great Britain had been at war with Revolutionary France since 1793, therefore much of the wheat that was produced was bought by the government to supply the army and navy. Moreover, the war at that time prevented the importation of grain into Britain by ship for they would be attacked in the war. This combination of war and weather brought the country to the brink of famine and food riots. By the summer of 1795, the price of bread had doubled at around 1s [5p] for a 4lb loaf. The weekly wage of a skilled worker was around 10s [50p] per week. The lower skilled laborers were paid as little as 5s per week. We can see that bread at 1s could be 20% of the weekly wage.

As prices soared, millers would hoard grain in anticipation of continually rising prices. Why sell now when you could get more next week? We see the same thing take place during storms. Prices soar and even things like air tickets and gasoline rise in front of a hurricane. This is human nature. It always takes place despite laws against price gouging in a crisis.

During 1795 and 1796, the shortages, high prices, and profiteering practices all combined to produce food riots throughout the country. There was a riot involving about 200 people that erupted in Tewkesbury, England, on Tuesday, June 24th, 1795. Flour was waiting at Tewkesbury Quay to be transported by water to Birmingham where prices were even higher. On the following day, Henry Fowke, the Town Clerk of Tewkesbury, wrote to the Home Secretary, Lord Portland, reporting the event.

My Lord

I do myself the Honour of addressing Your Grace on the subject of extreme Rioting at this place yesterday. Several Quantities of Wheaten Flour were forcibly taken out of the Barges at the Quay & carried off by divers Persons, chiefly Females – The civil force was convened with all possible Dispatch, & after much difficulty & confusion, the Riot was suppressed, & the ringleaders committed to the county rather than the Borough Goal, as more secure – The appearance of the Town this morning, I have the pleasure to say, is pacific. I have thought it my Duty to acquaint Government, through Your Grace, of this transaction. With the greatest respect, I am My Lord, Your Grace’s most obedient servant

Henry Fowke
Town Clerk of the Borough of Tewkesbury
Tewkesbury 25th June 1795

(Home Office: Domestic Correspondence, George III (Letters & Papers), National Archives HO 42/35 (online).)

Many people were arrested and the government feared there would be yet another riot in an attempt to free them from prison many of whom were women. As a response, the government transported the prisoners to Gloucester. Many of those detained women and the city’s gaol register records the details of the charges and names four of the prisoners. They were charged effectively as terrorists. They were charged with inflicting the terror of his Majesty’s subjects and in breach of the peace. They would remain in prison until trial in late July. Many were able to carry off sacks of flour which had been the property of a James Lamb who was presumably the buyer in Birmingham rather than the seller in Tewkesbury.

As is said, starve a man and the most honest soul will become a thief.