Posted originally on the conservative tree house on April 15, 2022 | Sundance
Energy development companies had identified 744,000 acres of federal land which could yield significant returns for oil and gas extraction. Today the Bureau of Land Management (BLM) authorized leases for 173 parcels on 144,000 acres; approximately 80% less than was identified by energy companies. [BLM Press Release Here]
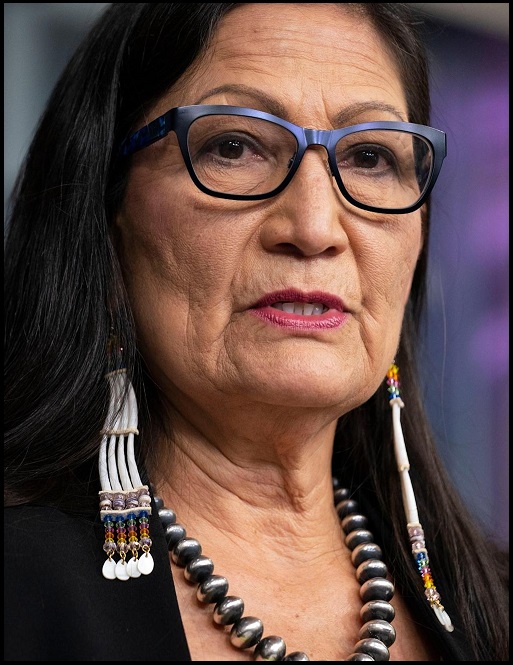
Dept of Interior Secretary Deb Haaland (pictured left) shared, “today, we begin to reset how and what we consider to be the highest and best use of Americans’ resources for the benefit of all current and future generations.”
The Biden administration, together with tribal leadership are concerned about environmental justice and sustainable energy equity for a host of multigenerational shareholder elements within the limited areas under consideration.
As the press release notes, “this pragmatic approach focuses leasing on parcels near existing development and infrastructure, such as gathering lines that can help reduce venting and flaring, and will help conserve the resilience of intact public lands and functioning ecosystems.
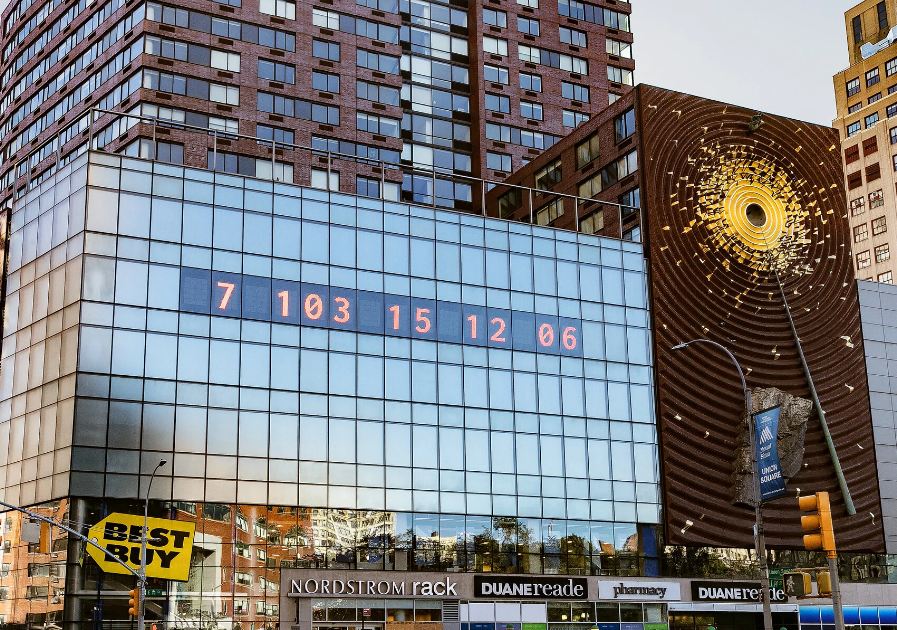
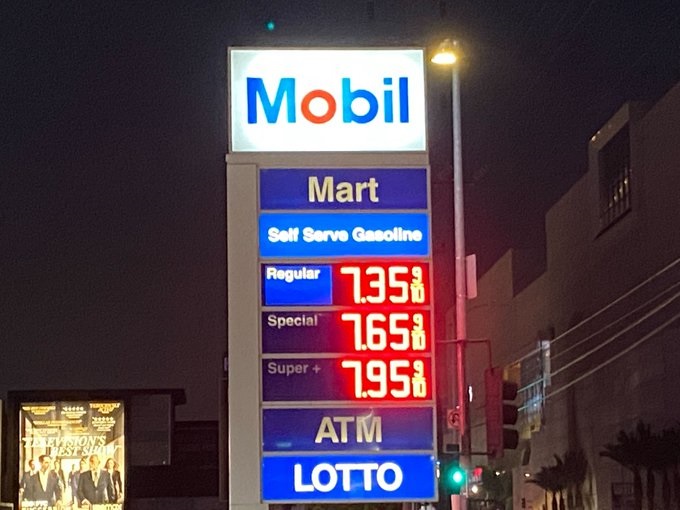
The new leases are mostly for areas where already existing oil and gas exploration is taking place, and the Biden administration has raised the federal royalty charges from 12.5% to a new 18.75%. In order to keep upward pressure on gasoline prices, Green New Deal national target price $7/gal, the new leases will not be available until later this year.
Great Sneezing Feathers, together with Strong Pine Fish and the progressive clan of the Algae and Whiskey tribe, will watch carefully as the colonizing white man puts hole in ground to feed metal people wagons.
Posted originally on the conservative tree house April 13, 2022 | Sundance
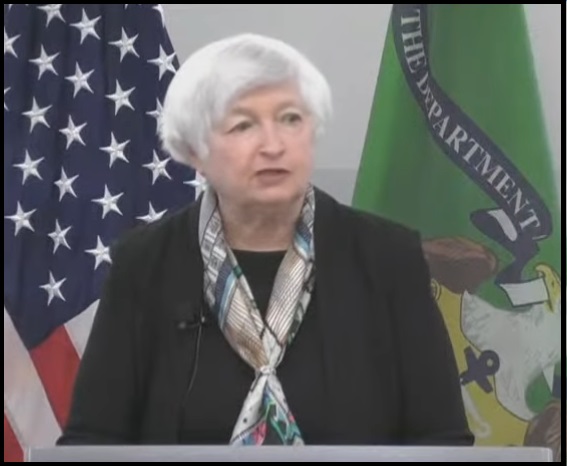
Treasury Secretary Janet Yellen delivered a remarkable speech today outlining “the future of the international order,” in the aftermath of the global pandemic and the current conflict in Ukraine. Within the speech, Yellen outlines the priorities of the United States according to the current administration and the international financial mechanisms that she controls.
The speech is quite jaw-dropping when you consider the nature of her position, and the fact that she is an unelected bureaucrat within government.
As you read the speech {Transcript Here}, keep in mind she is not the President of the United States, or the commissioner of the New World Order, yet she presents herself as authorized to control the geopolitical constructs of the Biden administration. The hubris is astounding.
Secretary Yellen: outlines the goals and objectives of the international order, predicts a concerning global famine, warns against the cleaving of financial mechanisms for international trade as an outcome of the Ukraine conflict, threatens any nation who does not support the western political alliance and outlines the need for decarbonization of the global economy.
Yellen expresses all of these powers from the position of a U.S. Treasury Secretary – the equivalent of a government financial minister. Speech highlights with emphasis mine:
(Transcript) – […] “Russia’s horrific conduct has violated international law, including core tenets of the UN Charter—challenging countries to demonstrate where they stand with respect to the international order that has been built since World War II. Therefore, when I speak about a changed global outlook, I’m not just talking about growth forecasts. I’m also referring to our conception of international cooperation going forward.
I will focus my remarks today on the significance of international cooperation in this current environment and for our future.
[…] With Attorney General Garland, I convened a novel taskforce of law enforcement and finance ministry leaders from G7 and partner countries to advance our efforts. […] Rest assured, until Putin ends his heinous war of choice, the Biden Administration will work with our partners to push Russia further towards economic, financial, and strategic isolation.
[…] When Russia made the decision to invade Ukraine, it predestined an exit from the global financial system. Russian leaders knew that we would impose severe sanctions. […] We are now seeing higher commodity prices that have added to global inflationary pressures and are posing threats to energy and food security, trade flows, and external balances across many countries.
[…] The ultimate outcome for the global economy of course depends on the path of the war. Russia could end this unnecessary war and the near-term impact could be contained.
[…] While many countries have taken a unified stand against Russia’s actions and many companies have quickly and voluntarily severed business relationships with Russia, some countries and companies have not. Let me now say a few words to those countries who are currently sitting on the fence, perhaps seeing an opportunity to gain by preserving their relationship with Russia and backfilling the void left by others. Such motivations are short-sighted. The future of our international order, both for peaceful security and economic prosperity, is at stake.
[…] The Russian invasion of Ukraine has dramatically demonstrated the need for us to stand together to defend our international order and protect the peace and prosperity that it has conferred on advanced and developing countries alike. […] On some issues, like trade and competitiveness, this will involve bringing together partners that are committed to a set of core values and principles.
[…] we need to modernize the multilateral approach we have used to build trade integration.
[…] we should implement last year’s global tax deal. Some 137 countries—representing nearly 95 percent of the world’s GDP—have agreed to rewrite the international tax rules to impose a global minimum tax on corporate foreign earnings and to partially reallocate taxing rights from countries where companies are headquartered to those where they sell goods and services.
[…] the economic and financial response to the global financial crisis in 2008-2009 was too timid and short-lived. With inadequate global liquidity, the crisis caused lasting damage. In response to the pandemic, the IMF acted creatively to support poorer countries. […] Experts put the funding needs in the trillions, and we have so far been working in billions. The irony of the situation is that while the world has been awash in savings—so much so that real interest rates have been falling for several decades—we have not been able to find the capital needed for investments in education, healthcare, and infrastructure.
[…] We know we have not yet done enough in terms of mitigation, adaptation, green technology innovation and adoption, and funding for those efforts. […] We must redouble our efforts to decarbonize our economies, recognizing that countries will use a range of tools—including carbon pricing, regulation, and subsidies—to achieve needed emissions reductions. Because those approaches will have quite different consequences for the costs of production, we will see differing impacts on trade competitiveness. We will need to work together to avoid trade tensions and in time to coordinate and harmonize our approaches.
[…] Some may say that now is not the right time to think big. Indeed, we are in the middle of Russia’s war in Ukraine, alongside the lingering fight against a global pandemic and a long list of other initiatives underway. Yet, I see this as the right the time to work to address the gaps in our international financial system that we are witnessing in real time. […] we ought not wait for a new normal. We should begin to shape a better future today.” {Read Full Transcript}
Think carefully about what you just read, and then remember the previous warning:
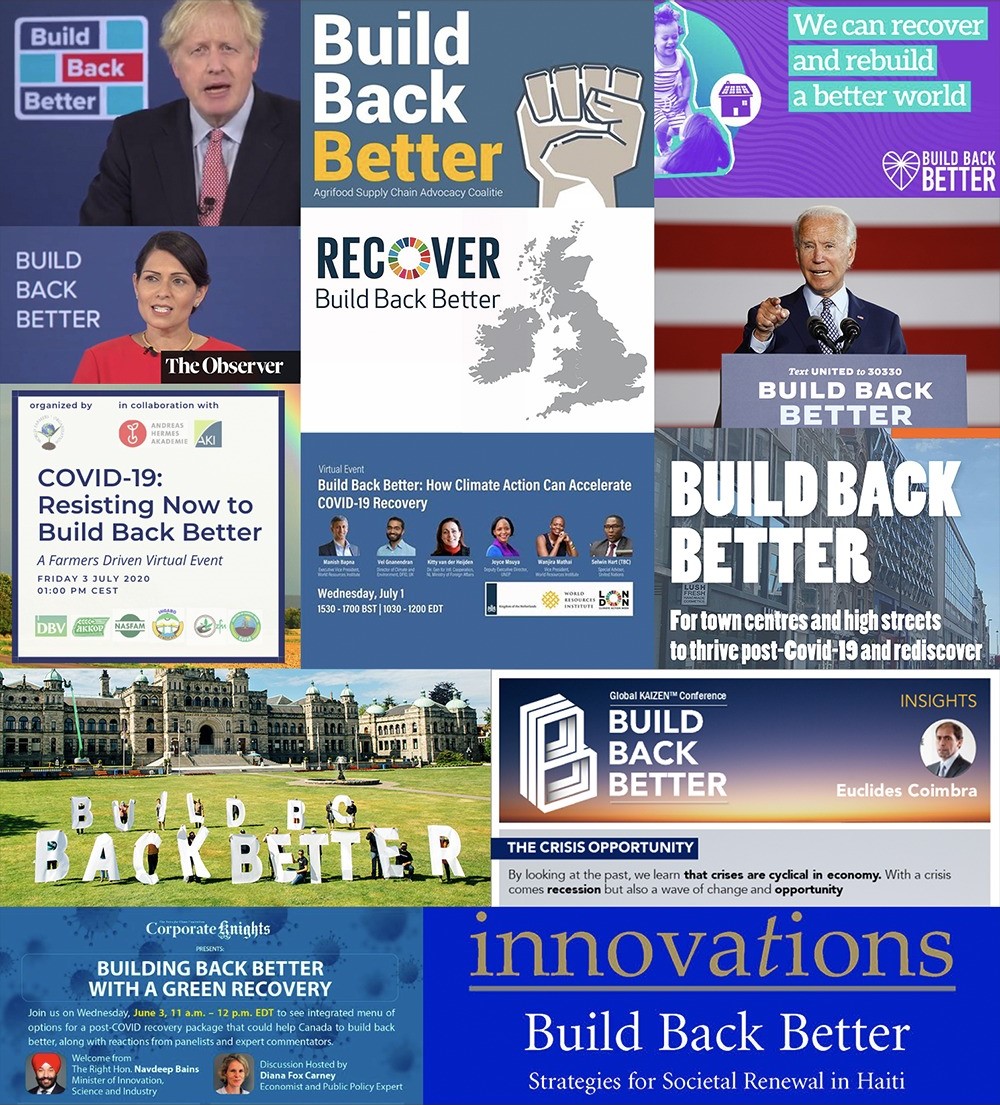
[CTH March 23, 2022] A Build Back Better society, or “great reset”, is factually underway as triggered by the gateway of SARS-CoV-2 and the massive spending by western nations to subsidize the lockdowns, shut-downs, economic closures and forced unemployment.
Global inflation is being driven not only by the American spending spree, but also by the massive government spending programs of the EU, U.K, New Zealand, Australia, Canada and many western nations.
The bills for those subsidies and bailouts are due. The labor of the citizens is going to have to pay those bills, while simultaneously we deal with inflation and massive debt balances on all nations’ balance sheets.
Into this mix comes the very real possibility of a declining U.S. trade dollar, as a result of geopolitical conflict between the west and Russia, China, Iran and OPEC in the geography of Ukraine. The financial sanctions by NATO and western allies have factually created a rift in currency exchange valuations.
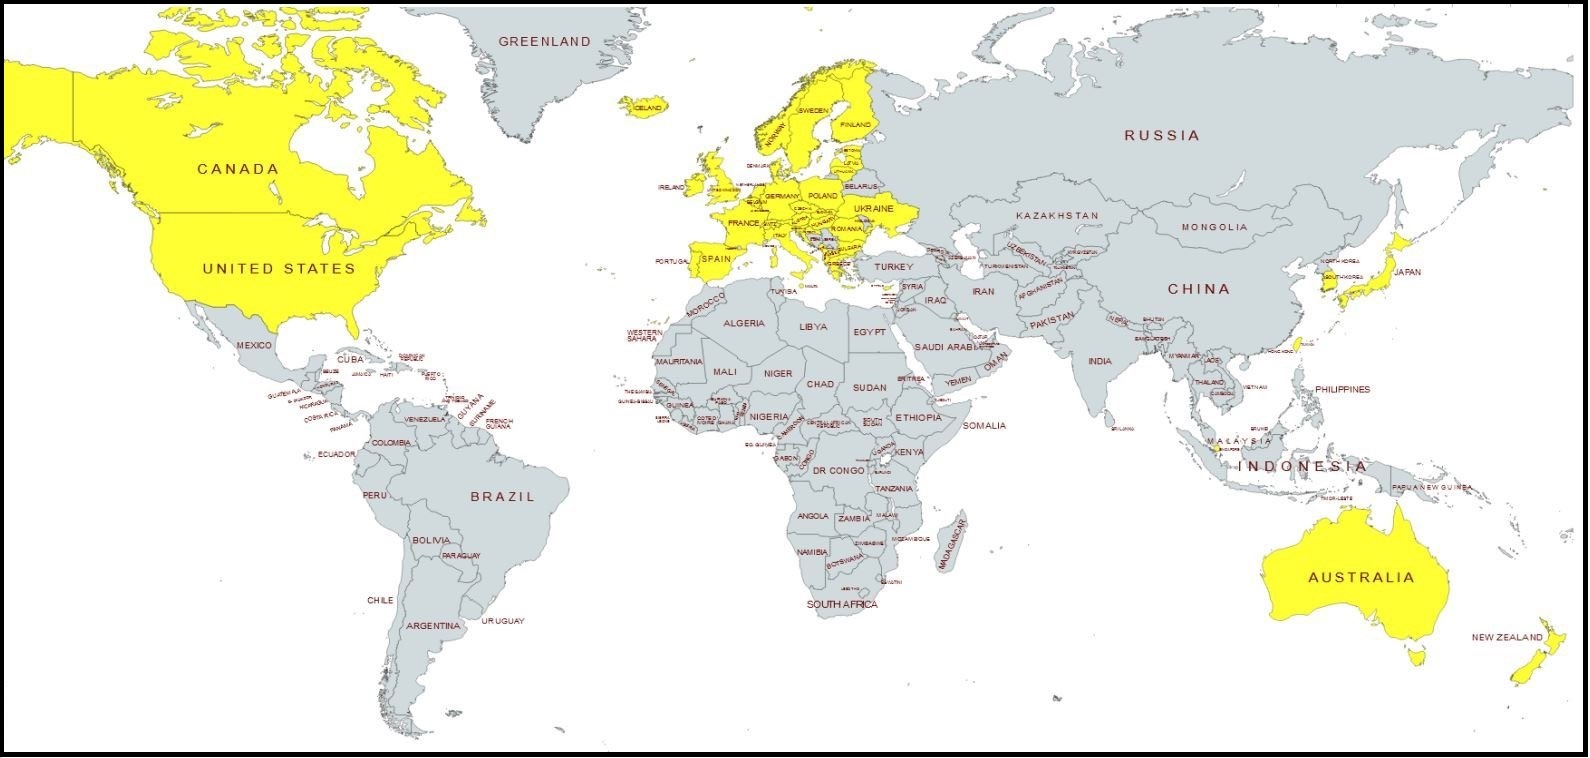
As the proverbial west hammers those sanctions even harder and more deliberately, what they are doing is creating a stronger and greater likelihood that the dollar will be removed as the global trade currency, and we will enter a phase where two sets of nations exist:
One set of nations will run their economy on oil, gas and fossil fuels. The other set of nations will be focused on running their economic engine on the premise of sustainability, or renewable energy.
The sanctions toward Russia actually help to drive this chasm even wider.
To me, this looks entirely purposeful – done by specific intent and design.
Two world groupings. One group, oil-based energy (traditional) – let’s label them the RED GROUP; and one group GREEN energy (the build back better plan). It is not accidental these two groups hold similar internal geopolitical views and perspectives.
♦ The important part to see is… there are going to be two sets of nations with two structurally different economies. A red group and a green group.
What Treasury Secretary Janet Yellen outlines in that speech is the geopolitics of this exact cleaving. Also worth noting, We The People represent the carbon she seeks to eliminate.
QUESTION: Dear Martin, After reading many of your blog posts, there appears to be one question you might not have answered. Do the elitists who are trying to control the world truly believe climate change cycles are not natural, but instead are caused by humans? It would seem that any climate theory that doesn’t explain the coming and going of ice ages which our history books told us happened, is an incomplete theory.
H
ANSWER: I think anyone with 10% of a brain can’t believe this climate change is caused by CO2. The climate has always changed and they use data that starts only in 1850 to argue this is all fossil fuels. CO2 is also generated by burning wood and the pollution from diesel and wood is the type that you feel. I lived in London during the 1980s and the buses were all diesel. You had to hold your breath when walking by.
The first clean air act was passed in 535AD by Emperor Justinian I who proclaimed the importance of clean air as a birthright. “By the law of nature these things are common to mankind—the air, running water, the sea.”
People are easily manipulated and those with a fully functioning brain are horrified by the stupidity of people who were told to hate Trump who now refuses to admit that Biden is a disaster because they would be compelled to acknowledge their own malleability to those who still wear masks even driving alone and rushed out to get every vaccine and booster possible. Now they are all about freedom, democracy, and anti-Russia so just kill them all because that is again what they are told.
I do not think that world leaders are that stupid. They are using this climate change for their own agenda. Even Obama and Bull Gates both bought houses on the beach and Obama has now bought a private island in the Caribbean. Hm. So much for their belief in rising sea levels and civilization.
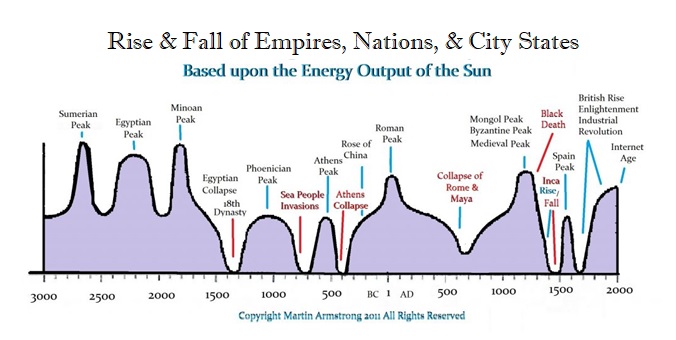
This is all about control – we, the great unwashed. There is absolutely no way the world will end because of CO2 in 7 years. That is absolute nonsense to create fear and obedience. The climate has always changed – it is NEVER the same. Civilization expands during warming periods and it collapses during cold periods. France has had the coldest April since 1947. Yet Macron vows to “get France out of oil, gas, and coal” while Paris is freezing and needs heat. I woke up this morning to 50 degrees here in Florida. Obviously, we have way too many climate change zealots coming to Florida holding Séances for global cooling to save the planet.
Maybe Gates is correct – we just need to thin the herd of all stupidity before we can get our human rights back.
Published originally on Rumple by Energycademy on January 31, 2022
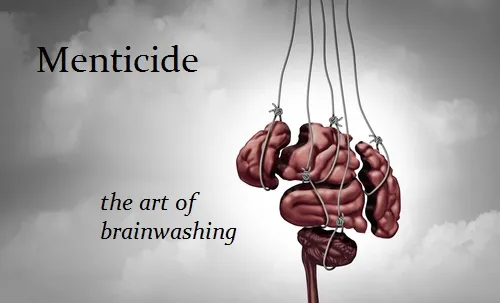
This video looks at the official definition of green energy and critically examines how well solar and wind energy, two of the most popular form of green energy, match the official definition.
Posted originally on the conservative tree house on March 26, 2022
Current Treasury Secretary Janet Yellen is a Davos/WEF devotee of the highest magnitude. Yellen is ensconced in the worldview of those who run the operations of central banking and global finance. She is the globalist secretary of world treasuries and has been throughout her professional life.
As more people become aware of the Build Back Better agenda, or as some would say “The Great Reset,” and its direct connection to the dreams and aspirations of the climate change ideologues in the elitist class, it is worth paying attention when Yellen says nothing will deter the Biden administration from eliminating fossil fuels; and it is her role to make that objective financially possible.
Yellen emphasizes the Biden administration position about how the conflict in Ukraine and the sanctions against Russia are an example of why the global energy resources need to fundamentally change to renewable resources. Her strength of advocacy, in alignment with the Davos/WEF position, is yet another data-point to highlight the predictable cleaving of the world economies into two distinctly differing groups of nations. WATCH:
It doesn’t matter how economically painful it is to chase these energy policies, the elitists who operate western government are all-in on the same program. The same western governments who used totalitarian emergency powers to destroy liberty and freedom under the guise of COVID-19 mitigation, are the same western governments now aligned to use the crisis in Ukraine to advance their energy ideology.
QUESTION: Marty; You have been the first to warn of food shortages and to stockpile for the years ahead. With Russia and Ukraine accounting for 30% of global wheat, you have warned that we are looking a shortages into 2032. Does this mean the war will last for 10 years?
LC
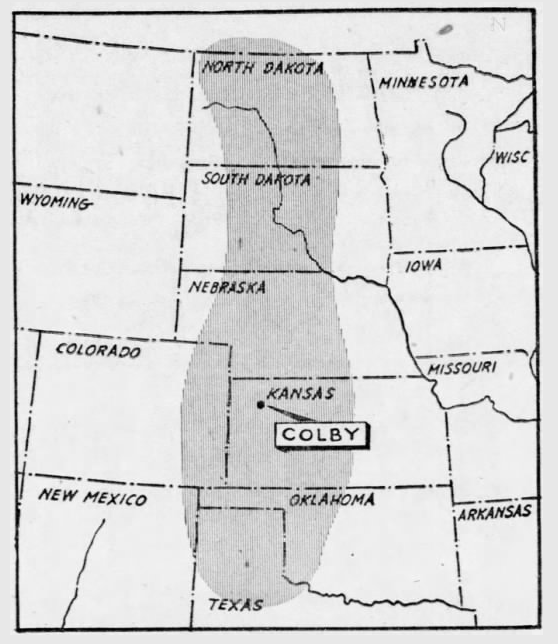
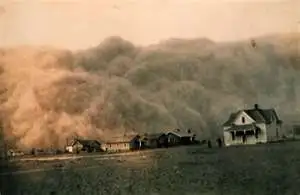
ANSWER: No, the forecasts for shortages into 2024 are actually divided into two primary causes. There was a major crisis in crop failures in 1846-1847, which also provided the economic reasons for the 1848 Communist Revolutions throughout Europe when agriculture was 70% of the economy back then. This was followed by the next great drought which became known as the “Dust Bowl” during the years of 1935-1936. Note, this had nothing to do with CO2 and the Industrial Revolution. While the Dust Bowl was a 10 year struggle for farmers, it certainly varied from city to city. Generally 1935 to 1936 was the worse of it and by 1937 the trend began to reverse.
Our model warns that we may see another severe drought probably between 2025 to 2027 in both the US and Canada. The drought conditions are already beginning and this is in line with our model which warns it will expand into the 2025-2027 period.
Therefore, to answer your question more directly, it appears that we have a shortage first instigated by the outrageous stupidity of COVID management, and this is the accelerated by the War Cycles, and it will conclude with the weather cycle which will only add to the shortages post-2024.
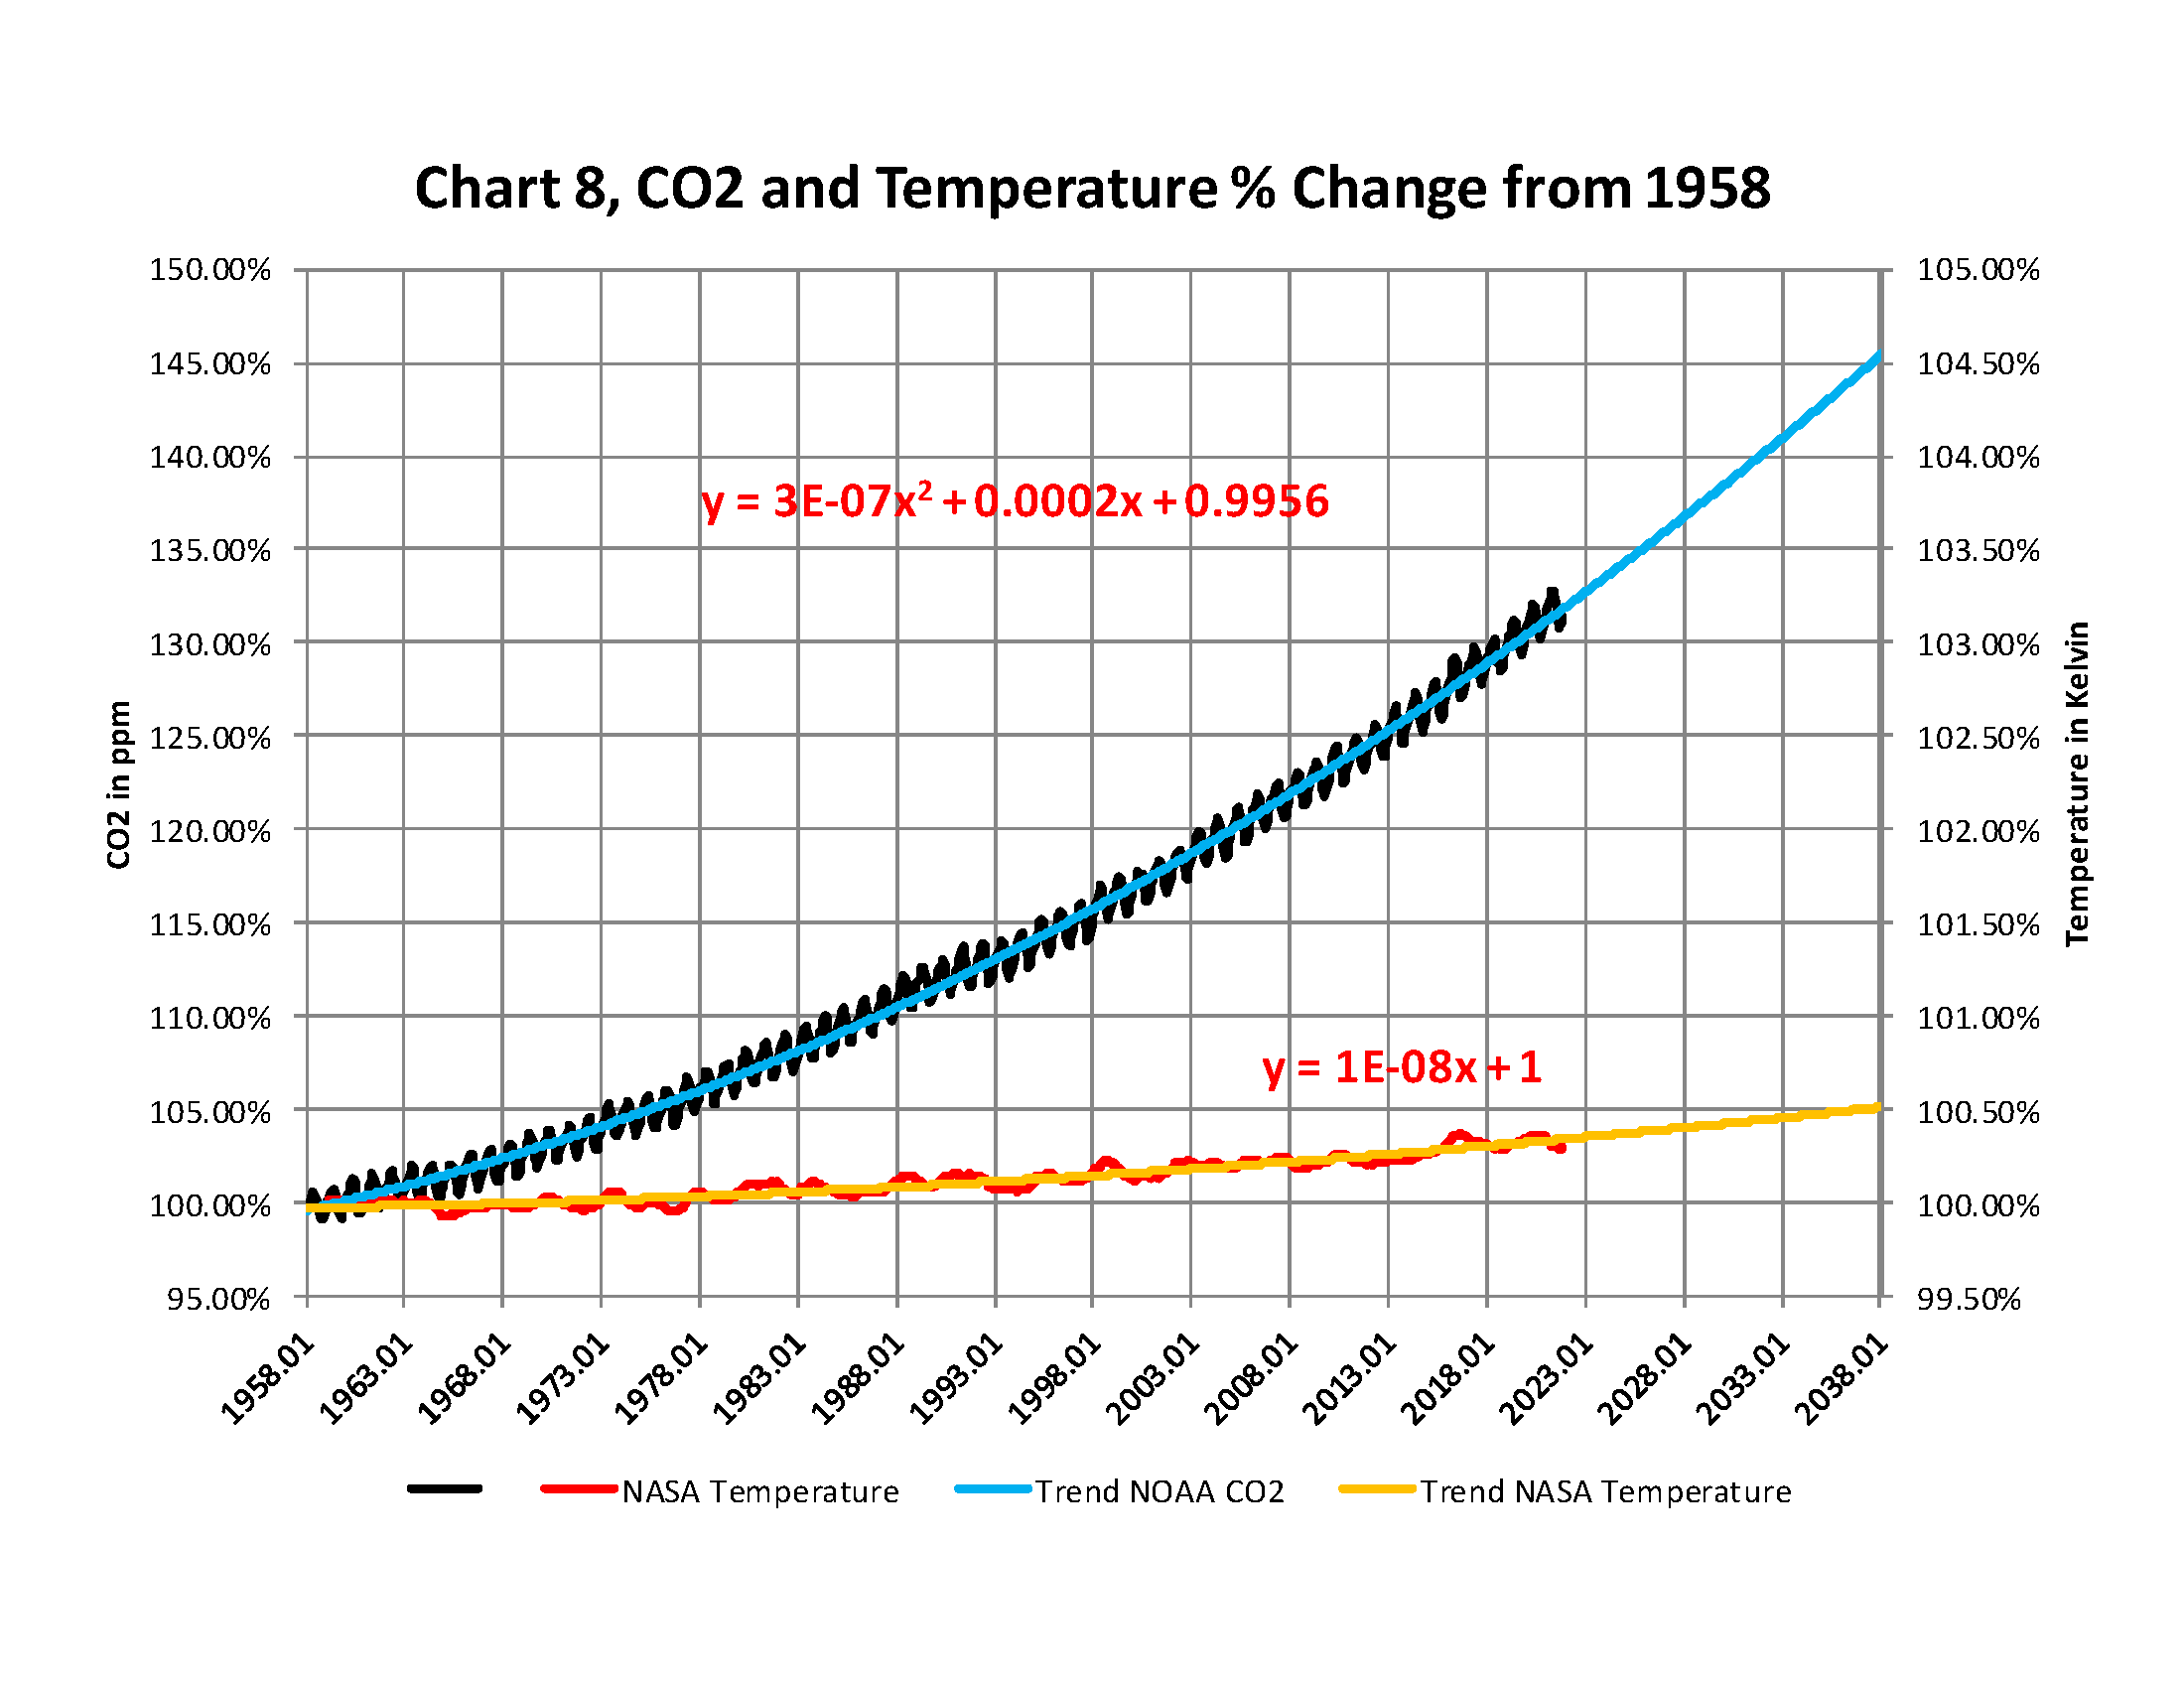
From the attached report on climate change for February 2022Data we have the two charts showing how much the global temperature has actually gone up since we started to measure CO2 in the atmosphere in 1958? To show this graphically Chart 8a was constructed by plotting CO2 as a percent increase from when it was first measured in 1958, the Black plot, the scale is on the left and it shows CO2 going up by about 32.0% from 1958 to February of 2022. That is a very large change as anyone would have to agree. Now how about temperature, well when we look at the percentage change in temperature also from 1958, using Kelvin (which does measure the change in heat), we find that the changes in global temperature (heat) is almost un-measurable at only .4%. As you see the increase in energy, heat, is not visually observably in this chart hence the need for another Chart 8 to show the minuscule increase in thermal energy shown by NASA in relationship to the change in CO2 Shown in the next Chart using a different scale.
This is Chart 8 which is the same as Chart 8a except for the scales. The scale on the right side had to be expanded 10 times (the range is 50 % on the left and 5% on the right) to be able to see the plot in the same chart in any detail. The red plot, starting in 1958, shows that the thermal energy in the earth’s atmosphere increased by .40%; while CO2 has increased by 32.0% which is 80 times that of the increase in temperature. So is there really a meaningful link between them that would give as a major problem?
Based to these trends, determined by excel not me, in 2028 CO2 will be 428 ppm and temperatures will be a bit over 15.0o Celsius and in 2038 CO2 will be 458 ppm and temperatures will be 15.6O Celsius.
The numbers tell us the story of the planets Atmosphere
The full 40 page report explains how these charts were developed .
Posted originally on the conservative tree house on March 10, 2022 | Sundance
The nationwide average for regular gas is now $4.32 a gallon, according to AAA. Just yesterday it was $4.25. In just a few days gasoline has eclipsed the highest price ever recorded by 20¢. The previous record was $4.11 in July 2008. Unfortunately, there is no end in sight. Anecdotally, my neighborhood gas station went up 75¢/gal in just three days and is now $4.95.
Nationally, Diesel prices are also at record highs, with the average cost at $5.06 a gallon, up almost twenty cents overnight from Wednesday to Thursday. This will increase transportation costs for all goods being delivered. The speed of the current rate of increase is very troublesome.
From the attached report on climate change for January 2022Data we have the two charts showing how much the global temperature has actually gone up since we started to measure CO2 in the atmosphere in 1958? To show this graphically Chart 8a was constructed by plotting CO2 as a percent increase from when it was first measured in 1958, the Black plot, the scale is on the left and it shows CO2 going up by about 32.0% from 1958 to January of 2022. That is a very large change as anyone would have to agree. Now how about temperature, well when we look at the percentage change in temperature also from 1958, using Kelvin (which does measure the change in heat), we find that the changes in global temperature (heat) is almost un-measurable at only .4%. As you see the increase in energy, heat, is not visually observably in this chart hence the need for another Chart 8 to show the minuscule increase in thermal energy shown by NASA in relationship to the change in CO2 Shown in the next Chart using a different scale.
This is Chart 8 which is the same as Chart 8a except for the scales. The scale on the right side had to be expanded 10 times (the range is 50 % on the left and 5% on the right) to be able to see the plot in the same chart in any detail. The red plot, starting in 1958, shows that the thermal energy in the earth’s atmosphere increased by .40%; while CO2 has increased by 32.0% which is 80 times that of the increase in temperature. So is there really a meaningful link between them that would give as a major problem?
Based to these trends, determined by excel not me, in 2028 CO2 will be 428 ppm and temperatures will be a bit over 15.0o Celsius and in 2038 CO2 will be 458 ppm and temperatures will be 15.6O Celsius.
The numbers tell us the real story of the planets Climate
The full 40 page report explains how these charts were developed
Click on the link below for the full report that you can download.
From the attached report on climate change for November 2021Data we have the two charts showing how much the global temperature has actually gone up since we started to measure CO2 in the atmosphere in 1958? To show this graphically Chart 8a was constructed by plotting CO2 as a percent increase from when it was first measured in 1958, the Black plot, the scale is on the left and it shows CO2 going up by about 32.0% from 1958 to December of 2021. That is a very large change as anyone would have to agree. Now how about temperature, well when we look at the percentage change in temperature also from 1958, using Kelvin (which does measure the change in heat), we find that the changes in global temperature (heat) is almost un-measurable at only .4%. As you see the increase in energy, heat, is not visually observably in this chart hence the need for another Chart 8 to show the minuscule increase in thermal energy shown by NASA in relationship to the change in CO2 Shown in the next Chart using a different scale.
This is Chart 8 which is the same as Chart 8a except for the scales. The scale on the right side had to be expanded 10 times (the range is 50 % on the left and 5% on the right) to be able to see the plot in the same chart in any detail. The red plot, starting in 1958, shows that the thermal energy in the earth’s atmosphere increased by .40%; while CO2 has increased by 32.0% which is 80 times that of the increase in temperature. So is there really a meaningful link between them that would give as a major problem?
Based to these trends, determined by excel not me, in 2028 CO2 will be 428 ppm and temperatures will be a bit over 15.0o Celsius and in 2038 CO2 will be 458 ppm and temperatures will be 15.6O Celsius. This is what the data shows no matter what the reasons are, so I have no idea how the IPCC gets to predict that the world will end in ten or even twenty years.
The numbers tell us the real story of Climate change
The full 40 page report explains how these charts were developed and why using NASA and NOAA data that are used without change to prove that The New Green Deal is not required and any attempt to complete that plan will be a worldwide disaster.
Click on the link below for the full report that you can download.
I have created this site to help people have fun in the kitchen. I write about enjoying life both in and out of my kitchen. Life is short! Make the most of it and enjoy!
This is a library of News Events not reported by the Main Stream Media documenting & connecting the dots on How the Obama Marxist Liberal agenda is destroying America