Head’s Up – Tropical Storm Michael Forecast To Become Hurricane…


Coastal residents of Northern Florida (Panhandle), Alabama, Mississippi and Louisiana should keep an eye on tropical storm Michael.  The storm is anticipated to become a Hurricane in the northern Gulf of Mexico sometime late Tuesday/Wednesday.

At 100 PM CDT (1800 UTC), the center of Tropical Storm Michael was located near latitude 19.2 North, longitude 86.9 West. Michael is currently stationary but is expected to resume a slow northward motion later today. A northward motion with some increase in forward speed is expected over the next few days. On the forecast track, the center of Michael will move near the northeastern tip of the Yucatan Peninsula Monday morning, and then across the eastern Gulf of Mexico late Monday through Wednesday morning.

Maximum sustained winds are near 40 mph (65 km/h) with higher gusts. Strengthening is forecast during the next several days, and Michael could become a hurricane by Tuesday night or Wednesday. (More from hurricane center)

Debt Soars, IMF warns


QUESTION: Do you concur with the IMF WARNING?

RKC

ANSWER: The IMF said: “No financial regulatory framework can or should aim to reduce the probability of crisis to zero, so regulators should remain humble.”  What the IMF is warning about is the risk of interest rates rising and countries who have borrowed in dollars are presenting a major Emerging Market Debt Crisis. Then we have the two-fold risk is the currency and the interest rates. Many others have borrowed but with floating rates. Our model is warning that rates are going to more than DOUBLE. In the face of that probability, we are looking at a very distinct and unique type of debt crisis.

Napoleon – War – Sunspots & Human Excitability


COMMENT: I love when you educate us about the weather, especially the cycles. the NAPOLEON story killed me !!! I’m a french and believe me, nobody talked in school about the weather cycles when he tried to fight Russia and lost everything. I read 3 times your chart which plots the temperatures and the cycle initiated by the volcano a few years ago. you are enough smart to guess that French teachers NEVER talk this story under this angle of cooling temperatures…

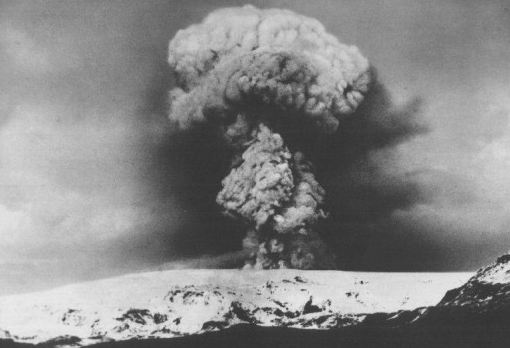
REPLY: When you correlate everything you see the patterns. Sure, at Waterloo, the French used CANNONS while the British used CANISTERS. On the day of the battle, it rained a lot. The ground was very muddy, soft and wet mud. In that weather and ground conditions, cannons were not as effective.  It was more than just the weapons. In those weather conditions, Napoleon delayed and that cost him the battle. But had the weather been dry, things may have been different. The cold clearly beat Napoleon on his attempted invasion of Russia.

There is also the Human Excitability Study where war was correlated to sunspot activity. The sunspot cycle is roughly every eleven years. However, this time it’s different. The sun is headed for a very rare, super-cooling period that threatens to topple civilization itself as it has throughout history roughly following a 300-year cycle.

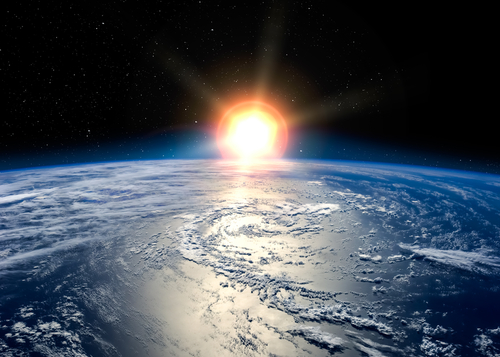
For most of its history, science believed the sun’s output was constant. They finally realized that a thermal dynamic cycle beats like your heart so the sun could not exist if it was a steady outflow of energy. One degree less and it would blow itself out. Hence, it is cyclical rising and falling in intensity.

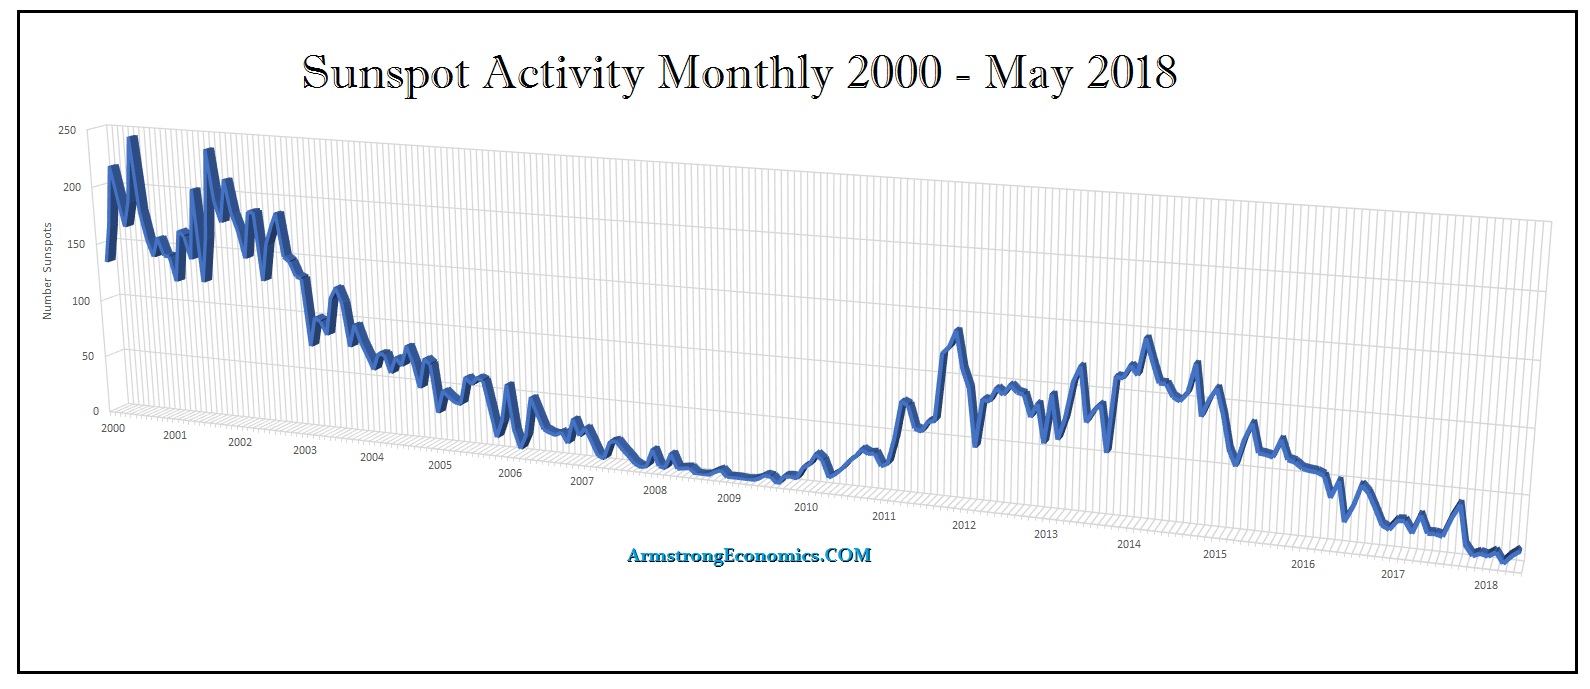
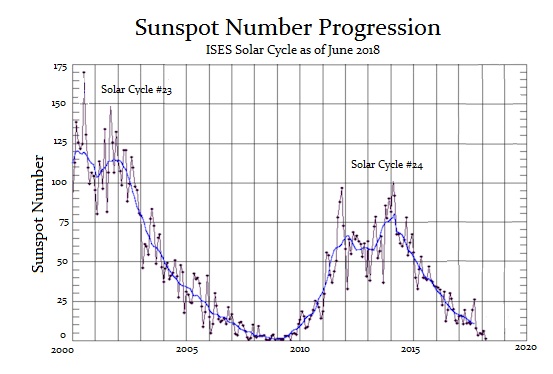
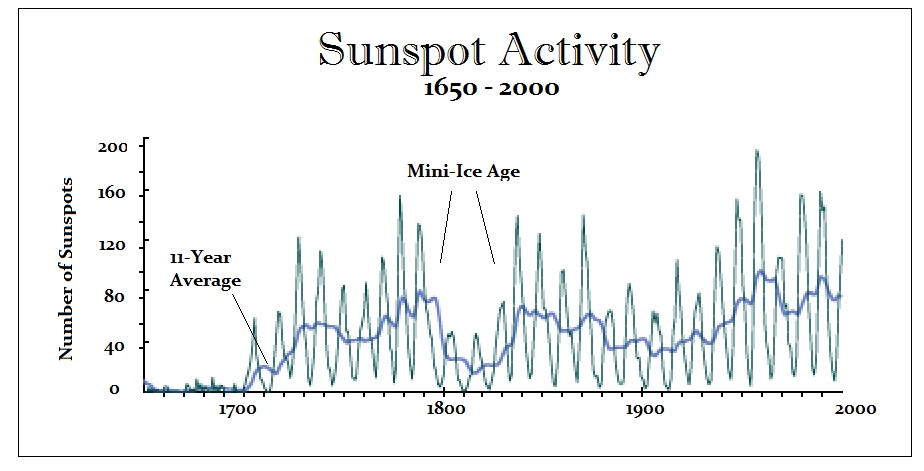
The eleven-year cycle in sunspots itself builds in intensity like the Economic Confidence Model (ECM) reaching “grand maxima” and “grand minima” over the course of 300 years. The last grand maximum peaked circa 1958, after which the sun has been steadily quieting down. Today, the drop in activity is at its steepest in 9,300 years, which is being ignored by the Global Warming propaganda.

The last Maunder Minimum, during which the sun languished for seventy years, took place from 1645 to 1715 when the sun’s brightness declined and the number of sunspots collapsed to almost zero. We are seeing almost zero so far in 2018.

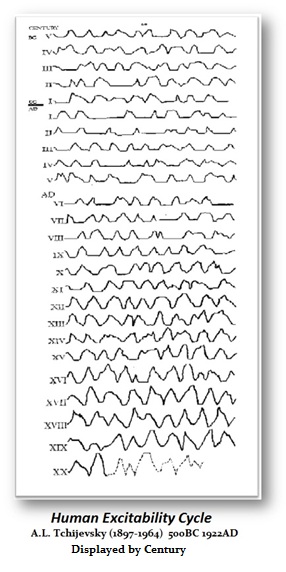
Alexander Leonidovich  Tchijevsky (1897-1964) did a study on sunspot and human activity. He found that humans responded even creating wars with the swings in sunspot activity. He may be most notable for his use of historical research (historiometry) techniques to link the 11-year solar cycle, Earth’s climate and the mass activity of peoples.  Just after World War I, Tchijevsky published a book on cycle theory. Perhaps the title was not destined to make the book a smash hit, but it might take a big breath away before you finish reading the last word. The title was: “Investigation of the Relationship Between the Sunspot Activity and the Course of the Universal Historical Process from the V Century B.C. to the Present Day.”

The title is a bit of a long-winded oddity suggesting that human nature becomes more excited during the increased periods of sunspot activity. Whether or not Tchijevsky proved his theory that we are all driven by sunspots, much in the same manner as the moon drives the tides of the seas is another subject which I am not too certain about. Tchijevsky’s work is an interesting collection of knowledge that does illustrate a pattern within human activity.

Tchijevsky did prove that man became more excited every 11 years which did correspond to the know 11-year cycle of sunspot activity. He gathered data from 72 nations from 500 B.C. to 1922. Throughout the 2,422 years, he included such factors of human excitability as war, riots, revolutions, expeditions, and migrations. He took into consideration the magnitude of the event, the size of the area affected, and the number of people involved. The charts that are reproduced here give a very interesting cyclical view of man’s activity which you can call emotion or excitability.

The Tchijevsky cycle clearly indicates that every 11 year cycle period can be broken down into four distinct periods. Period #1 has a duration of three years which is marked by peace, passiveness, and general rule by minorities. Period #2 has a duration of two years in which general excitability grows from political unrest. New ideas or concepts emerge which tend to challenge the party in controL These ideas become popular answers to present day problems but there is a definite lack of a uniting force. Period #3 again has a duration of three years. Under this period the public’s voice is heard. Under a dictatorship, this has been the strongest period of mass riots and revolutions in which major problems are solved. At times, anarchy does prevail but generally democratic reforms are gained. Period #4 has a duration again of about three years. The general excitability declines, and the people go along contented in a state of apathetic moods. Peace movements usually are generated during this period. The masses prosper and go about their normal course of life awaiting the sun to set and the new light of dawn which brings the beginning of a new cycle.

Reflect for a moment about these four distinct periods. Looking at our own recent political history, we see a similarity between this cycle and our preference towards political parties. For example. we had a cycle of peace and passiveness following World War II culminating in the peak of period #3 during the Johnson term. We entered period #4 bringing in President Nixon as everyone went about their business. Gradually we entered period #1 which brought about the Watergate affair resulting in the Ford administration and period #2 which has a duration of 2 years. Jimmy Carter arrived in town ushering in period #3 which is the peak on the 11-year cycle that normally contains revolution of political unrest. This brought about period #4 when we revolted against the Inflationary policies of the Democrats by voting in President Reagan with a sense of returning back to passiveness and old standards and goals.

Who knows if these events indeed were caused by sunspot activity? Perhaps the sunspots do affect our emotions in much the same manner as the moon can move the ocean from side to side. But the fact that remains is this: a cycle does exist. You can find no century on this chart that was ever lacking such human excitability. We are indeed “only human” to capture a saying normally invoked for human error. We have all heard that history repeats itself. Perhaps it is not history that repeats so much as human error. We are not immortal. We have not lived constantly throughout time. We die and are replaced by new generations. Each generation tends to believe that they are smarter than the last, failing to accurately study the errors made by previous generations; they will make the same mistakes.

Perhaps the events might differ but the result is always the same. Just as the Crusaders charged off to the Middle East to free the holy land from pagan Arabs, as they viewed it, we charged off into Europe to set the world free from the madness of Hitler; both resulted in worldwide wars so the events may have been different but the motives, passions, and outcomes were the same.

Tchijevsky’s attempt to relate man’s excitability to sunspot activity did accomplish one thing significant. His life’s work may not have proved or disproved his sunspot theory, however, it did provide us with evidence that man’s excitability, or emotions as I prefer to call it, moves within a cyclical pattern that can be identified

Now We have Caused the Earth to Shift – We Humans Cause Everything


Ok, it is time to all hold hands and jump up and down a few times to set the Earth back in line. The latest is that since 1899, humans are now also causing the Earth’s axis of spin to shift about 34 feet (10.5 meters). Now, research quantifies the reasons why and finds that a third is due to melting ice and rising sea levels, particularly in Greenland—placing the blame on the doorstep of anthropogenic climate change. Another third of the wobble is due to land masses expanding upward as the glaciers retreat and lighten their load. The final portion is the fault of the slow churn of the mantle, the viscous middle layer of the planet. My solution is obvious that we are all to blame and we should begin a program of gradual suicide to save the planet. Those who discovered all this harm humans are doing should set a good example and lead the way for the rest of us to follow. Does anyone want to second that vote?

Solar Minimum Correlates with Volcanoes & Earthquakes


QUESTION: I live in Indonesia. I am amazed that the entire world is not known on your door. I understand that your model puts everything together and provides a whole new perspective. Your warning that here in the Pacific Ring of Fire we should expect a trend of increasing volcanoes and earthquakes has been incredibly accurate. Why do government not listen?

PO

ANSWER: I am deeply sorry that so many people died this week. For those who are not aware, the Mount Soputan volcano in Indonesia erupted on Wednesday, throwing ash as high as 4,000 meters into the sky. This came just days after a major earthquake and tsunami then killed more than 1,400 people on the same island. These things correlate to the solar energy output.

Keep in mind that Solar Minimum does not mean that the sun gets colder but rather it changes. Until it’s not. As sunspots fade away, we enter solar minimum. The sun is heading toward solar minimum now and the sunspot counts are collapsing. While intense activity such as sunspots and solar flares subside during solar minimum, the solar activity changes form. During solar minimum, this is when the sun develops coronal holes. These are vast regions in the sun’s atmosphere where the sun’s magnetic field opens up. This then allows streams of solar particles to escape the sun as the fast solar wind.

These holes throughout the solar cycle during solar minimum can last for a very long time even up to six months or more. Streams of this solar wind flowing from these coronal holes create space weather effects near Earth as they hit our magnetic field. These effects can include temporary disturbances called geomagnetic storms, auroras, and disruptions to communications and navigation systems. These are the effects of solar minimum. These effects in the Earth’s upper atmosphere impacts satellites in low Earth orbit as well. However, on our computer, they also correlate to these periods of an increase in volcanoes and earthquakes.

All I can do is warn from the correlations. I am not presenting a theory as to how they are also causing perhaps geomagnetic disturbance which may go into the Earth itself cause these phenomena. I leave that for specialists to ascertain. Nevertheless, I think this has more influence than driving the kids to practice at school

September the Coldest Month in a Decade – Must be Global Warming


It is not looking very good for the winter ahead. A reader from Calgary sent this picture in about the early snowfall up there. Indeed, Calgary just experienced the Snowiest Day in More Than Three Decades. It Broke an October Snowfall Record. Of course, they will call this Global Warming as well. This is just a taste of this winter to come.

Already, the data is now in for September. The world just had the coldest September for a decade, according to the latest satellite measurements by the University of Alabama at Huntsville.  Naturally, mainstream media will not cover this story. They only like to report how we are destroying the planet and everything is all our fault.

Since the governments have handed out $1 billion for these people to create Global Warming forecasts to justify more taxes, there is not a cold day in hell why they would even give us $5 for a correlation study that shows the opposite. Why fund something that does not produce more taxes?

Well, besides growing food in your basement, perhaps you should buy a sewing machine to make long-underwear to sell to the neighbors when they realize it’s getting colder rather than warmer

Solar Minimum – Biggest Decline Maybe Ever


The sun is entering perhaps one of the deepest Solar Minima in thousands of years. Sunspots have been absent for most of 2018. This is really alarming. Since the start of 2018, there have been totally spotless days for weeks. The sun’s ultraviolet output has sharply declined and this is not going to end well.

We can see that this decline in Solar Cycle #24 has been a rapid decline that is twice as fast than any previously. Already the the upper atmosphere is losing heat energy. NASA has conceded that if the current trend continues, this could become a dramatic cold period far worse than many people suspect. The Global Warming crowd is leading the world down a dangerous path because they have been paid $1 billion to create fake research in order to raise taxes as they have been doing in Europe and Canada. Our computer us projecting a very serious decline in sunspot activity. This will be the backdrop to the rise in agricultural prices we see between 2020 and 2024. Of course, thanks to the Global Warming people, it will be too late to prepare

Is Nature Preparing for a New Ice Age or a Pole Shift?


There is a very curious connection between lakes and volcanos in the Arctic. I just posted how there are kilotons of CO2 coming out of volcanos. There is a similar thing now showing up in lakes in the Arctic as well. There are about 300 lakes across the tundras of the Arctic. However, a scientist reports that she has never before never seen a lake like this one. The lake looks like it is boiling. It is making a hissing sound and bubbles are rising to the surface like a pot of water which is on the stove. It is actually producing powerful greenhouse gas called methane that Europe is taxing farmers for because their cows produce it. Who should we tax for this one? Methane gas has escaped from the lake bed and the bubbles are as big as a grapefruit.

There has been a rise in volcanic activity under the ice at both the North and South Poles. Nobody knows if this is a prelude to a pole shift or is this simply a foreshadow of climate change and entering into a new ice age. What we do know is that melting ice does not result in rising sea levels, it results in the water evaporates and it comes back as snow which then increases the glaciers once again. The danger is that this entire Global Warming nonsense is ignoring how ice ages are even created!

In fact, The British Daily Mail is reporting that not only was this forecast of Al Gore dead WRONG, the ice cap has actually expanded for the second year in a row covering 1.7million square kilometers MORE than 2 years ago and it is also thicker! In fact, the ice has melted in some areas and is building up in others as if they are gradually starting to move

Australian Camels Invading Cities?


Most people never even knew that there were camels in Australia. Actually, they are not native and they never could have swum there. In the gold rush days, they imported camels to be able to work in the deserts. When the gold mining boom ended, they just let them go. There are herds of wild camels and horses in Australia. If you go to the center near Ayers Rock, you can even order a camel steak.  While I have ridden camels in the Middle East, the only time I actually was in a camel race was in the center of Australia out by the Todd Regatta – not professionally of course. I always figured you had to do it once in life just to make sure you are alive.

If you are planning a trip to Downunder, you have to go to the desert to witness the Todd River Regatta. It’s an ancient riverbed that no white man has ever seen water yet. That will never stop the Australians from still having a boat race. They just have boats with no bottom and you hold it up around your waste and you run in the regatta.

With the drought in Australia, the kangaroos began invading the cities. Not the camels are also starting to invade in search of food. When that happens, you know there is a problem with a real drought

Katla Building to a Major Event?


They claim that all the world’s nations combined pumped nearly 38.2 billion tons of carbon dioxide into the air from the burning of fossil fuels such as coal and oil, according to new international calculations on global emissions published in the journal Nature Climate Change. That is 32 kilotons per day when one volcano Katla, which is a huge hidden volcano 650 feet beneath the ice cap in Iceland, is emitting 20 kilotons of C02 every day. There are only two volcanoes worldwide that are known to emit more CO2, and now scientists are concerned that Katla may be headed toward a major eruption. Obviously, the UN should be imposing a tax on Iceland for all this added Co2.

Katla has had about 20 eruptions in the last 1100 years. There were eruptions which have been documented in the years 920 and 1612, and from 1821 to 1823. These latter eruptions in the 19th century helped to cool the planet contributing to the mini ice age at that time. The last eruption that actually broke through the ice cap occurred in 1918. There have been subglacial flood events in 1955, 1999 and 2010-2011 that melted ice but it did not break the surface. These events do create flooding as the ice melts. Volcanic activity produced two eruptions in 2010 at Eyjafjallajokull, on March 20 and April 14. The second eruption created the giant ash cloud over Europe which diverted air traffic.

The 1918 ash plume was documented to have reached heights of 14 km. That event looked like a mushroom cloud from an atomic bomb. It is hard to draw a conclusive model since the majority of eruptions only melt ice beneath the surface. The best we can do with an approximation for the events that break through the surface puts it in 2020-2021 for the next ideal event. But the data series is not definitive on this event. It does appear that Katla has become active again since 2010 and is building to a climax. This could also be an event that contributes to global cooling as we saw during the 19th century