
Armstrong Economics Blog/Basic Concepts
Re-Posted Feb 1, 2018 by Martin Armstrong

The three major distinctions in following what we do boils down to Multidimensional analysis merged with TIME and then PRICE. The Arrays give us a good sense of TIME where thing come into the window of possibility. Understanding that we are dealing with TURNING POINTS and not specific events is critical. For example, the three major turning points we had in the Dow were November, January, and March. Under normal conditions, each should produce the opposite event of the previous. However, in VERTICAL MARKETS, one of the characteristics is the process of a cycle inversion whereby you exceed the November high and then you should rally into the next one instead of decline as just took place in the Dow.
Our price objectives are fairly easy to understand such as the 25000-28000 level on the Dow given back in 2014. They become more important when the price reaches such a level ONLY when the TIME is correct.
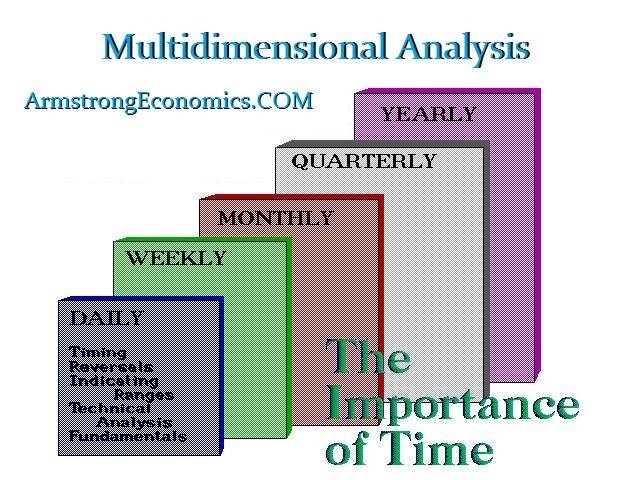
This brings us to the Multidimensional analysis. Virtually every model out there is a flat model. They attempt to forecast the future using typical a daily level of activity to generate buys and sells. The problem this introduces is the fact that they cannot forecast the big events because they cannot see them coming. To do that, we need a database and we need levels of TIME.
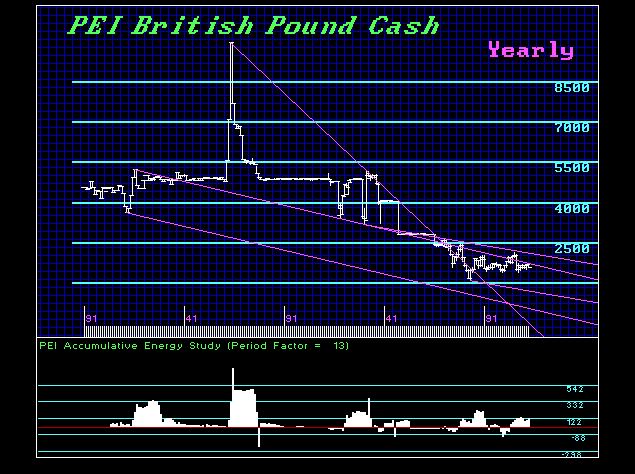
Here is the British pound back to the birth of the dollar. How can you even forecast BREXIT without a clear picture of the historical trend?
