ECB Forced to postpone New Stricter Credit Rules Indefinitely


The ECB’s was forced to suspend its new stricter credit rules indefinitely concerning bad loans. The banks were screaming “you idiot”  for it would have push way too many over the edge, particularly in Italy. With the Italian elections coming in March, the new rules would have been a major issue why Italy should also exit the EU.

The ECB originally sought to introduce new rules for dealing with new bad loans previously.  As of January, banks were expected to cover all loans, which are now classified as default risk. There was no possible way that could be accomplished.

In Italy, their domestic banks would be oppressed and that fewer new loans would ever be issued. This was finally seen as a major negative consequence for the economy. Only with an extreme rebellion by the banks was the ECB forced to back off.

This illustrates the banking crisis that is still brewing in Europe even after nearly 10 years of quantitative easing. There is little prospect for this crisis to be fixed. All that can happen is to postpone the inevitable.

Trading by Systems


QUESTION: Can you trade with the Global Market Watch? Does experience count right now with what you call a Vertical Market?

DS

ANSWER: No. It is an alert to, not a trading tool. It will alert you to breakouts, waterfalls, highs, or lows. It is not a 100%. It is far better on the major markets than perhaps individual stocks.

Trading this kind of market is probably more dangerous for those who have trading experience. The reason why is they are used to trading normal markets. This is why they have tried to sell every high as it has been made. Their “experience” actually defeats them.

The 1987 Crash was the perfect example. They were hunting for the person who caused the crash. What they discovered was that they did use computer programs, but they did not follow them because the Dow was down 500 points and they thought there would be a bounce because there was no fundamental explanation. That is when it took out a rare set of Double Weekly Bearish Reversals and we had a gap down to 180 from 286.


The Reversals are the best tool, and then the cycles help to hone in on the turning points. The Global Market Watch is a pattern recognition model so it is really an alert system that tells you to the look at the detailed reports. We can judge the magnitude of possible moves by looking at the gaps in the Reversal system.

British Pound – How High is High?


QUESTION: In your year-end report, you said the resistance in the pound for 2018 was at the 14500-14600 level throughout 2018. We stopped at the mid 14300 level. Is this it?

ANSWER: In 2016, the British pound elected the Yearly Bearish Reversal at 14000. It is normal to retest that level since we closed 2016 at 12321 well below the Reversal. Therefore, the 1% rule applied and we should retest that Reversal before following through. That is what 2018 is all about. The next big turning point for the pound against the greenback will come in 2019. However, the next major crisis point will be 2021.

As for right now, we have a Directional Change next week. Therefore, failing to exceed this week’s high next week means we can retest support into the week of February 5th. Thereafter the week of 19th will come into play and volatility will rise for the end of February. The major technical resistance is in the 15000 zone. Only a closing above the 16700 area would reverse the long-term trend.

Mnuchen Calls for Weaker Dollar


QUESTION: Mr. Armstrong; You have repeatedly said that the USA was a lower dollar while Europe thinks a strong currency is better. You said the dollar would decline first into 2018. That seems to be spot on. After Treasury Secretary Steven Mnuchin statement that a weaker dollar is best for USA, the dollar sold off. Why is there is a huge difference between the USA and Europe with respect to currency values?

HD

ANSWER: First of all, you can bet that Mnuchin had a little help from his friend in NYC who piled on short positions before his speech. The USA had also wrongly believed that a strong currency meant a strong economy. During the Great Depression, Roosevelt’s Brains Trust were all against devaluing the dollar. Why? It is the bondholders. A devaluation of a currency means that you pay back with cheaper dollars.

Europe, on the other hand, went through two World Wars. Their currencies went to zero. Politicians used the value of the currency and proof they did a good job and should be reelected. No American politician could run and claim that the dollar is up against Mexico, Europe, and Japan so vote for them.

I became probably the largest FOREX adviser in the world because I was an American. When I was going to open up offices in Europe, I went to lunch with one of the heads of a major Swiss bank and ran a few names by him like European advisers etc. He asked me to name one European analyst. I was embarrassed for I could not back in 1985. He said there were none. Because currencies were used by politicians, it was unpatriotic to forecast any European currency would decline. He told me that was why everyone was using our firm – “You don’t care if the dollar goes up or down!”

This is nothing new. The 1985 Plaza Accord was all about a coordinated effort to force the dollar down. That was the entire reason for forming G5 back then – now G7/G20. The New York Times wrote: “Since 1985, the damage that accompanied the unfettered dollar has slowly started to be repaired. The Administration gambled that a big drop in the dollar, by making American goods cheaper and imports more expensive, would quickly translate into a large pickup in exports and a falloff in imports.”

Then the dollar fell like a stone and the G5 came out with the Louvre Accord and tried to stop the dollar decline. The markets did not comply.

The decline in the dollar was so significant that it then set in motion massive selling of US assets. The Japanese sold off debt and asset holding in dollars and took the money home, which then created the Japanese Bubble in 1989.

When Robert Rubin started the same nonsense trying to talk the dollar down again for trade, I wrote to him warning that he would create another crash.

Tim Geithner replied saying they would never do that.

Trump is playing the same card. He wants a lower dollar to boost exports and create jobs. Yes, the dollar was scheduled to decline into 2018. However, only a dollar rally will create the massive collapse in the world monetary system. Make no mistake about this, they are not in charge. The dollar kept collapsing after the Louvre Accord. The dollar had peaked and was starting the decline before the Plaza Accord was announced.

Central Banks and Governments may try to manipulate the currencies, but they too will be embarrassed. The words of Herbert Hoover should be read at every board meeting at the start of every Central Bank.

The Yield Curve


QUESTION: AT the Institutional WEC session in 2016, you forecast that rates would rise but that the long-end would produce a positive yield for the next two years at least. Are we coming to an end of that forecast?

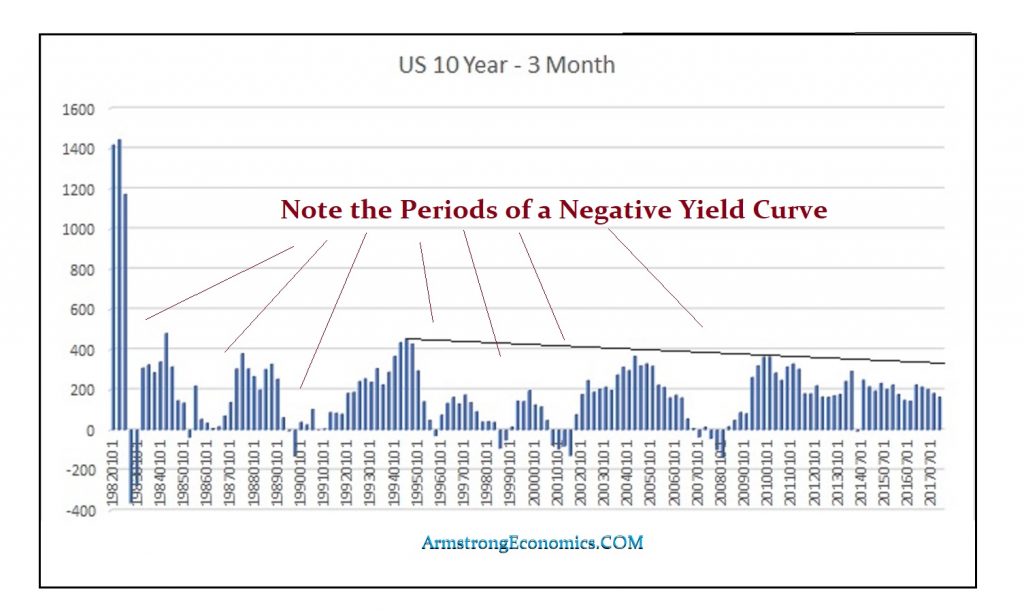
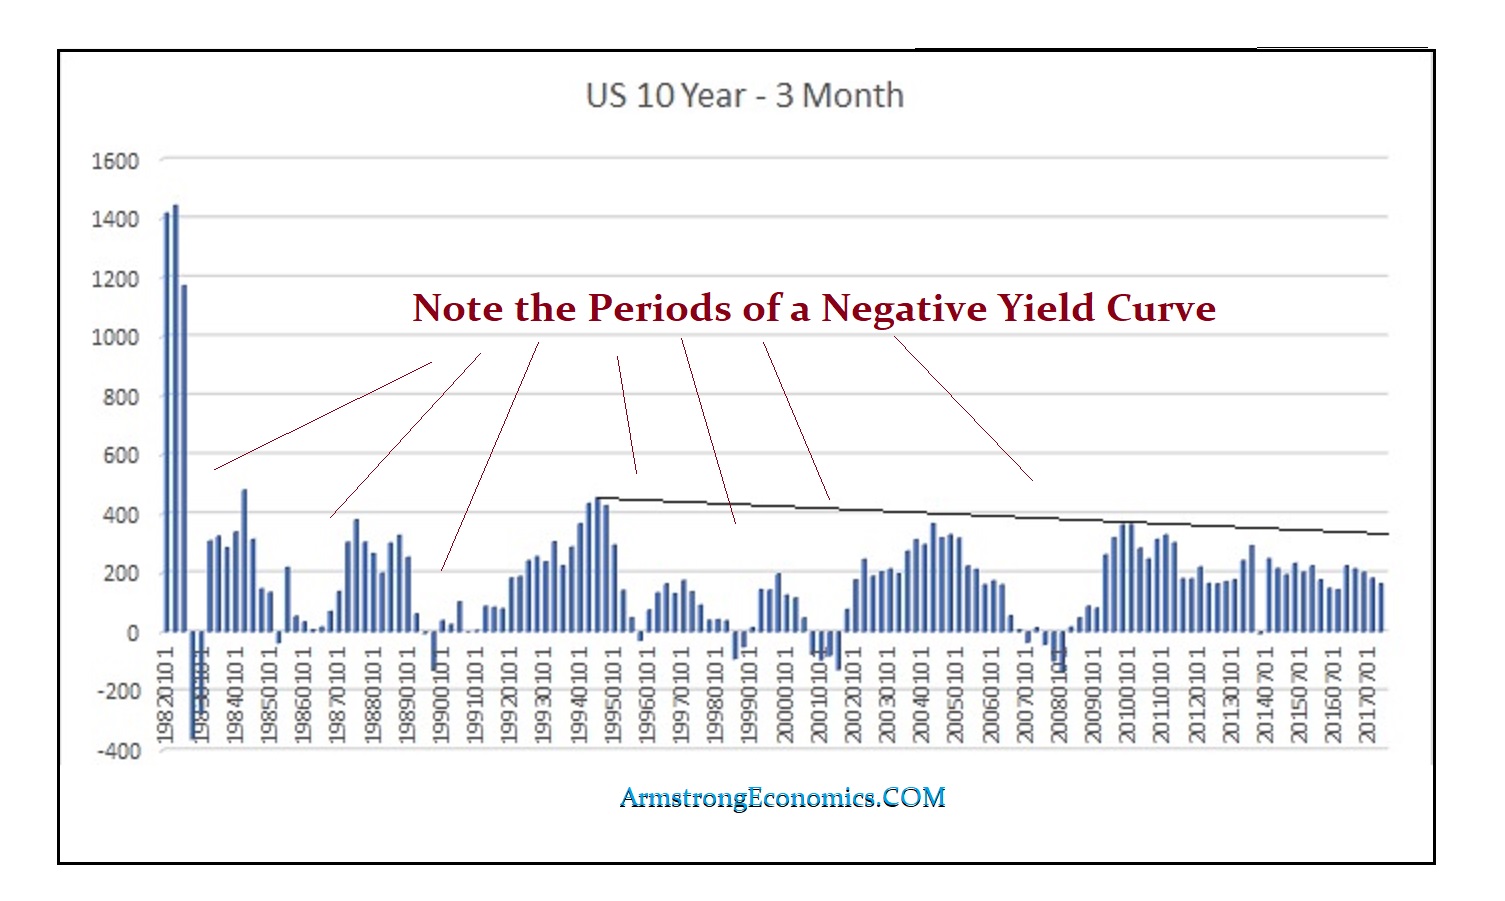
ANSWER: The new Institutional service is being expanded currently. Our hedging model positions have been added to the commentary. However, the consensus out there is that while the Fed is expected to raise rates 3 more times this year and 2 to 3 times next year, our models are projecting we are moving back toward a negative yield curve.

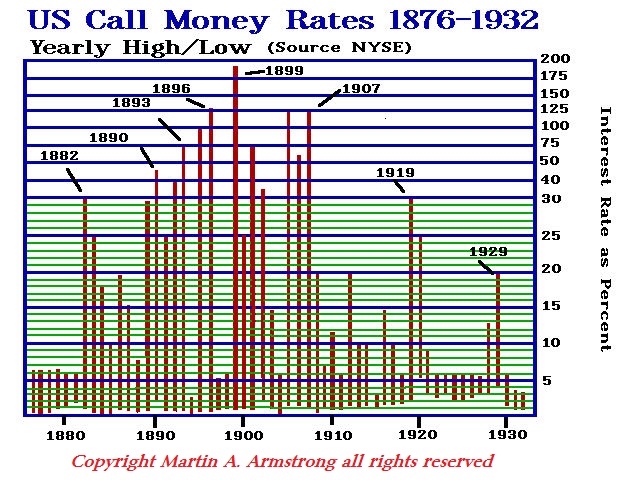
The last key high came at 3.65% premium for the 10-year during the first quarter 2010. The Quarterly Bearish Reversal rested at 2.61% and the next one presented a huge gap down to 0.87%. That first Quarterly Bearish was elected by the 3rd quarter 2010. The spread went negative in the 4th quarter 2013.

We will be adding the yield curve to the Institutional Levels. Those who have bought the long-term assuming that the short-term rate hikes will be modest for some time making a yield of about 2.65% attractive, may discover that the yield curve just may swing into a negative position again rather uncontrollably rather than intentionally.

We will be addressing this in more depth on the Institutional Blog.


On both the Professional Report for Individuals and for the Institutional Reports, Socrates writes a separate report for each time level in addition to a consolidated overview.


SAMPLE: INSTITUTIONAL REPORT FOR THE MONTHLY DOW JONES

This is not the complete report. Timing has been omitted in this version.


THE SOCRATES INSTITUTIONAL MONTHLY COMMENTARY, DOW JONES INDUSTRIALS AS OF THE CLOSE OF  Fri. Jan. 19, 2018: Using our Monthly Hedging Model based on the Reversal System exclusively, we are currently long since  Fri. Jan.  1, 2016 when we reversed our hedge position in this market.

The last Reversal elected was a Monthly Bullish during April 2017. From a speculative perspective, basis the Reversal System, we are currently hypothetically long 14 positions at this particular moment on the Monthly level. Closing support lies at 2245613. Only a daily closing below this level will signal a pause in the Monthly trend. This market is in a Breakout mode but is easing up right now yet it is still trading up year over year about 23.6%.

This market has been making new highs which has been a series of successive advances. The last 3 highs have been progressively making higher highs implying we have a bullish run in motion for the past 25 months. The Channel Technical Resistance stands at 2515199 for the next session. A closing above that will signal a breakout to the upside once again.

Regarding the near-term level, the market has closed up 21.2% from the last cycle low established April 2017, which has been only a 8-month rally as of last year. Nonetheless, turning to the long-term perspective, the market has still closed on the Monthly level up 60.8% from the strategic low established August 2015, which has been a 28-month rally from last year.

Our models for this month’s open on the monthly level was 2563170 which we opened below coming in at 2480935. We needed an opening print above that number to signal this was still in a strong breakout position. We have exceeded that number so far during the trading this month and we are still above it on the latest closing basis suggesting the market is still rather strong. The projected extreme target breakout resistance for this month stands at 2650939.
Critical support still underlies this market at 2170962 and a break of that level on a monthly closing basis would warn of a decline ahead becomes possible. Nevertheless, the market is trading above last month’s high showing some strength. On a broader perspective, this market remains in an uptrend posture on all our indicators looking at the monthly level. We see here the trend has been moving up for the past 28 months. The last monthly level low was 1537033, which formed during August 2015, and only a break of that high will see the market move high still. The last high on the monthly level was 2487607, which was created during December 2017, and has now been exceeded in the recent rally.

Currently, we have not elected any Monthly Bearish Reversals from this new high. The immediate Monthly Bearish Reversal to watch lies at 2170962. A closing beneath this level will signal a temporary high is in place. Additionally, a closing beneath 2392190 would also imply a pause, technically speaking, in the uptrend for now. Technical projected resistance for tomorrow stands at 2543813. Only exceeding that level would imply a runaway breakout to the upside.

Looking at our Pivot Points, the market is trading above one indicating pivot implying that this market is in a positive position with support at 2442269 and resistance at 2563170 and 2593155 this month.

ENERGY MODELS
Our Monthly Energy Models are still in a bullish mode given the fact that the market closed higher.

RISK
Turning to the monthly time level, we must respect that there is a 7.55% risk on the upside, where we show a clear downside risk factor at 16%. From a risk perspective, resistance on a closing basis stands at 2804252 whereas the risk on the downside begins at 2170962.


REVERSALS

The current overall tone on the Monthly level is very Bullish for right now electing four Monthly Bullish Reversals suggesting a strong trend move on this time level with the last Reversal being elected on April 2017.

The first key Monthly Bearish Reversal rests at 1601365. A bull market remains in play as long as that Reversal holds on a monthly closing basis. To confirm a mid-term change in trend to the downside, all four Monthly Bearish Reversals in this market would need to be elected meaning a monthly close beneath 2170962 is required. Our projected Bullish Reversals in this market are above beginning at 3373849. The Dow Jones Industrials is obviously in a full-blown bull market on the weekly to yearly levels of our model. Overall, the posture is quite bullish right now on the long-term perspective. Long-Term trend changes only when we elect monthly sell signals.

Elizabeth I Two-Tier Monetary System


QUESTION: You have mentioned that the US maintained a two-tier monetary system with trade dollars during the 19th century. Did Britain ever do the same or was the fact that Britain was the financial capital so they were exempt?

Thank you for the help and education.

DL

ANSWER: When Elizabeth I (1558-1603) was on the throne, Spain was the financial capital. Therefore, we do see an attempt to employ a two-tier monetary system in England at that time. Elizabeth issued four denominations of Eight, Four, Two and One silver Testern as they were known. They were also called “Portcullis Money”, This was an attempt at producing a trade coinage sponsored by the newly formed East India Company to be used in overseas trade principally in the Far East. However, the competition against Spain and the Spanish Eight Reales (dollars) and its fractions was far too great. Eventually, the coinage did not succeed and thus the surviving coins are a rarity today. The surviving coins are most likely those that were retained in London as a novelty.

The abbreviated Latin legends translate as on the obverse “Elizabeth by the Grace of God, Queen of England France and Ireland; and on the reverse “I have made God my Helper” a Psalm from the Bible.

Vertical Market are the Most Difficult to Trade Even With 30 Years Experience


COMMENT: Dear Mr. Armstrong,
I want to thank you for the great advice some months back, “Do not short this market”, I took your advice. I day trade, and other experienced Traders, with over 30 years experience, recommended I shorting the DOW, Swing Trades, I did not short the markets. Their positions were eventually stopped out with big losses.

Thanks again

A. (from London)

REPLY: Keep in mind that even 30 years of trading experience does not stack up to the type of market we are involved in. VERTICAL MARKETS are different animals altogether. We are in the DENIAL STAGE and that means the market presses higher without a major bullish attitude. What will eventually happen is the more the Dow presses higher, we will reach that major line and when crossed, people will just throw in the towel and then say it will NEVER stop.

I restate that position once again – DO NOT SHORT THIS MARKET. You Must Wait for Socrates to give the signal. It picked the high in Bitcoin. It can do things even with the historical data because it is forecasting the entire world and everything has its place.

Can We Stop the Government Borrowing & Just Print Without Inflation?


The conservatives are going nuts about raising the debt ceiling as if this really matters. They claim: “The United States is effectively bankrupt, but that doesn’t matter to the GOP. Once evangelists of fiscal responsibility and scourges of deficit spending, Republicans today glory in spilling red ink. The national debt is now $20.6 trillion, greater than the annual GDP of about $19.5 trillion. Alas, with Republicans at the helm, deficits are set to continue racing upwards, apparently without end.”

What they fail completely to grasp here is until the system is completely revamped and we adopt the way the Roman Empire was funded from 280BC to 68AD, just creating the money to fund the government instead of borrowing it, there is no hope in solving this issue. In a recession, Keynes argued borrowing can be beneficial in creating economic stimulus and shortening the recession. Governments used that statement to then perpetually borrow year after year.

In 1940 a Cadillac sold for $1675. Currently, the low-end Cadillac is $35,000. This is almost 21 times the 1940 price level. The US national debt was $51 billion before the war and it is now $20 trillion. The debt has risen 392% compared to 20.89% for a Cadillac. The minimum wage in 1940 was 30 cents per hour. Today, the minimum wage is $10.10 per hour in 2018, which is a rise of 33.6%. However, if we look at collectibles, the famous 1804 silver dollar sold for $30,000 around 1940. In 1999, one sold for $4.14 million. Here we had an advance of 138%.

Then there was the Peter Paul Rubens which just sold for $58 million in 2016. The owners had tried to sell during the Great Depression. Nobody was interested. They then lent to a monastery where it hung in a hallway for 20 years. Other than that exception, nothing has advanced in proportion to the national debt. Therefore, the idea that increasing the money supply will automatically result in proportional inflation cannot be proven by any means of a statistical study. It is a nice theory, but it has never been proven to work. Hence, 10 years nearly of ECM quantitative easing failed to reverse the deflation.

If we had simply created the money instead of borrowing it, the national debt would be less than 50% of what it is today. The government borrowing competes with the private sector reducing economic growth and creating a bid for money that raises interest rates for the average person. Inflation did not go crazy in Rome until about 250AD onward.

The theory that it is less inflationary to borrow than create meant something when government debt was not collateral for loans. You could not borrow against TBills or bonds before 1971. Ever since borrowing is more inflationary because we then have to pay interest to keep it rolling when we have no intention of paying it off. The entire system will go crazy and as interest rates rise, the debt will explode.

Debt today is simply money that pays interest.

Alaska Hit by 7.9 Earthquake – The Start of a more Active Period lies Ahead


A 7.9 earthquake just struck off the coast of Alaska. There have been 12 major earthquakes greater than 7.0 since 1906. The 1964 earthquake was one of the biggest ever in North America measuring 9.2. The real significance of this event today is the fact that the Ring of Fire in the Pacific has 10 volcanoes now erupting all around. This is clearly from a cyclical standpoint rising in volatility to put this in market terms.

The other significant factor is this spans the course of 112 years which is also half the cycle duration of a 224-year wave that led to the discovery of the 8.6 year Economic Confidence Model.  We seem to be following the Pi cycle in nature as well. The disturbing fact here is the activity is rising around the Pacific Rim.

We should now expect the volatility to rise. After the 1964 earthquake, 1965 became an extremely active year with 18 magnitude 7.0+ events. Two of these were above magnitude 8 and struck within 10 days of each other.

So grab on to something if you live on the edge of the Pacific Ring of Fire

Quantity Theory of Money (QTM) & Its Failure


QUESTION: I am most interested in your revisionist view of QTM. You debunk QTM frequently within broader topic discussions, but I’d love for you to address QTM by itself in a historical context. Perhaps starting with the Austrian darling, Henry Thornton, and his “An enquiry into the nature and effects of the paper credit of Great Britain” (1802).
Separately, are you aware of the work of De Grauwe/Polan’s “Is inflation always and everywhere a monetary phenomenon” published in the Scandinavian Journal of Economics (2005)? If not, the paper’s summary regarding QTM states that the correlation between money supply and prices is not proportional and predisposes a stable velocity of money. The authors find a stronger QTM correlation and inflation in countries with high inflation extant. In lower inflation countries, such as the U.S., the correlation is less proportional.
When I was an economics student in the 70s we were taught two holy grails of econ: Keynesianism and Monetarism. Since you debunk both theories, I’d like to hear why.
Thanks,

TGM

ANSWER: I go into this in great detail in the How to Trade a Vertical Market. This is not a topic for a blog post lacking the space. To shorten the response as much as possible, both Friedman and Keynes were based upon a system that was purely in theory. The government only took part of Keynes’ suggestion to increase spending even into a deficit to stimulate demand. He also never advocated perpetual spending indefinitely. Keynes also advocated lowering taxes to stimulate. Few Presidents have ever done that: JFK, Reagan, and now Trump is attempting it.

Milton argued that the Fed was following austerity and raised rates to support the dollar during the 1931 Sovereign Debt Crisis. As Friedman and Schwarz wrote, “The Federal Reserve System reacted vigorously and promptly to the external drain. . . . On October 9 [1931], the Reserve Bank of New York raised its rediscount rate to 2-1/2 per cent, and on October 16, to 3-1/2 per cent–the sharpest rise within so brief a period in the whole history of the System, before or since (p. 317).”

Milton’s premise was that the Fed was doing what Germany is doing today. They were trying to support the currency to retain confidence in the bond market rather than stimulating the economy. In theory, Milton makes sense that one should expect higher inflation if the money supply were expanded instead of contracted. There is a lot of assumptions in that statement that simply do not hold up with time.

It is by no means a one-dimensional economy. This is global and we are all connected. The overlooked aspect here is the size of government has drastically changed from the time Keynes lived and Milton published his book. The size of government has grown to consume nearly 40% of GDP on average. It is no longer the incidental observer. It can no longer raise and lower interest rates to control demand when the government is the lion share of that demand and competes against the private sector. Volcker raised interest rates into 1981 to fight inflation and succeeded in costing the government vast amounts of interest thereafter. Raising rates to curb demand may stop the private sector, but it has no influence upon government. You can not stop a Ponzi Scheme once you begin.

In Europe, increasing the money supply has had ZERO inflationary impact and has not stimulated the economy in the least. There is no one-to-one relationship. It is far more complex and it becomes a balancing act. They have been sterilizing any impact of increasing the money supply by raising taxes. The monetary increase is only coming from buying government bonds. It is not supporting the private sector but instead, it has subsidized the government sector.


Even our studies of interest rates have revealed the same outcome.  There is no one-to-one relationship between raising interest rates and stopping inflation or asset inflation. The stock market has NEVER peaked with the same level of interest rates twice in history. It boils down to the simple realization that people respond to the NET affect and not to theory. If you believed t6he stock market will double in one year, you will pay 20% interest. If you do not think the stock market will rally 5%, you will not pay 3%.

I have identified inflation unfolds from three primary sources. First, there can be asset inflation that is not a general inflation experience through the entire economy. Right down we see the Dow Jones has risen from the 6000 level in 2009 to 23000. That has not been matched by inflation is prices or wages.

Then there is the currency inflation. The decline in a currency will result in a corresponding rise in prices of imported goods. This was what we saw with OPEC during the 1970s and the rise in the dollar from 1980 into 1985 all-time high correspondingly produce deflation.

Then we have demand inflation. This is taking place right now in butter in Europe as prices are up 300% because of shortages.

None of these three types of inflation are created by monetary policy and they cannot be altered by trying to artificially control demand by government. The butter rally in Europe is because they maintain high quotas until 2015 when they were reformed since it produced a glut. When removed, prices fell and production collapsed. Not there is a shortage and prices have soared. This is made worse by government interference. We can see demand rise in anything caused by a shortage in that product and again this is not monetary driven.


Money Theory
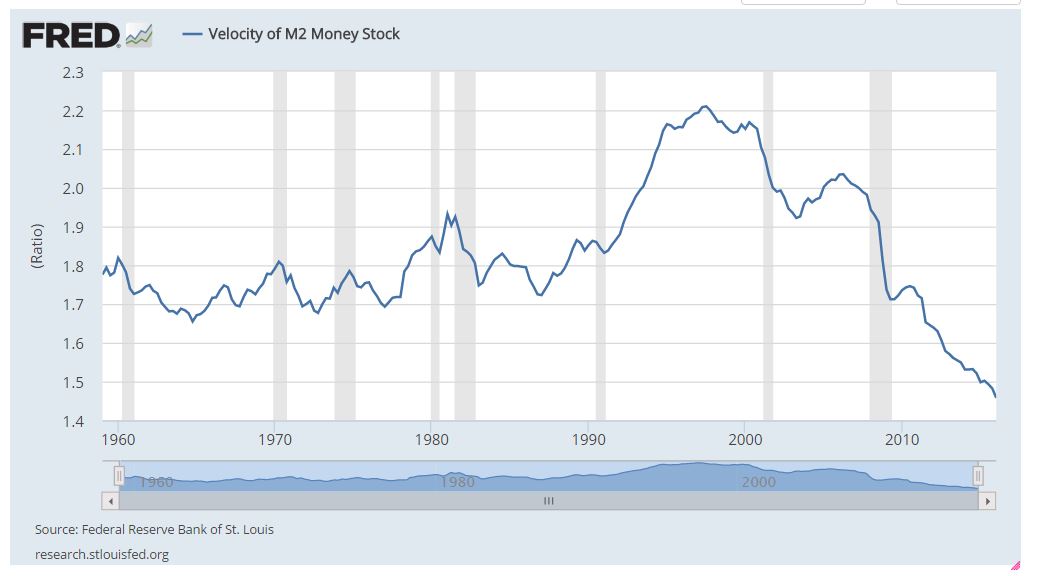
It comes down to a complex formula driven by CONFIDENCE. People are hoarding cash even though the quantity has increased in theory so the velocity of money has been declining. The higher the tax rate, the lower the economic growth as people hoard money (save) and that produces the decline in the velocity of money.

Lowering interest rates DOES NOTHING to stimulate the economy when the banks do not lend anyway and would prefer to park money at the Fed in excess reserves which are sterilizing and the idea of quantitative easing.

If the QTM theory worked, then the central banks’ stimulation QE should have worked. It failed. There is a lot more to this than a simple one-to-one relationship.


In the How to Trade a Vertical Market, I have gone into ancient examples as well. I have shown that the QTM did not hold up even in ancient times when there was no central bank. It is far more complex a subject for just a simple blog post.