Source for the History of Interest Rates


QUESTION: Hello Martin:

I was quoting you while speaking to a friend from a similar recent post where you stated that interest rates were at 5,000 year lows.

They asked me where you got data going back 5,000 years and of course I was at a loss to explain. So my question is: does such actual data exist?

“How can you have such an even with interest rates at 5,000 lows and governments unable to fund themselves? ”

Just one more thing: if Socrates was female and I was a bachelor, I’d be coming to her door every five minutes with another bunch of roses,,,,,

ANSWER: Interest rates are one of the areas along with money that we have historical records back to the start of recorded history. There is even a great data source based in part on the work of by Sidney Homer and Richard Sylla – History of Interest Rates. We have the full account of that research on the site under History.

Our work incorporates that data source and we have added additional material uncovered from historical records.

Cycle Extension – Inversion – 2021 or 2032?


QUESTION: Marty; Just wow. You called the day of the high and then said the market would make a new low yesterday, a directional change would take it back up and that was the low. I do not understand why the world is not knocking down your door. Then again, I guess they did that’s why they overwhelmed your site trying to buy-in. You once said that the cycle can extend into 2032 and an indication of that would be a correction from 2018. You said at the WEC that it did not necessarily mean we would break last year’s low. So is that what is unfolding? Is everything extending from 2021 to 2032?

KS

ANSWER:  The Global Market Watch called the event perfectly. It called for a Waterfall and noted the January high was Important. It picked a similar pattern on the Quarterly level. It came back and identified yesterday as a low as well. This proves the computer did this all by itself. When it picks up patterns, you know it is not biased and there are no human emotions involved. Human judgment is where the mistakes come into play.

We have a turning point in 2020 which has been there on point for years. With 2018 being a Panic Cycle Year, there is the risk of a 2020 low and then you extend the rally out into 2032. This would be indicated by electing a Monthly Bearish Reversal and we must penetrate last year’s low of 19,677.94. However, because this is a Panic Cycle Year, you often take out the high and low or the year before. We have made a new high. So that means if we breach last year’s low, then we end up with a hard recession into 2020 in alignment with the Economic Confidence Model. Under a flat model, yes 2020 would be a low. But is that too easy?

So no, we cannot yet rule out a 2020 low. It all depends upon breaking 198,677.94. If that unfolds, then we are in for a major economic crisis on the Monetary Crisis Cycle going into that which began here in 2018 and goes into 2021 when it goes completely nuts. This means we are treading water right now. Yes, we will go back to new highs. There is no doubt about that. Those who are calling this a super bear market are using flat models as always. They are simply taking the past and overlaying that on the present and proclaim the end of the world as always.

It is far more complicated than that and they have no clue of Cycle Inversions of the impact of Superposition effects injected from external markets. To get some super bear market means cash would swing into government bonds and out of equity. Gold should be rising yet it fell also on its Benchmark. Everything is not aligned with the classic super bear market. How can you have such an even with interest rates at 5,000 lows and governments unable to fund themselves? There is much more at stake than meet the eye.

I am rushing and writing right now the long-term scenario and providing the arrays out for the next 12 years. I will let everyone know as soon as it is out.

Will the Market Make New Highs Again?


QUESTION: Marty; I have been following you since the 1980s. I was there at your WEC in 1987 when you had to hold one every weekend for three weeks in a row the world was going so crazy. I have never known your model to miss a high or picking the low in a panic. Will you update How to Trade a Panic you published back in the 1980s? It is time to get that out.

At the last WEC, I had a conversation with a first timer. He commented you never advertise yet have the biggest audiences ever. I told him I do not recall you ever advertising since the 90s. You don’t need to. All roads lead to you like Rome. My hat’s off to you for calling this panic again to the day. I find it curious why the TV shows, newspapers, none of them will quote you or tell the world what you have accomplished so consistently. This I have come to realize is confirmation of their own dishonesty for if they really report news, they should report you have done it again.

Will this be like 1987, 2000, and 2007? New highs yet again?

Your loyal follower for decades

PD

ANSWER: That is a good idea, I will update How to Trade a Panic. It’s about time I suppose.

Of yes, I remember 1987. I was so exhausted after doing three WEC three weekends in a row selling out each time. That’s when even the Presidential Commission wanted the research. It was a crazy yet fun time. I was thinner and had more energy back then.

Yes, we have not advertised since the early 1980s. Perhaps only after launch and everything is stable after setting up servers around the world. Will we see new highs again? Yes, of course!

This was a Panic Cycle Year I announced at the WEC. It was also 8.6 years up from the 2009 low. The market crashed right on target and it was also the Gold Benchmark target. Then it made the initial low on the Directional Change and bounced. Pretty standard. Hang on. The fat lady has not sung yet.

We still have the weekly numbers coming into play on Friday

Forecasting the Event – Not the People


COMMENT: The Superbowl forecast is bigger than you think.

I’ve been an avid reader of your blog for over 3 years now and your insights cured me of my gold buggery. Thank You again.
The most important part of your Superbowl post in my opinion was the following:

“The Triple Crown was a piece of cake because it is the event I was forecasting, not the horse.”

Despite being an avid reader of the blog for some reason I never put together the 51.6year wave on the Superbowls – as a lifelong football fan this is SO fascinating to me!

Last year’s Superbowl was arguably the greatest ever played – The Patriots were down 28-3 and came back in the 4th quarter to win. Tom Brady passed Joe Montana and Terry Bradshaw by becoming the only QB to ever win 5 Superbowls.

In many ways, this was the peak or turning point for the NFL. Amazingly the anthem protests exploded onto the scene 7 months later – RIGHT AFTER WE WOULD HAVE PASSED the 51.6year mark from the start of the 1st Superbowl! The anthem issue has had a drastic impact on ratings – this year’s Superbowl posted the lowest ratings since 2009!

Even more interesting to me is the first 51 years of the Superbowl era was dominated by a handful of dynasties (Packers in the 60s, Steelers in the 70s, 49ers in the 80s, Cowboys in the 90s, Patriots ever since). During the 52nd Superbowl – which is the 1st one post 51.6yr – the Eagles (who had never won a Superbowl before) took down the greatest dynasty of the last era! They did so against the greatest QB-Head Coach tandem in history and did it with their BACKUP Quarterback who was only playing because the starter had torn his ACL.

The Eagles became the first team in Vegas history to be an underdog in all 3 playoff rounds and win every game!
I mean those are some really amazing “coincidences” in my mind!

But, again, I felt that you hit the nail on the head when you said you were FORECASTING the EVENT and not the HORSE! It makes so much more sense when you look at it that way. There’s too many teams, too many players/coaches/refs, it’s hard to predict THEM but predicting the EVENT does appear possible. Just amazing stuff! I can see now how this correlates to markets – you aren’t picking the people your seeing the event and using history as a guide to tell you how people will react when the event unfolds!

Every American institution including the FBI, Hollywood, US Gymnastics, US College Sports, and even the NFL is falling apart. It’s all about 2032 and the breakup! If you can forecast the event than the collapse of these institutions isn’t surprising. It’s just unbelievable what you’ve uncovered.
My mom was a follower of Gann and watching her work with that growing up allowed me to see how great your work is as an adult. I wish she was still alive so I could share your work with her. As a 28 year old I feel your insights have provided me a leg up on the rest of my generation just because of the mindset you’ve presented on the blog.

Thanks again for everything!

TC

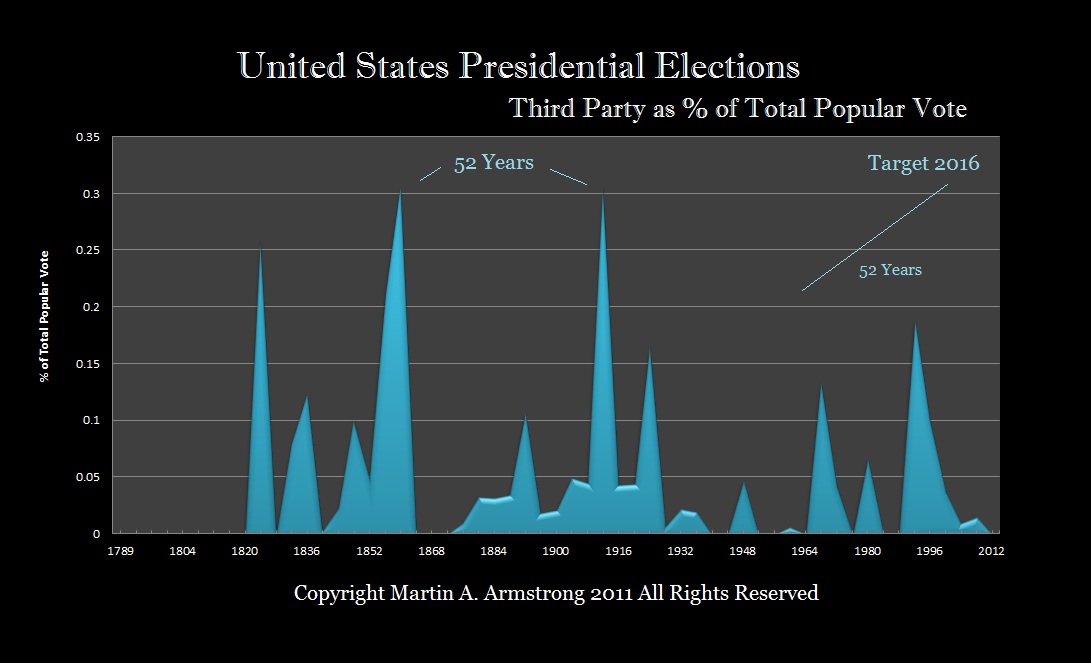
REPLY: Perhaps you are right. I have been doing this for a long-term so I am rarely surprised or impressed. I just expect it to unfold as shown. You are correct, I forecast the Presidential Election in 2016 back in 1985. I was forecasting the EVENT and not the people, such a Trump. Even when people criticise me, it is the person they are attacking, not the methodology. This is a cultural thing were we presume, quite strangely I might add, that humans are somehow capable to change the trend of the whole.

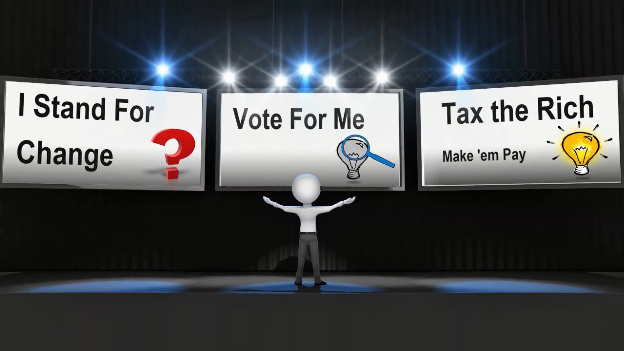
Politics always run for office promising something. They pretend as if they can change the trend irrespective of what is happening globally. The named shanty towns “Hoovervilles” during the Great Depression blaming President Hoover unfairly as if one man could have created such an event. He was unfortunately there at the wrong time. Trump became president simply because he was there at the right time.

It is not the people – it is the event.

Asset Allocation & Diversification


QUESTION: You do not believe in wide diversification?

ANSWER: No. Wide diversification is only required when the investor does not have a clue about what is going on in the markets. We have asset allocation models for Institutions who simply believe they must have some diversification. The main objective is to limit the areas they will take losses on because of diversification. Why buy government bonds when you know we are at a 5,000 low? I am sorry, but sometimes the allocation to a particular segment should be ZERO!

VIX Losses Feeding Collapse


QUESTION:

I have heard first hand from some significant players that do speaking engagements for very large pension funds that a product was being offered to the pension funds as a yield enhancer that was based around selling the VIX.   First off, why would anyone trust a product that is being offered by a big bank with a trading desk?  That is like CDO-slaughter-101 (circa 2007).  With vol going from 10-13 all the way up to near 50 think of the convexity in a 2-3 day period of time and the liability left on that one?  For who?  For the pension funds who were picking up scraps?   Makes me want to hurl when I think about our society cannibalizing itself.  Here is the pension fund space picking up scraps on some garbage VIX product and even worse the seller of the product knows exactly who, what, when and where. The VIX has been riding for a crisis for the last 6 months. Well – it’s here!

Today I heard from a pretty good source that “someone big’ was front-running someone else pretty big.  Now that fits like a hand in a glove doesn’t it?   That may have been a lot of what created today’s landmark slide and evaporation of liquidity.   Hoping to hear Mr. Armstrong’s comments or at least thoughts on this.   If correct, will the pensions bury this as they have all their other under performance?  Or will we see this in the form of heads rolling?  Either way its the widows and orphans that lose out when the pensions are unable to meet their obligations.   

This is getting very scary Mr. Marty!!!!

Very scary. 

CW

ANSWER:  It is always the same scheme. Back in the 1990s, the very same guaranteed enhancement of yield was pitched by the brokers. The scheme sold the 10-year against the 30-year bonds and capture the spread. With the leverage of 10:1+, applying that spread to the actual capital thus enhanced the yield.

Here they have been back with selling the VIX perpetually to take in the premium to enhance the yield. The same scheme is always pitched to institutions who then think the firms are smart and reputable so they take the advice. In the case of the bond scheme, that took down Orange Country in California and Merrill Lynch & Company had to pay $400 million in damages.

I was advising Temple University at the time. Merrill Lynch & Company was pitching the bond scheme for the Trust fund. The board told them to run it buy me. They were two you kids from Chicago who came to pitch the scheme to me. I told them the yield-curve would reverse and they would be wiped out. They returned to Chicago and flew back reworking their numbers telling me it would be a break-even if the yield-curve would flip. I told them I could not recommend the trade to the Board given this was their trust fund. They told the Board “I did not know the ‘new’ way to make money and I was too old fashion.” Temple did not buy into that scheme.

Selling the VIX has been the cash-pot and now this is in part creating the steep decline. I warned on the Private Blog that we were electing Daily Bearish Reversals “FASTER” from the high than we did back in 1987.

Horizons ETFs Announced Temporary Suspension of New Subscriptions for Units of BetaPro S&P 500 VIX Short-Term Futures™ 2X Daily Bull ETF (HVU) Toronto. They have announced today that it will not be accepting any new subscriptions for units of the BetaPro S&P 500 VIX Short-Term Futures™ 2X Daily.

The damage caused by this VIX trade will rise to the similar level as did Orange Country. The losses with this latest “guaranteed trade” sold by houses will be huge.

The Dow has made another new low as we expect on the Private Blog last night. We can see that we have broken the normal technical support on the daily level reflecting the real meltdown in the VIX Trade. With back-to-back Directional Changes, we may then see today’s low hold briefly. Make no mistake about this move, we are fulfilling what the model warned for 2018 which I announced at the 2018 WEC. This is a Panic Cycle Year and a sharp collapse was due from the January high.

What is also on point was that on the weekend, the Dynamic Models in the Global Market Watch turned on the Yearly Level stating:

IMPORTANT HIGH WATERFALL LIKELY

I personally am stunned that the GMW could flip that fast with just one-week of price action on the Yearly Level. This is the first time I have EVER witnessed such a change. Granted, it closed 2017 warning that the upward advance was “EASING” so, from a pattern recognition perspective, it seems to have done what no human analyst could possibly do.

We will address the entire issue in a special report.

Socrates on the Dow as of Last Friday


Socrates Analysis for the Dow Jones as of Last Friday – February 2nd, 2018


SOCRATES SUMMARY ANALYSIS

THE ANALYSIS PERSPECTIVE AS OF THE CLOSE OF Fri. Feb. 2, 2018: Dow Jones Industrials closed today at 2552096 and is trading up about 3.24% for the year from last year’s closing of 2471922. Thus far, we have been trading down for the past 5 days, while we have made a low at 2549066 following the high established Fri. Jan. 26, 2018, this price action warns of at least a pause in trend if not a retest of key support. Only a close above 2606180 would imply a retest of the previous high. Employing our Reversal System, our next Weekly Bullish Reversal to watch stands at 2581044 while the Weekly Bearish Reversal lies at 2474160. This provides a 4.14% trading range. Turning to the broader Monthly level, the current Bullish Reversal stands at 3081752 while the Bearish Reversal lies at 2241590. This, of course, gives us a broader trading range of a 27%.

The last event was a low established during 2009, which has been a nine year rally from that low to date.

A possible change in trend appears due come this month in Dow Jones Industrials so be focused. Last month produced a high at 2661671 and so far, we are trading neutral within last month’s trading range of 2661671 to 2474170. We need to breakout of this range to confirm the direction. Therefore, a close above will be bullish and a close below will warn of a possible decline.

Observing the near-term level, the market has closed up 282.0% from the last cycle low established during 2009, which has been only a 8 year rally from that event. However, from the long-term perspective, the market has still closed on the Yearly level up 4236.7% from the strategic low established during 1974, which has been a 43 year rally from that key event.

Our Daily level momentum and trend indicators are both bearish reflecting resistance forming at 2608612. Turning to the broader picture, our long-term trend is bearish while the cyclical strength indicator is bullish providing a mixed perspective of the market beyond the short-term.

On the weekly level, the last important high was established the week of January 22nd at 2661671, which was up 64 weeks from the low made back during the week of October 31st of 2016. We have seen the market drop shaply for the past week penetrating the previous week’s low and it closed beneath that low which was 2597465. This was a very bearish technical indicator warning that we have a shift in the immediate trend. We are still trading neutral on the Weekly Momentum Indicators and this is a warning that initial support has been breached. This strongly implies we should pay close attention now to the Weekly Bearish Reversals. If we begin to elect Weekly Bearish Reversals, then we are dealing with a more sustainable near-term correction.

Overall, looking at the weekly level on our models, this market is currently in a rising trend. We see here the trend has been moving up for the past 65 weeks. The last weekly level low was 1788356, which formed during the week of October 31st. The last high on the weekly level was 2661671, which was created during the week of January 22nd.

Critical support still underlies this market at 2241590 and a break of that level on a monthly closing basis would warn of a decline ahead becomes possible. On a broader perspective, this market remains in an uptrend posture on all our indicators looking at the monthly level. We see here the trend has been moving up for the past 29 months. The last monthly level low was 1537033, which formed during August 2015, and only a break of 2392190 would signal weakness ahead. The last high on the monthly level was 2661671, which was created during January.

Modi Has Sent More People Fleeing from India Than At Any Previous Time


Politicians just do not get it. They have convinced themselves that they can tax whatever they desire and people have no choice but to pay. Missing in their analysis are two influences (1) people just stop earning income for it reaches a point it is not worth working anymore, and (2) you simply pick-up and leave. Modi and his assault on the Indian economy has created a massive exodus of the upper class. India is also witnessing a massive migration of its rich headed mostly to the USA. They are number two on this net migration outward whereas China is the number one place the rich have been leaving. The latest statistics show that some 7,000 high net worth individuals left India which was a 16% increase over 2016 figures. France also saw net migrations outward when they went crazy raising taxes.

The same part of this trend has been a serious violation of human rights. If everyone is supposed to be equal, then why is it if you earn more than the average it is perfectly fine to hunt you down and discriminate against you because of your intelligence. If it is wrong to discriminate against someone who is mentally incapable of a normal life, then it should be equally wrong to prosecute people who are above average

Superbowl Forecast


COMMENT #1:

Hi Marty,

wow. Just wow. I read the blog post on the Superbowl coming up. You casually interpreted the Eagles plus Player Foles as more eligible for a win – cyclically. Additionally, according to bookmakers – the majority was wrong (as it must be). You did not specifically point that out, but casually dropped the bookkeeping numbers. So your regular readers would notice the majority being wrong.


So I am really impressed. I still do not understand your whole numbers game with the 8.6 and so forth. It would be amazing to have a blog post where this is condensed so that even an idiot like me could repeatedly look it up and understand.

Nevertheless, just knowing there are cycles and certain indicators as with the Superbowl already makes a huge difference in understanding.

Thanks, Marty, it is just so much fun learning with you.

All the best,

SP

COMMENT #2: Marty; You did this post so nonchalant I doubt you realize that it when you forecast such off the chart events, you are really demonstrating to the world that you are a force to be reckoned with. No wonder the government wanted your computer. It is absolutely amazing! Trump, Brexit, Russia collapse, Ukraine, coldest winter in ages, right down to the 13-year peak in flu you called for this year. All these things prove so much more than just forecasting gold or the Dow.


Thank you for the education. You are changing the way many of us think.


LR

REPLY: True, I just rushed that together given all the emails asking about who would win. The 41 v 33 victory for the Eagles was precisely on point. They were on a 37-year cycle like the Triple Crown and the Patriots hit Pi. Both those cycles effectively predicted who would be in the Superbowl. The analysis of the quarterbacks helped with Brady peaking on his 17.2-year cycle (2 * 8.6). Look at the correlations and trends, it all just came together that the Eagles would win and I knew that was a long-shot given all the betting out there. No, I did not bet. I was busy working on something else.


There is so much more to analysis than people care to look at and I suppose you are correct, forecasting these sorts of things makes people look at cycles even more as an answer

Socrates Got a Bit Overwhelmed Today


Well, today was a stellar day no less. We have load-balancer and multiple servers running, 6 to be exact, yet the volume into Socrates today was really over the top. We will clearly have to double the size once again since the site was jammed today. We are also splitting the system into servers in different locations around the world to try to handle traffic like it was today because this is just the beginning.

We apologize and hope your delays were not too bad. We will expand the systems once again and this was well beyond anything we ever imagined