Posted originally on Mar 25, 2025 by Martin Armstrong
Few know that Bill Gates heavily lobbied for the Inflation Reduction Act, which former President Joe Biden later admitted was intended to combat climate change and not inflation. Gates met with key lawmakers like Senator Joe Manchin ahead of the 2022 legislation. Another tool utilized by Gates was Breakthrough Energy, a venture fund he established in 2015 to promote net zero policies. The group recently laid off most of their employees in Washington, D.C., as Gates shifts methods for “climate” advocacy.
“We need to go from 51 billion tons of emissions per year to zero,” Breakthrough Energy stated on its website. “The only way to avoid the worst impacts of climate change is to reduce global greenhouse gas emissions from 51 billion tons a year, where they are now, to net-zero—and we need to do it by 2050. That means we need unprecedented technological transformations in almost every sector of modern life.”
Gates has every intention of continuing to push for net zero by 2050. However, Gates admitted that he needed to shift his policy amidst the new political landscape where he cannot directly influence policy. And what better way to do that than to throw money at the private sector. The focus is now on creating clean energy technology rather than manipulating public policy. Gates admitted he had to shift course because Donald Trump was revitalizing the energy sector and lifting restrictions on fossil fuels.
Breakthrough Energy and Gates are now focusing on Europe, where leaders are still on board with the Paris Accord. Instead of acknowledging that Europe’s economy is failing due to these initiatives, Breakthrough claims that key companies like Volkswagen, ThyssenKrupp Steel, Northvolt, and ACC Gigafactories are failing because Europe is not adopting clean energy fast enough.
“Europe is at a crossroads. In his analysis published in September 2024, Mario Draghi highlighted an “existential risk” and forecast Europe’s “slow agony” if it doesn’t radically change course to reverse declining productivity, investment, and innovation. Recent announcements only seem to confirm this dire prediction: industries are reducing production across Europe (Volkswagen, thyssenkrupp Steel); announced investments are being cancelled or put on hold (Northvolt, ACC Gigafactories), and industrial output in Europe’s four largest economies is declining, with Germany, France, Italy and Spain having recorded a year-on-year drop in the production of capital goods and consumer durables.

There is no denying it: Europe is in crisis, one in which its established industrial base is eroding while new sectors fail to get off the ground. This is particularly concerning for cleantech where Europe’s ambitions are high, but the economic realities are sobering. As the recent bankruptcy of Northvolt reminds us, even with solid industrial policy in place, it is hard to scale up in Europe. Turning this situation around will be one of the overriding priorities of the new European Commission, which has recently unveiled the Competitiveness Compass and will soon produce the Clean Industrial Deal, two new (long overdue) economic and industrial policy programs. In a volatile security and fractured geopolitical environment, with looming threats of trade wars and deepening systemic competition, European policymakers have their work cut out for them.”
The European Commission welcomes Gates’ proposal and believes it can perpetually spend to achieve net zero by 2050. I explained in another blog post how scientists have stated that this goal is IMPOSSIBLE. Moreover, the World Economic Forum has pushed the EU to create the Clean Industrial Deal (CID) through a €100 billion spending package. It is no conspiracy to point out that globalist organizations are pushing Europe into economic ruin.
Posted originally on Mar 23, 2025 by Martin Armstrong
COMMENT: Marty, Here in Alaska, we have been put on alert that Mt Spurr may erupt soon. Your computer has been remarkable projecting these trend of rising volcanic activity here in 2025 and we are still in the first quarter. Do you have any historical analysis of Mt. Spurr?
Rob
REPLY: Mount Spurr, a stratovolcano in Alaska’s Aleutian Arc, had no confirmed historical eruptions that have been documented in human records prior to its significant 1953 eruption. However, geological studies reveal prehistoric activity:
Holocene Eruptions:
The most recent major eruptive period occurred approximately 8,000–9,000 years ago, involving pyroclastic flows and lava dome formation that shaped the current structure of the volcano. These eruptions were identified through tephrochronology and radiocarbon dating of volcanic deposits.
Late Pleistocene Activity:
Evidence suggests earlier eruptions during the late Pleistocene, though precise dates are less well-constrained. These events contributed to the volcano’s formation and growth.
It is under watch right now for a possible eruption. Before 1953, Mount Spurr’s eruptions were prehistoric, with no written records or observations. Mount Spurr’s prehistoric eruptions are primarily studied through geology, but their ash layers provide valuable tools for archaeologists.
The 1953 eruption of Mount Spurr in Alaska was classified as a VEI 3 (Volcanic Explosivity Index 3) event. This eruption on July 9, 1953, produced a significant Plinian ash column reaching approximately 21 km (70,000 feet) in height. However, the volume of erupted material (tephra) was estimated at around 0.021 km³, placing it within the VEI 3 range (0.01–0.1 km³).
There were earthquakes in 2004 and debris flows by 2005. That was 51 years from 1953. Since this should be fractal, I would suspect there was probably a big one around 5200 years prior. This could be building to a big one above VEI 5 by 2031/2032. It should be coming alive here of the 72-year cycle from 1953 which brings us to 2025. We may still be looking at a VEI3 or VEI4 for that would leave the door open for a bigger one by 2031/2032.
For comparison, Mount Spurr’s 1992 eruption was rated VEI3/VEI 4, with a slightly higher tephra volume (-0.055 km³) and a plume height of 14 km. The distinction underscores that VEI considers both eruptive volume and secondary factors like plume height and eruption duration. The 1953 event, while explosive and impactful, did not meet the volume threshold for VEI 4.
Understanding the VEI
Each VEI level represents a tenfold increase in erupted material (e.g., VEI 4 is 10x larger than VEI 3). Higher VEI eruptions produce taller plumes, injecting ash and gases into the stratosphere (VEI 5+ can affect global climate). More significant eruptions (VEI 5+) are less frequent but more destructive.
VEI 7: Tambora (1815) ejected 160 km³ of material into the atmosphere, thereby reducing global temperatures by -3°C, known as the Year without a Summer in 1816.
VEI 6: Pinatubo (1991) released 10 km³, causing global cooling by -0.5°C.
VEI 5: Mount St. Helens (1980) erupted 1 km³, but did not alter the climate yet it was devastating 600 km²
Posted originally on Mar 17, 2025 by Martin Armstrong
QUESTION: NASA believes that this next solar maximum will be less than the last. Do you agree with that, or should I ask Socrates to agree with that? My second question is the coming asteroid. They say it will hit the earth in 2032. Is that part of Socrates’ forecast?
Fred
ANSWER: Well, as for the asteroid hitting the Earth in 2032, they are playing it down really hard, like it has less than 3%. However, they are already looking at ways to try to destroy it because the odds are much higher than they are telling you. All I can say is that the 8.6-year cycle functions on a fractal basis, and it is extremely accurate. The precession of the equinox is nearly 25,800 years in duration, and that is 3 x 8.6. The fact that this is arriving in 2032 may simply be destiny and part of the universe’s timing.
Now, as to the next solar cycle, we show it should arrive here in 2025, but our computer disagrees with NASA, and it should be stronger than the last. This is the trend into 2032 for solar energy to intensify, meaning more significant flares and possible disruption to power grids, etc. This will be part of the trend into 2032 that will also impact the commodity markets.
Posted originally on Mar 14, 2025 by Martin Armstrong
COMMENT from Italy: Dear Mr Armstrong,
I just read your topic on volcanoes and cooling weather Please note:
Etna is erupting, slowly Stromboli had a small eruption last year with earthquake On 13march on Campi Flegrei, “caldara” where Vesuvio is Located, had an earthquake of magnitudo 4.1
Thus it seems all italian volcanoes have signs of “life”…: Etna, Stromboli, Vesuvio, Vulcano
Campi Flegrei: il terremoto del 13 marzo 2025 (Md 4.4) e il punto sul bradisismo
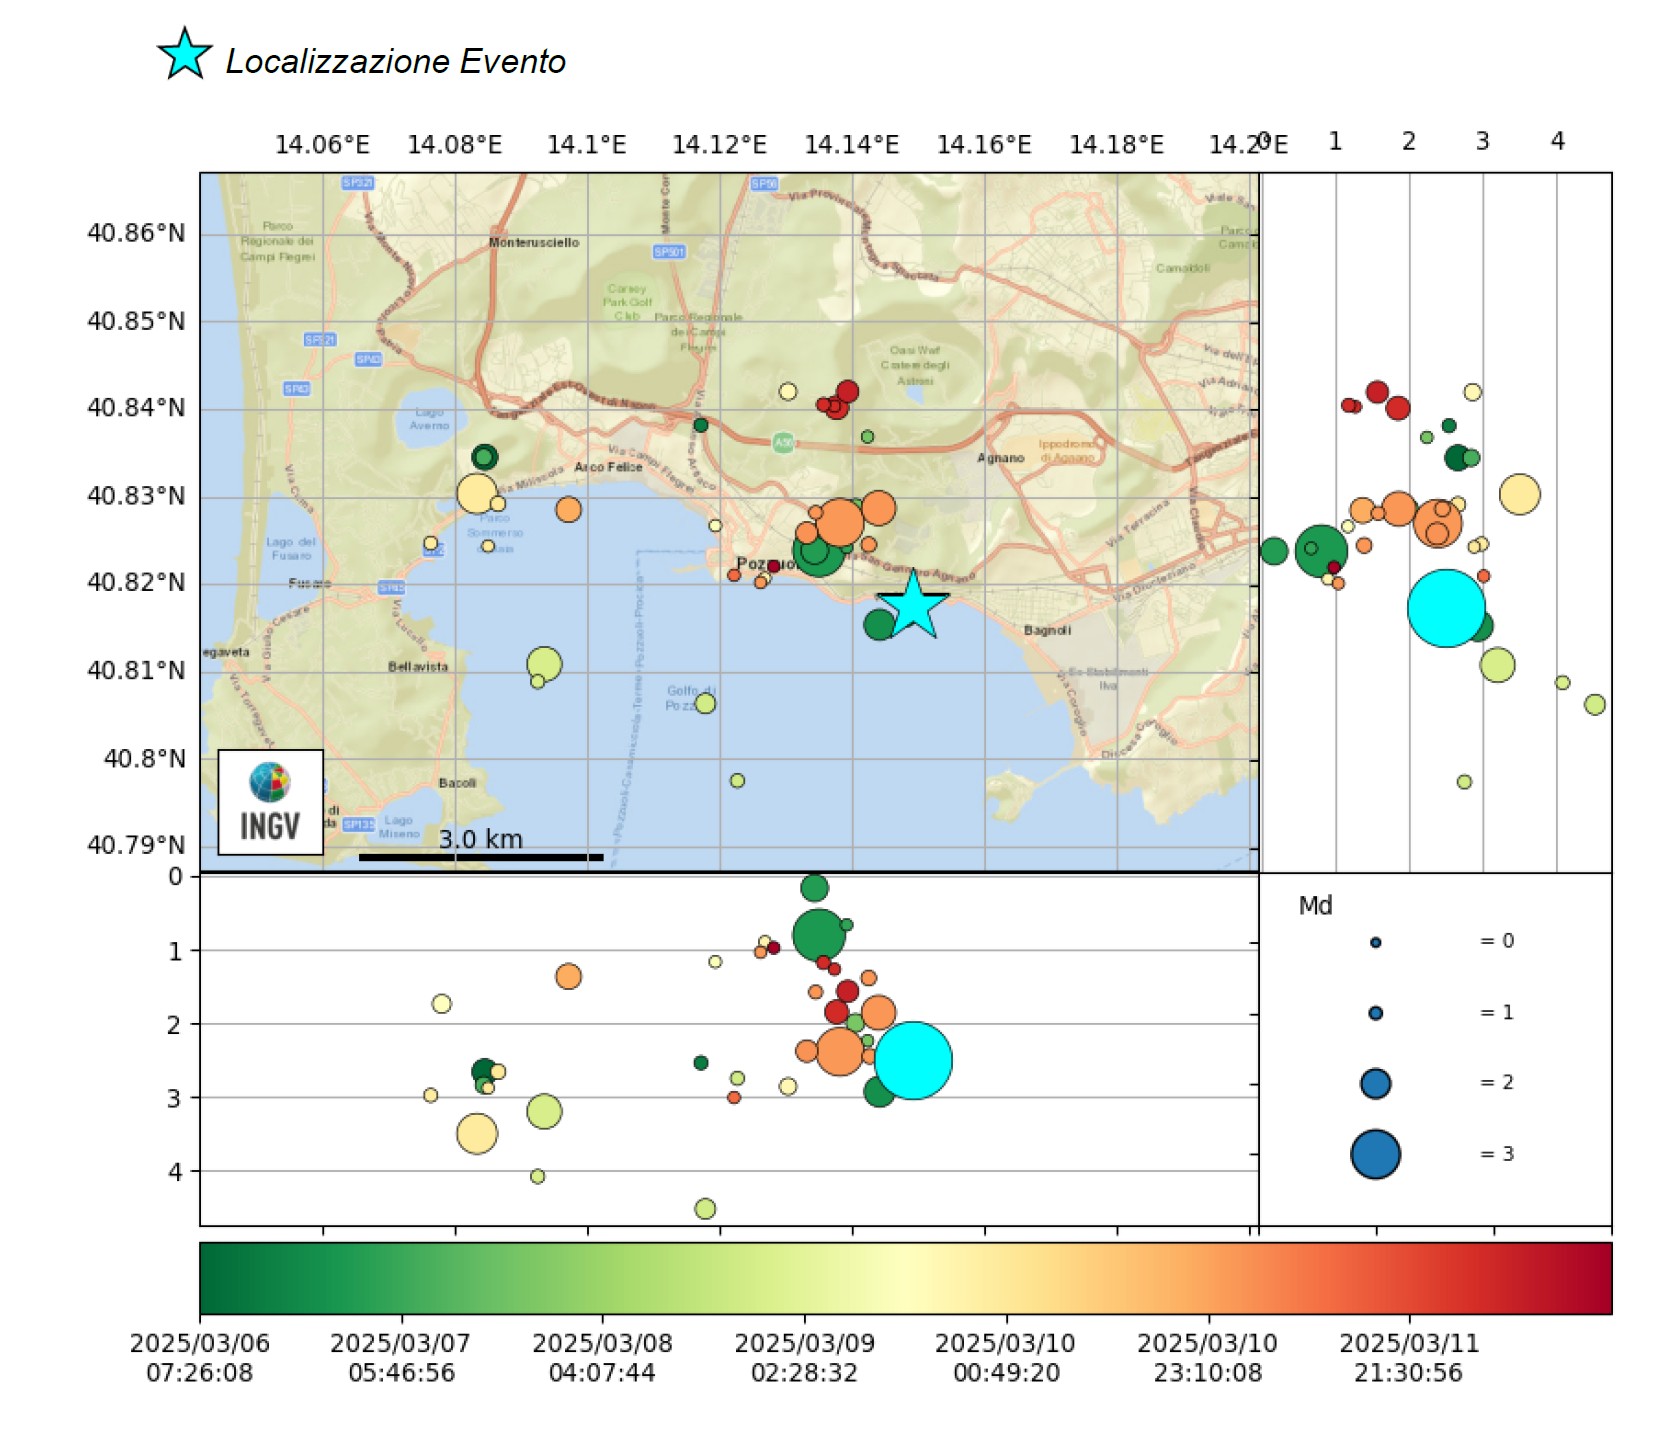
Alle ore 01:25 italiane di ieri, 13/03/2025, la Sala di Monitoraggio dell’Osservatorio Vesuviano – INGV ha localizzato un evento sismico di magnitudo preliminare Md 4.4±0.3, nell’area dei Campi Flegrei, lungo la costa del Golfo di Pozzuoli (La Pietra – Dazio) e molto vicino al popoloso quartiere di Bagnoli (Figura 1).
Figura 1 – Mappa della sismicità dei Campi Flegrei tra il 6 marzo e il 13 marzo 2025: sono riportati solo i terremoti di magnitudo M ≥ 1.0. La dimensione dei simboli è proporzionale alla magnitudo, come indicato nel riquadro in basso a destra. La stella e il cerchio turchese indicano l’evento di Md 4.4 del 13 marzo 2025.
Il terremoto che ha fatto vibrare l’intera area metropolitana dei Campi Flegrei e molti quartieri della città di Napoli è avvenuto ad una profondità di circa 2.5 km. Da quel momento è iniziato uno sciame sismico, conclusosi nella notte tra il 13 e il 14 marzo, con un totale di 44 eventi con magnitudo ≥ 0 di cui solo 9 con magnitudo Md tra 1.0 e 1.7.
Come già riportato in molte altre occasioni, la sismicità dell’area dei Campi Flegrei è strettamente correlata alla dinamica vulcanica e in particolare alle fasi di deformazione e sollevamento del suolo (parte del fenomeno noto come bradisismo). L’attuale crisi bradisismica, iniziata nel 2005, ha finora prodotto un sollevamento massimo di circa 140 cm nell’area centrale della caldera, misurato in una piccola area a 500 metri a sud del Rione Terra (Pozzuoli).
Nel passato si sono verificate altre fasi di sollevamento del suolo accompagnate da sismicità, le più recenti delle quali nei periodi 1969-1972 e 1982-1984. I terremoti di maggiore energia nel corso di quelle crisi furono registrati il 4 ottobre 1983 e il 14 marzo 1984 entrambi con una magnitudo Md pari a 4.0. E vale la pena ricordare che la seconda fu caratterizzata da una sismicità talmente intensa da provocare gravi danni agli edifici di Pozzuoli ed una parziale evacuazione dei suoi abitanti.
Durante l’attuale crisi bradisismica, i maggiori eventi sismici sono stati registrati il 27 settembre 2023 (Md 4.2), il 2 ottobre 2023 (Md 4.0), il 20 maggio 2024 (Md 4.4) e il 26 luglio 2024 (Md 4.0), le cui localizzazioni sono mostrate in Figura 2, insieme con quelle degli eventi di magnitudo M ≥ 3.0, a partire dal 1983. Occorre sottolineare che seppure negli ultimi 10 anni sia stato osservato un aumento del numero e dell’energia degli eventi registrati, essi mostrano in grandissima parte (circa il 97%), una magnitudo ≤ 1.0.
Figura 2 – Mappa degli epicentri localizzati dalla Rete Sismica dell’Osservatorio Vesuviano dal 1983 ad oggi, incluso l’evento del 13 marzo 2025 (stella turchese), relativa ai terremoti di magnitudo M ≥ 3.0. A destra della mappa, le proiezioni degli ipocentri orientate nord-sud; in basso, orientate est-ovest (il cerchio turchese indica l’evento di Md 4.4 del 13 marzo 2025. La dimensione dei simboli è proporzionale alla magnitudo, come indicato nel riquadro in basso a destra.
La situazione attuale (febbraio – marzo 2025)
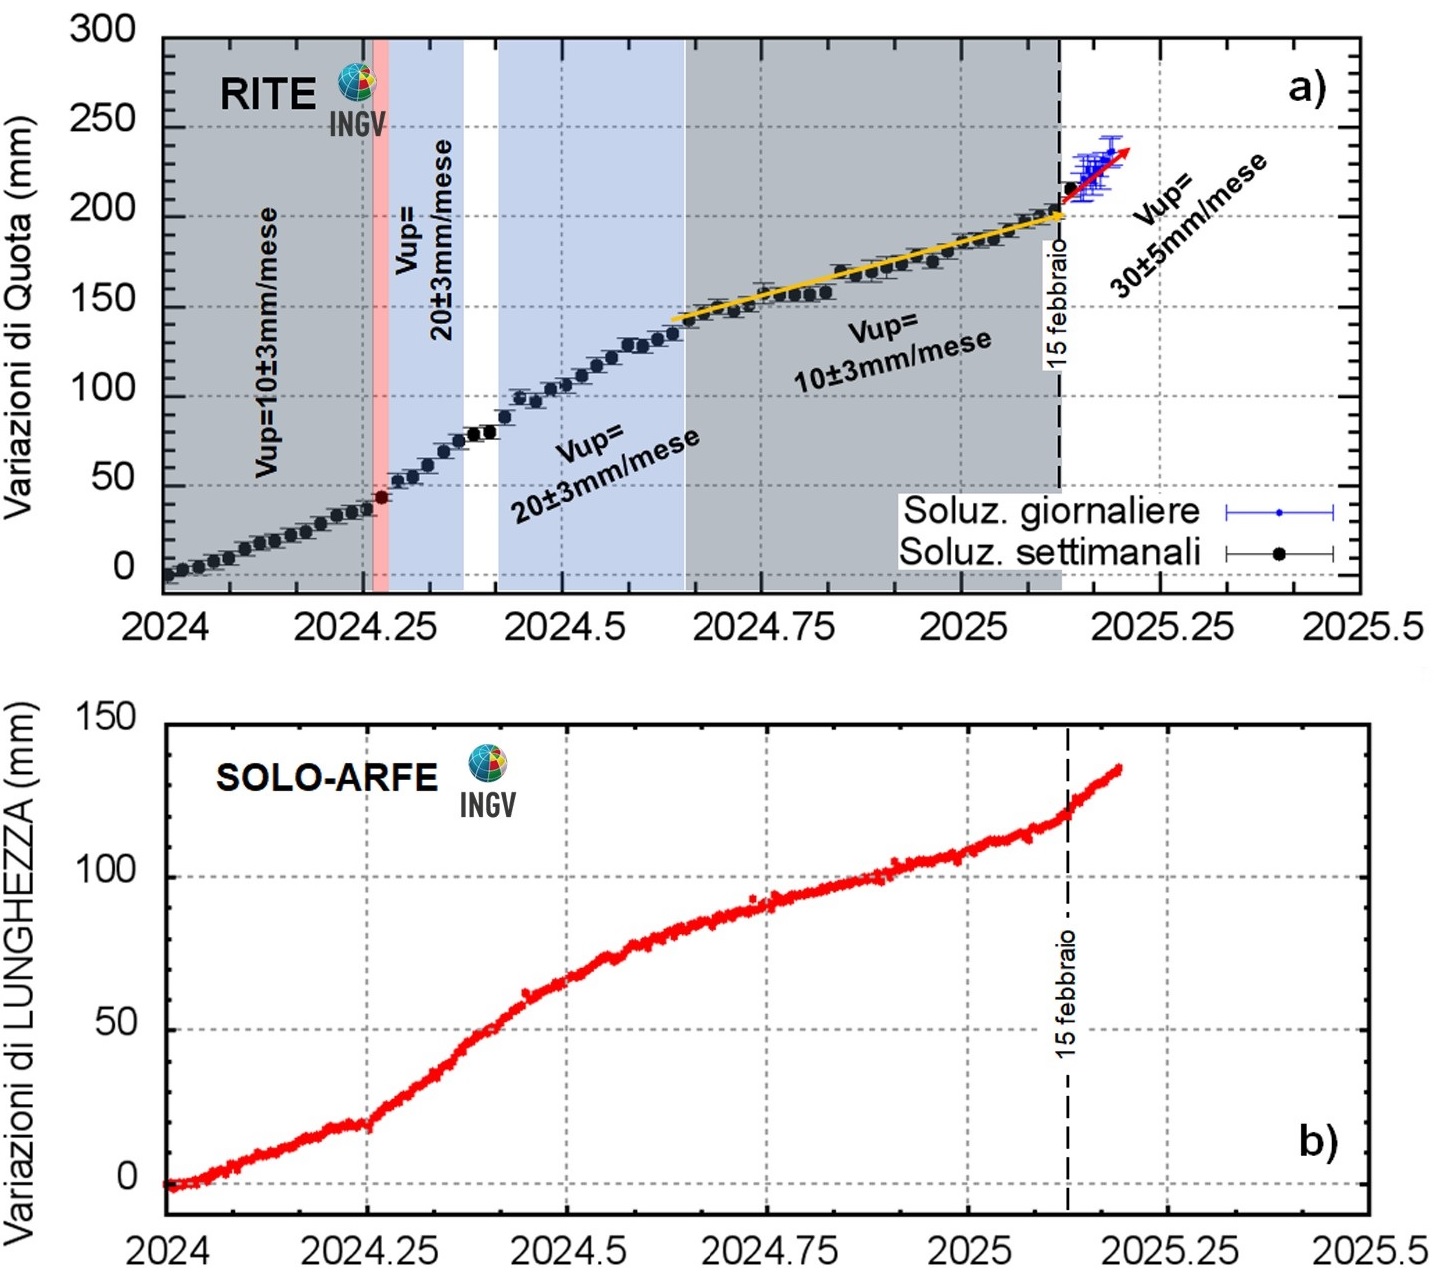
Nelle ultime tre settimane, la velocità media di sollevamento del suolo nella zona di massima deformazione in prossimità del Rione Terra a Pozzuoli, si è attestata intorno ad un valore preliminare di ~30±5 mm/mese (come indicato nel bollettino settimanale dei Campi Flegrei, 3-9 marzo 2025). Un esame dei dati presenti nel Bollettino mensile di febbraio evidenzia che: a) nei mesi precedenti, da agosto 2024, la stessa zona, al centro della caldera, aveva mostrato un tasso di sollevamento medio di ~10 mm/mese; b) solo durante la seconda metà di febbraio 2025 tale valore era salito a ~15±5 mm/mese (Figura 3).
Figura 3 – (a) Serie temporale delle variazioni in quota della stazione GNSS della stazione del Rione Terra, Pozzuoli (RITE) dal 01/01/2024 al 10/03/2025; (b) Variazione di lunghezza della baseline SOLO-ARFE (Solfatara – Arco Felice) dal 01/01/2024 al 10/03/2025.
Nel quadro generale in cui deformazioni e sismicità ai Campi Flegrei continuano a essere strettamente associate, il terremoto di magnitudo Md 4.4 di ieri si inserisce in un contesto di tasso di sollevamento in rapido aumento che invece non era stato rilevato in occasione dell’evento di pari magnitudo del 20 maggio 2024. Quell’evento era infatti avvenuto in condizioni di deformazione progressiva e continua, a testimonianza del fatto che non c’è relazione diretta tra velocità di sollevamento del suolo e magnitudo e che, se fosse necessario ribadirlo, non è possibile stabilire né quando i terremoti arrivano né quale intensità avranno.
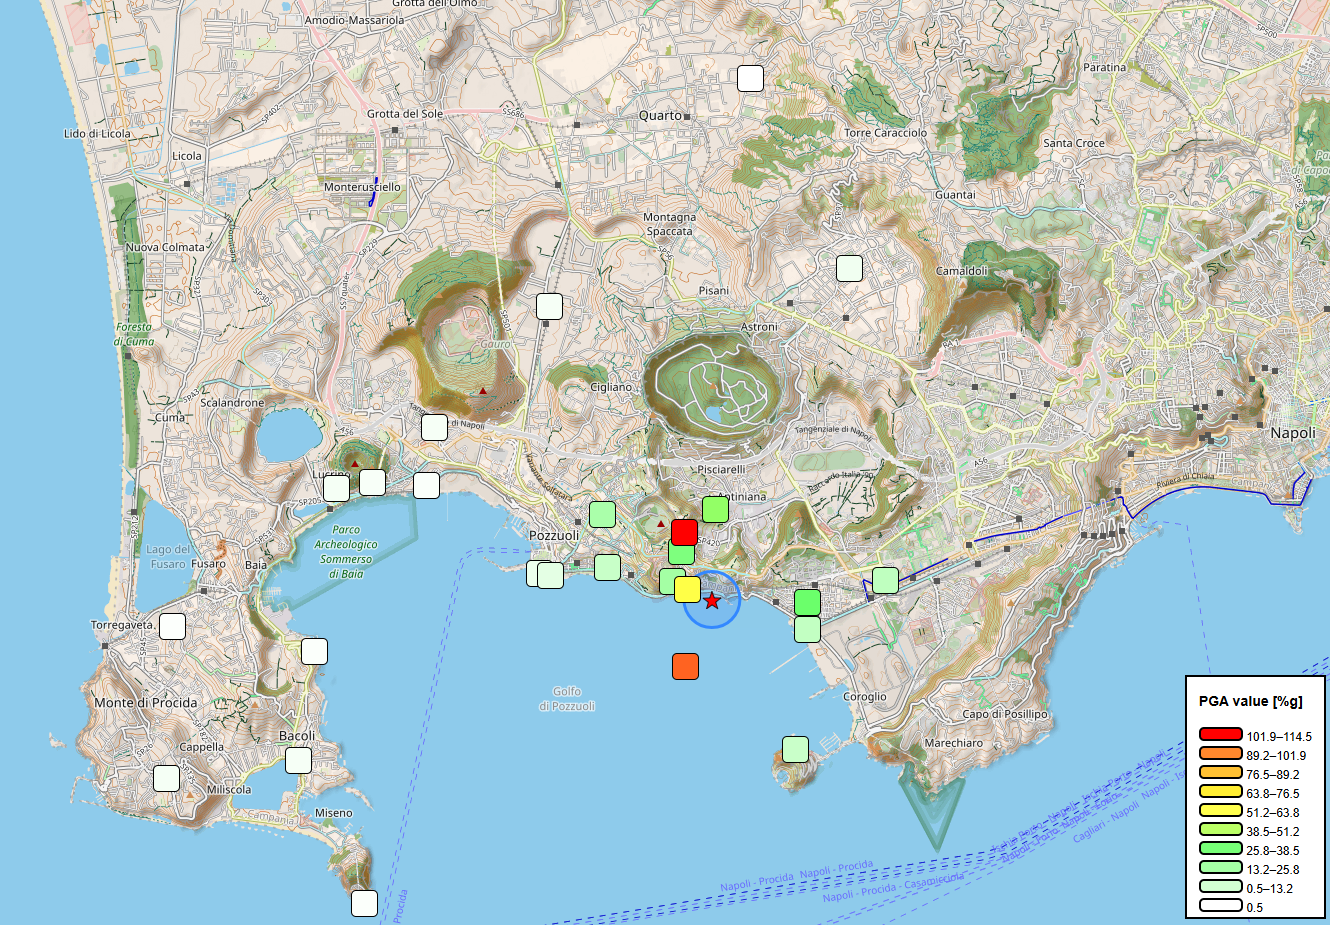
Grazie alla recente implementazione e al completamento di una rete accelerometrica, che comprende sia stazioni a terra sia stazioni installate sul fondo del Golfo di Pozzuoli, da alcuni mesi e in occasione di eventi sismici rilevanti, si pubblicano mappe di scuotimento che riportano i valori delle accelerazioni del suolo, espresse in percentuale dell’accelerazione di gravità. Tali mappe sono prodotte per diverse zone dell’area flegrea e ne è stata realizzata una per l’evento di magnitudo Md 4.4 di ieri (Figura 4), su cui si osservano valori di accelerazione molto alti, tra 0.6 e 1 g (dove g è l’accelerazione di gravità), soprattutto verso il bordo della Solfatara e Pozzuoli, verso mare e verso est, in direzione della collina di Posillipo e della città di Napoli.
Pur con taluni caratteri di direzionalità, il terremoto di ieri è stato risentito in una vasta area che va da Bacoli a ovest fino ai quartieri orientali di Napoli in prossimità dell’area vesuviana, e in vari Comuni presenti nei quadranti NE-N-NW dell’area napoletana, fino a Giugliano e Marano. Lo si evince con una certa facilità dalla mappa dei risentimenti ottenuta grazie ai dati raccolti attraverso i questionari di “Hai sentito il terremoto?” che mostrano risentimenti stimati, al momento, fino al V grado MCS (Figura 5).
Figura 5 – Mappa dei risentimenti ottenuta grazie ai dati raccolti attraverso i questionari di “Hai sentito il terremoto?”, aggiornamento del 14/03/2025.
Eruzione imminente?
Sebbene da molti mesi si continuano a registrare variazioni fluttuanti e variabili, ma sostenute, di alcuni parametri quali la velocità di deformazione del suolo e l’emissione di CO2, gli altri parametri rilevati dal sistema di monitoraggio dell’Osservatorio Vesuviano-INGV nel suo complesso, non mostrano al momento evidenze dell’imminenza di una eruzione vulcanica, soprattutto alla luce di un’analisi di tutti i parametri geofisici e geochimici nel loro complesso. Non ci sono, ad esempio, segnali sismici che indichino il movimento di magma verso la superficie né anomalie geofisiche e geochimiche tali da indicare una perturbazione del sistema idrotermale. Gli scenari che possiamo aspettarci nel breve termine vanno, quindi, inseriti nel quadro geofisico che la caldera dei Campi Flegrei mette in luce da tempo: la sismicità proseguirà fin quando sarà in atto il sollevamento del suolo e i terremoti di energia confrontabile con quella del terremoto odierno, o di poco superiore, saranno ancora possibili. Restano possibili una intensificazione della crisi bradisismica come pure una sua diminuzione, con un passaggio da sollevamento a subsidenza (così come avvenuto nelle crisi del secolo scorso).
Cosa sta facendo l’Osservatorio Vesuviano in queste ore?
Nonostante l’evento sismico sia avvenuto a soli 2.5 km in linea d’aria dalla sede dell’Osservatorio Vesuviano, con inevitabile coinvolgimento anche del personale di turno nella notte, l’intera procedura organizzativa che garantisce le comunicazioni previste verso gli organi di Protezione Civile, nei suoi vari livelli, e verso la popolazione, si è svolta secondo gli standard previsti. Inoltre, nelle settimane passate, così come nei giorni che hanno preceduto l’evento sismico della scorsa notte, i vari gruppi di ricercatori dell’Osservatorio Vesuviano con compiti di monitoraggio hanno intensificato le campagne di misura di tutti i parametri fisici e chimici utili alla definizione del fenomeno in atto.
REPLY: Yes, there is an extraordinary number of volcanoes starting to come alive. Campi Flegrei is a serious supervolcano.
We will input all the recent activity and see what the computer comes up with.
Posted originally on Mar 14, 2025 by Martin Armstrong
QUESTION: Marty, Socrates is just amazing. You have been correlating agriculture and climate as volcanoes that produce major global cooling events. Well, just an observation: Many volcanos are becoming active or erupting simultaneously. Do you see a volcanic winter in the cards?
Sam
ANSWER: There is about a 309.6-year cycle to the big ones that result in volcanic winters. However, that begins with the 43BC eruption Okmok II in Alaska. There is a lack of data that prevents an accurate forecast of such events. However, if we look at just recent recorded events from the 1257 eruption of Samalas volcano on Lombok Island, Indonesia, there appear to be events of this nature on the half-cycle so about 154 years or so. This event of 1257 is now recognized as one of the largest volcanic eruptions of the Holocene epoch.
We have three main sources: Ice Core Data: Sulfate spikes in ice cores from Greenland and Antarctica date to around 1257–1258. Tree rings from 1258–1260 in regions like Europe and North America suggest prolonged cooling and reduced growing seasons. Historical Records from Medieval chronicles, both from Europe and Asia, describe extreme weather in 1258–1259, including unseasonable cold, heavy rains, crop failures, and famines. The English records recorded this as the “year of famine” with widespread starvation. Interestingly, this is why our database on Wheat began in 1259. Because of this crisis, people started to record prices.
This is why I have warned about simultaneous eruptions. There was also a smaller eruption around 1227 (traced to another tropical volcano) may have compounded cooling effects earlier in the century. Thus, this major event may have magnified the volcanic winter.
A giant volcano in Alaska is showing signs of an impending eruption. Significantly elevated levels of volcanic gas emissions were recently observed around Mount Spurr, which is located 75 miles from Anchorage and is home to nearly 300,000 people. The Alaska Volcano Observatory (AVO) said the emissions ‘confirm’ that new magma is flowing beneath the volcano, indicating a foreseeable eruption.
Small earthquakes were detected at Mount Rainier, Mount St. Helens, and Mount Hood during the past week. These are the Cascade Range. We did have the “Volcan de Fuego,” or Volcano of Fire, blowing a thick ash cloud, seen from Palin, Guatemala, on Monday, March 10, 2025. This is more of my concern. Numerous volcanoes can have an accumulative effect.
I can say that a low in 2025 points to higher prices ahead.
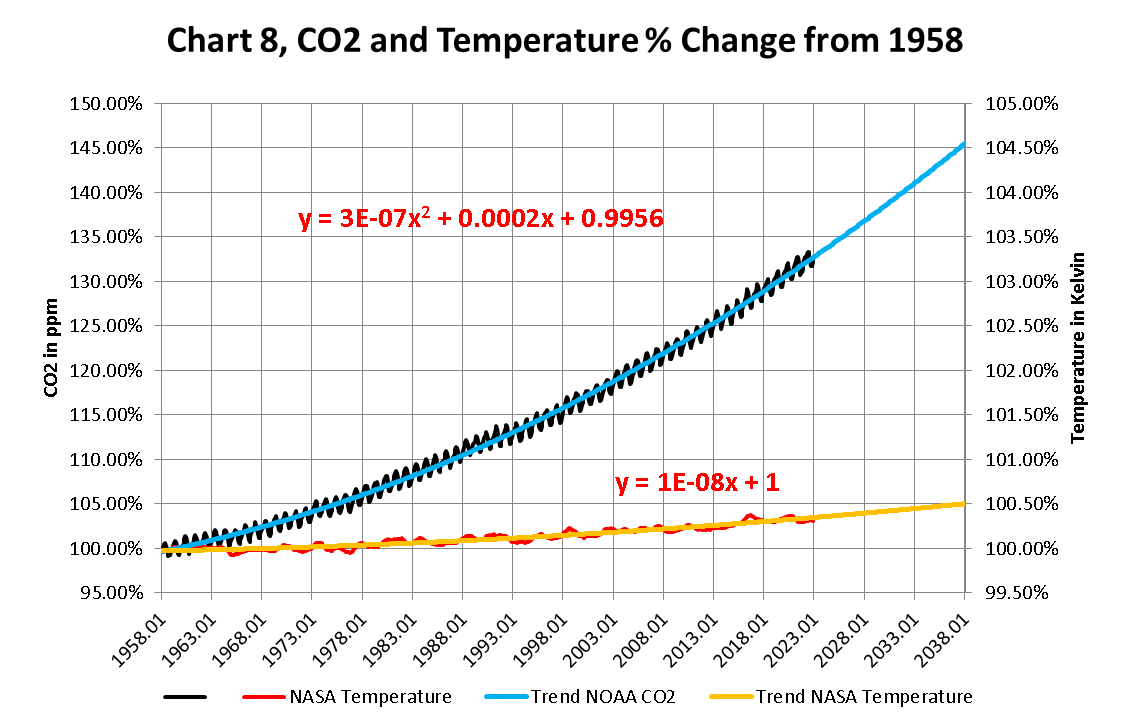
The attached report on Global Weather for January 2024 Data has charts showing the relationship between CO2 growth and Temperature increases going up since we started to accurately measure CO2 in the atmosphere in 1958. These Charts were created by showing CO2 as a percent increase from when it was first measured in 1958, the Black plot, the scale is on the left and it shows CO2 going up by about ~34.0% from 1958 to January 2024. That is a very large change as anyone would have to agree.
Now how about temperature, well when we look at the percentage change in temperature also from 1958, using Kelvin (which does measure the actual change in heat), we find that the changes in global temperature (heat) is about ~.3% and may reach .5% by 2028. To even be able to see this minuscule change we had to reduce the scale of the Temperature Axis by a factor of ten.
This Chart 8 uses unaltered values from NOAA and NASA properly displayed ,and the Blue and Yellow projections are created by Microsoft Excel not me.
The NOAA and NASA numbers tell us the story of the Very Small Changes in the temperature of the planets Atmosphere As Carbon Dioxide goes up geometrically.
Posted originally on Feb 26, 2025 by Martin Armstrong
Imagine handing a $2 billion grant to an organization that produced $100 in revenue. This is precisely what happened under Joe Biden’s watch when the EPA approved a $2 billion payout to yet another climate-related non-profit that acted as a political slush fund for the liberal elite. There is NO possible way to defend this blatant corruption.
Power Forward Communities is a non-profit climate activism organization linked to Biden chorine Stacey Abrahms. I will never refrain from repeating that the INFLATION REDUCTION ACT WAS A CLIMATE CHANGE SLUSH FUND. Joe Biden admitted the entire premise of America’s largest spending package was all designed under the guise of climate change. The people were completely deceived into believing the act would address inflation. The new administration is continuing to peel back the layers of where the funds from that $2.7 trillion package actually went.
Once more, the Inflation Reduction Act went beyond Biden and the US. Former Treasury Secretary Janet Yellen admitted the truth behind the Inflation Reduction Act as well: “The Inflation Reduction Act is, at its core, about turning the climate crisis into an economic opportunity,” Yellen clearly stated. It provided the government with an opportunity to eliminate our energy independence. We did not have an energy crisis before Joe Biden took office. His campaign was built around the globalist BUILD BACK BETTER agenda to sacrifice one’s nation to usher in the Great Reset. The World Economic Forum put it in writing that knocking down America was part of the plan, and people still voted for Biden. Then everyone acted surprised when he plummeted our nation’s economy as if that wasn’t his platform from the beginning.
Over $360 billion from the Inflation Reduction Act was set aside specifically for climate change initiatives. Where are those funds now? So far, it seems the money spent was funneled through various agencies linked directly to the Democrats. Grants were not awarded based on merit but recklessly handed out to whoever had their hand out. The majority of these so-called non-profits have done very little with the money they were awarded, as transparency was intentionally avoided.
The Environmental Protection Agency’s Greenhouse Gas Reduction Fund, created through the Inflation Reduction Act, deemed it necessary to pay Power Forward $2 billion. Now, EPA Administrator Lee Zeldin revealed that his agency awarded eight different climate agencies a total of $20 billion under Biden. Project Veritas filmed a former EPA employee explaining how they were directed to spend as much as possible before Trump took office, comparing their actions to throwing gold bars off the Titanic.
Stacey Abrams serves as senior counsel at Rewiring America, one of the founding groups of Power Forward Communities. This woman has a track record of financial mismanagement. Abrahms was $200,000 in debt back in 2018 before her net worth grew to $3.17 million by 2022. Abrahms admitted that she accumulated hundreds of thousands in debt due to student loans, credit card debt, and back taxes because rules for thee but not me. Still, they insisted she could manage the budget of the state of Georgia during her failed bid for governor. Her refusal to concede made her an activist figure for the left, and she profited off her political celebrity status. But did she EARN her millions?
Power Forward has done nothing thus far but suddenly wants to spend $539 million in the coming weeks on energy-efficient housing. Zeldin would like that money back. The taxpayers should demand that the money be returned. Imagine if Donald Trump awarded $2 billion to an organization that earned less than a child’s lemonade stand and had connections to a conservative ally? The absolute corruption of the past administration is unbelievable as they robbed the public blind for climate, migrants, war, and personal gain.
Posted originally on Feb 20, 2025 by Martin Armstrong
QUESTION: Marty, Your computer warned that we would be heading into global cooling, not warming. But you also warned that we would see increased volcanic activity and the risk of a volcanic winter. Well, this has been the coldest winter I can remember. With Mt Spurr stirring, another offshore from California, and some hinting at Yellowstone erupting, do you have any update on this aspect from Socrates?
Darby
ANSWER: Nothing has changed. We are heading into a more active volcano period, and that does raise the risk of a volcanic winter in which crops fail, and there will be a shortage of food. I still recommend that you stockpile two years’ worth of food. It is not that you will save money, but that the supply may be seriously diminished. Our models of Wheat warn that this year is the Directional Change, and we can see a shortage into 2028.
However, there are rising concerns about the Supervolcano in Italy that appears to be coming to life. A 4.4-magnitude earthquake struck Italy’s Campi Flegrei supervolcano Monday evening. It was at a depth of 3 kilometers, which is the strongest earthquake to hit the area in the past 40 years, according to INGV data. The quake is part of an ongoing “seismic storm” that has seen over a dozen events over 2.0 magnitude in the past 48 hours. The eruption of Mr Vesusius, who buried Pompeii in 79AD, is related to this region. As far as Yellowstone Supervolcano is concerned, it has been showing some more minor activity, but nothing major just yet.
During January 2025, the University of Utah Seismograph Stations, responsible for the operation and analysis of the Yellowstone Seismic Network, located 56 earthquakes in the Yellowstone National Park region. The largest event of the month was a minor earthquake of magnitude 3.7. I would be more concerned about Italy just yet.
There are a number of Supervolcanoes around the world and perhaps the most recent one to erupt was in Italy. The term Supervolcano has been popularized by the BBC and the Discovery Channel story on Yellowstone back in 2005. According to the United States Geological Survey (USGS), a supervolcano is any volcanic center that has explosively erupted at least 1,000 cubic kilometers (240 cubic miles) of fresh volcanic material in a sudden, violent manner – in a so-called supereruption – often producing a huge depression crater named a caldera. Currently, Italy’s Campi Flegrei volcano has been showing signs for the first time in nearly 400 years that it is still alive and well and capable of making a lot of people experience a very bad day.
Aside from Yellowstone, the largest volcanic eruption in the Northern Hemisphere in the past 100,000 years has been attributed to a Supervolcano, which erupted some 39,400 years ago in what is known as the Phlegraean Fields by Naples, Italy. This has been documented from several sources. The ashes from this eruption were distributed over the entire eastern Mediterranean and up to central Russia. This was a huge event that clearly also produced a Volcanic Winter, and that is what is the worst thing for the rest of the world who resides at a safe distance from the actual Supervolcano.
We are beginning to witness a rise in volcanic activity as we enter solar minimum. Hopefully, we are not facing a catastrophic volcanic winter period. But it also does raise some concerns that a pole shift can be far more rapid than previously anticipated. I believe that people prefer to assume uniformity rather than a catastrophe. A stalagmite-based paleomagnetic record of the post-Blake excursion reveals details of repeated polarity drifts have occurred during periods of low geomagnetic field intensity at 100 thousand years before present around the time of this Naples eruption. One surprisingly abrupt centennial reversal transition occurred in 144,000 provides unprecedented evidence that raises fundamental questions about the speed of geomagnetic field shifts. Such rapid polarity changes could severely affect satellites and human society in the future if the current geomagnetic field intensity continues to decrease.
We have a pole shift, climate change, and volcanic eruptions seem to be interlinked on a correlated basis. Our correlation models have warned that this is something that needs to be investigated. For the first time, laying out this record produces what appears to be a single geological archive creating a precise chronological order. These types of events can take place in the space of even just a single decade.
The recent events at the Campi Flegrei volcano have provided a warning sign for the first time in nearly 400 years. The ground at the caldera’s center has bulged by 4 meters, warning that lava is collecting again. This uplifting interestingly began in 1985 with this ECM wave. Keep in mind that the eruptions at the Supervolcanic level took place around 315,000, 205,000, 157,000, and 18,000 years ago. A minor event is still at the level of Vesuvius. So, while we no doubt face a major Supervolcanic event, that level may still be off several thousands of years into the future. What is emerging now is more likely to be an important event, but not at the Supervolcanic level.
I have created this site to help people have fun in the kitchen. I write about enjoying life both in and out of my kitchen. Life is short! Make the most of it and enjoy!
This is a library of News Events not reported by the Main Stream Media documenting & connecting the dots on How the Obama Marxist Liberal agenda is destroying America