Biden Administration Declare National Emergency for Clean Energy Production, Invokes Defense Production Act to Facilitate Faster Transformation of Energy Economy Away from Fossil Fuels


Posted originally on the conservative tree house on June 6, 2022 | Sundance

Earlier today, Joe Biden, working toward the agenda of Elizabeth Warren, Bernie Sanders, Wall Street multinationals, and the radical climate change activists within the far left of the socialist democrat party, declared a national emergency around the issue of U.S. energy prices and policies. [SEE HERE]

On the front side of the justification, the people in control of the Biden administration, claim that current and future increases in energy prices are likely to do severe damage to the economy and the lives of all Americans.  However, in the background of the issue, this is the ‘never let a crisis go to waste’ phase of an energy crisis the administration has intentionally created.

The real goal is to fundamentally transform the foundation of the U.S. economy away from fossil fuels and into a new era of clean renewable energy. This is what all of the Biden cabinet officers now refer to as the “economic transition” phase.

Joe Biden’s executive announcement today is the triggering of increased federal government control over the United States energy system.

Ideological government intervention, completely disconnected from the free market, is facilitated by the declaration of a federal national emergency:

[WHITE HOUSE] – Today, President Biden is authorizing the use of the Defense Production Act (DPA) to accelerate domestic production of clean energy technologies – unlocking new powers to meet this moment. Specifically, the President is authorizing the Department of Energy to use the DPA to rapidly expand American manufacturing of five critical clean energy technologies:

  • Solar panel parts like photovoltaic modules and module components;
  • Building insulation;
  • Heat pumps, which heat and cool buildings super efficiently;
  • Equipment for making and using clean electricity-generated fuels, including electrolyzers, fuel cells, and related platinum group metals; and
  • Critical power grid infrastructure like transformers.

In deploying the DPA, the Biden-Harris Administration will strongly encourage the use of strong labor standards, including project labor agreements and community benefits agreements that offer wages at or above the prevailing rate and include local hire provisions. The Administration also will strongly encourage projects with environmental justice outcomes that empower the clean energy transition in low-income communities historically overburdened by legacy pollution.

Following this announcement, the White House and the Department of Energy will convene relevant industry, labor, environmental justice, and other key stakeholders as we maximize the impact of the DPA tools made available by President Biden’s actions and strengthen domestic clean energy manufacturing. (more)

The Biden administration then immediately triggered the Defense Production Act for the U.S. government to: (a) suspend tarrifs; and (b) take control over procurement for all key components needed in the transition from fossil fuel to solar energy.   The products will come from Southeast Asia as the main hub of solar equipment is not located within the United States. DPA Excerpt:

[…] exported from the Kingdom of Cambodia, Malaysia, the Kingdom of Thailand, and the Socialist Republic of Vietnam, and that are not already subject to an antidumping or countervailing duty order as of the date of this proclamation, and to temporarily extend during the course of the emergency the time therein prescribed for the performance of any act related to such imports. (read more)

The DPA emergency authorities have been given to the Dept of Commerce and the people working under Commerce Secretary Gina M. Raimondo, the former governor of Rhode Island.  Each of the DPA’s released today targets specific components of the solar industry [SOURCE LINK].

Obviously, this massive shift in the governmental takeover of energy development is part of facilitating the aforementioned “Green New Deal.”  The approach follows a pattern that is transparent for those who are capable of accepting things as they are, not as we would wish them to be.

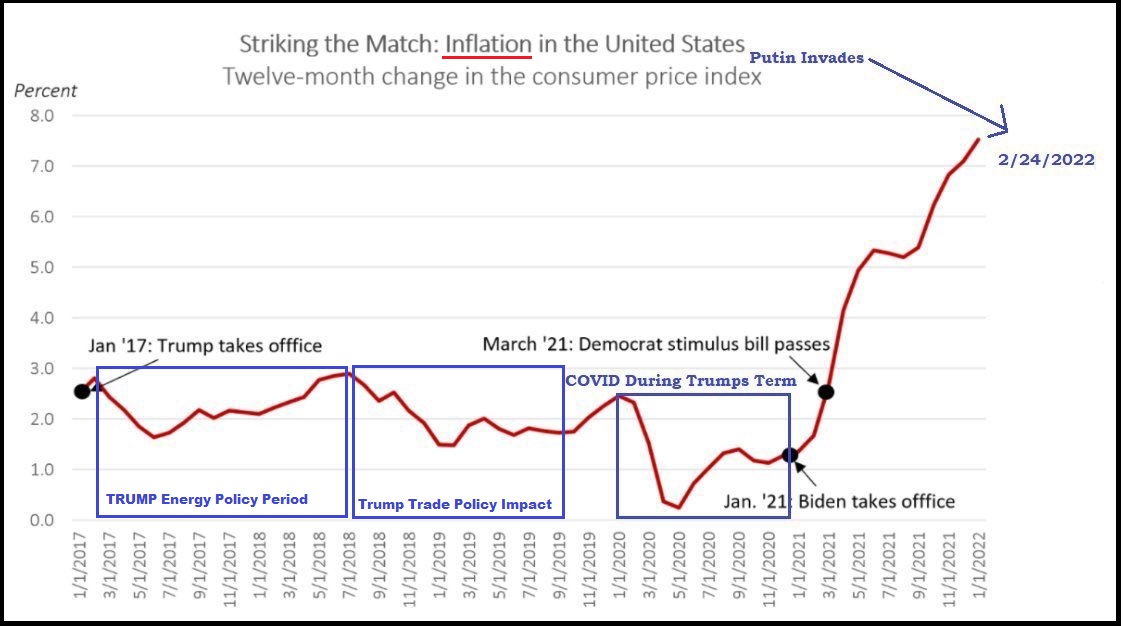
Joe Biden shut down domestic energy development, cancelled pipelines, cancelled leases, retracted the ability to drill in ANWAR (Alaska), and triggered massive new regulatory approaches from the Commerce, Interior and Energy departments.  The resulting increases in oil, natural gas, gasoline, electricity and energy costs overall – which became fuel on the furnace of inflation, have now created the energy crisis that Joe Biden is declaring a national emergency to solve.

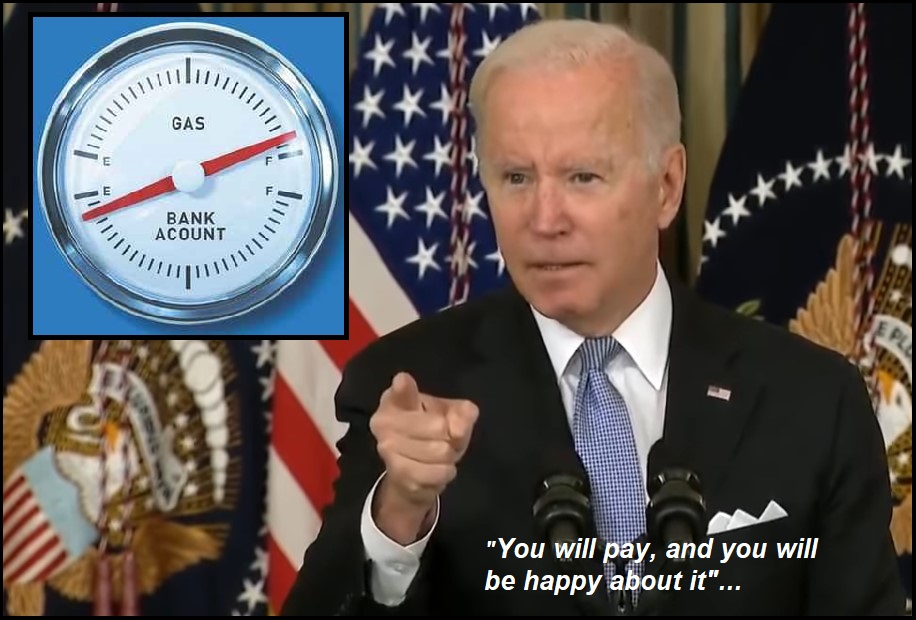
Biden himself has no idea what is happening; he is simply following the instructions of the policy operators who are in control of the administration.  It is the people in the circles of Elizabeth Warren, Bernie Sanders and the climate change activists within the DC bureaucracy that are executing the nuts-and-bolts shifts.  They tell Biden what to do, and he cluelessly does it.  We are the people who end up paying the price for their effort.

It would appear the primary goal is to push everything as fast as possible beyond an infrastructure threshold that could be reversed if/when the radicals are rebuked by the victims, us.

The democrat-socialists are ‘all-in‘ on this economic kamikaze mission.

The radicals took off on inauguration day with a nuclear economic device and only enough fuel for a one-way trip.  They are nearing their destination.

Biden Administration Quietly Raised Amount of Ethanol Required in Summer Blend Gasoline from Ten Percent to Fifteen, Three Predictable Problems Will Surface Soon


Posted originally on the conservative tree house on June 6, 2022 | Sundance 

Last Friday the Biden administration raised the mandatory amount of biofuel, specifically ethanol, that must be blended within the U.S. gasoline supply.  The previous amount of 10% (summer blend) was raised to a year-round 15% (waiver) by the Environmental Protection Agency (EPA).  This is likely to lead to two sets of bigger issues, less food and higher gas prices.

♦ First issue. – The Renewable Fuel Standard (RFS) is a government mandate, passed in 2005 and expanded in 2007, that requires growing volumes of biofuels to be blended into U.S. transportation fuels like gasoline and diesel every year.  Approximately 40 percent of corn grown in the U.S. is used for ethanol.  Raising the amount of ethanol required in gasoline will result in the need for more biofuel (corn).  With farming costs and outputs already under pressure this could be problematic.

♦ Second issue – The EPA enforces the biofuel standard by requiring refineries to submit purchase credits (known as Renewable Identification Numbers, or RINs) to the Environmental Protection Agency (EPA) proving the purchases.  This enforcement requirement sets up a system where the RIN credits are bought and sold by small refineries who do not have the infrastructure to do the blending process.  They purchase second-hand RIN credits from parties that blended or imported biofuels directly. This sets up a secondary income stream, a trading market for the larger oil companies, refineries and importers.

The RIN credit trading platform is similar to what we might expect to see if the ‘Carbon Trading’ scheme was ever put into place.   However, now that summer biofuel requirements for blended gasoline have gone from 10% to 15%, the price of the RIN credits will likely jump.  This will cost refineries billions in additional expenses,…. which will mean the cost of the gasoline from the refineries will increase,….. which will mean the cost of the gasoline at the pump will go higher.

The EPA theory is that RIN credits should be expensive thereby forcing all oil refineries to invest in infrastructure that makes the blended fuel.  All of the infrastructure from the refinery to the gas station would need to be modified to facilitate the new 15% RFS standard.  Again, higher prices at the pumps as a result of oil companies and refineries needing to spend billions on upgrades.   Which brings us to issue number three.

♦ Third Issue – “Ethanol is a valuable source of octane in finished gasoline, but it is chemically different than petroleum gasoline and cannot be used in concentrations above 10 percent in small engines — like outboard boat motors, motorcycles, lawnmowers, generators or chain saws — or in any cars made before 2001. Complicating matters further, most cars on the road today still aren’t warrantied to run on gasoline with more than 10 percent ethanol. Retail stations also must have compatible infrastructure in order to sell gasoline with higher ethanol blends.”  This issue is known within the industry as “The Blend Wall.

The net result of Joe Biden’s EPA raising the mandatory amount of biofuel that must be present in the U.S. gas supply is this:

(1) Less food as more corn is needed for ethanol.

(2) Higher prices for finished and blended gasoline.

(3) Vehicle engines breaking down at a much higher rate. 

The predictable Biden outcome is the absolute worst scenario for the middle-class.

ABC Article on the EPA change HERE.

AFPM Background Information HERE.

WASHINGTON – “The American Fuel & Petrochemical Manufacturers group, which represents refineries, called the 2022 figure “bewildering and contrary to the administration’s claims to be doing everything in their power to provide relief to consumers.” The group said unachievable mandates will increase fuel production costs and keep consumer prices high.” (more)

NEC Director Brian Deese Defends Policy as U.S. Economy Transitions Away from Oil and Gas to Windmills and Solar Power


Posted originally on the conservative tree house on May 31, 2022 | Sundance 

Anytime you hear the code-word “transition”, what the explainers mean is the change from traditional oil, gas and fossil fuels to renewable energy and the Green New Deal.  The phrase “economic transition” is used to explain the economic collapse of Main Street that will happen during the switch.   Remember THE GOAL?  It has never changed.

National Economic Council Director Brian Deese, aka the U.S. version of Baghdad Bob, appears before several audiences today in an effort to use as many words as possible to explain the “transition,” without actually explaining the “transition.”  Why?  Because they don’t want the average person to know what the “transition” is all about…. Because if the average person knew what this “transition” is all about, then they might realize all of these massive increases in price are being done intentionally.   WATCH:

.

Again, you guys are going to get sick of me saying this…. BUT, the number one problem our country faces is that the vast majority of us are PRETENDING.

The White House is pretending the U.S. government does not have full control over what is happening in the economy.  The media are pretending not to know that the White House is avoiding admitting the agenda and economic pain is intentional and unavoidable.  The republican politicians are pretending the Biden economic transition program is because the White House is incompetent.  All of these -and so many more- are just pretenses.

What is being done by the government, in this decision to switch from an oil and gas economy into a wind and solar economy, is being done on purpose. Yes, everyone at every level of government, both political parties and every agency within it, and the entirety of the corporate media are pretending not to know this is the Green New Deal taking place.

We cannot confront or solve this stuff, until we -including media- stop pretending.  Brian Deese is Baghdad Bob.

I will not eat the bugs.

.

GDP Figures Revised Downward, U.S. Economy Shrinks 1.5 Percent in First Quarter, Things are Getting Much Worse


Posted originally on the conservative tree house on May 26, 2022 | Sundance 

May 26, 2022 | Sundance | 160 Comments

The Bureau of Economic Analysis (BEA) originally calculated the first quarter economy at a scale of -1.4% growth. The BEA revises that figure downward today with more data showing a contracted level of consumer spending [DATA HERE].  The economy contracted by -1.5% in the revised numbers.

Gross Domestic Product (GDP) is the dollar value of all goods and services produced in the economy, minus the dollar value of goods and services we import. The percentages discussed are percentages of change over time.

♦ What changed in this revision to make the economy worse?

(1) U.S. inflation was revised upward (prices increased); (2) the estimate of calculated inventories was lowered; (3) the estimate of consumer spending was raised (inflation issue); which leads to (4) a massive drop in the calculation of disposable incomes.  [See the Change Table]

This table shows where the revisions are located:

Look at the revision to disposable incomes:

The Joe Biden’s economic policy is literally: (a) draining our savings and bank accounts, and (b) increasing our personal debt as we struggle to survive.

(Via MSM) – […] The U.S. economic contraction to start the year was worse than expected as weak business and private investment failed to offset strong consumer spending, the Commerce Department reported Thursday.

First-quarter gross domestic product declined at a 1.5% annual pace, according to the second estimate from the Bureau of Economic Analysis. That was worse than the 1.3% Dow Jones estimate and a write-down from the initially reported 1.4%.

Downward revisions for both private inventory and residential investment offset an upward change in consumer spending. A swelling trade deficit also subtracted from the GDP total.

The pullback in GDP represented the worst quarter since the pandemic-scarred Q2 of 2020 in which the U.S. fell into a recession spurred by a government-imposed economic shutdown to battle Covid-19.  (read more)

These economic conditions are mostly driven by energy policy.  U.S. energy policy underlines almost all economic activity and touches every facet of our lives as a consumer. You cannot change U.S. energy policy so drastically without changing every single economic aspect which is connected to energy policy.

What’s coming next?  WATCH:

.

I concur with that prediction.

Prepare your affairs accordingly.

A Technical Study of Relationships in Solar Flux, Water and other Gasses in the upper Atmosphere, Using the April, 2022 NASA & NOAA Data


From the attached report on climate change for March 2022 Data we have the two charts showing how much the global temperature has actually gone up since we started to measure CO2 in the atmosphere in 1958? To show this graphically Chart 8a was constructed by plotting CO2 as a percent increase from when it was first measured in 1958, the Black plot, the scale is on the left and it shows CO2 going up by about 32.0% from 1958 to April of 2022. That is a very large change as anyone would have to agree.  Now how about temperature, well when we look at the percentage change in temperature also from 1958, using Kelvin (which does measure the change in heat), we find that the changes in global temperature (heat) is almost un-measurable at only .4%. As you see the increase in energy, heat, is not visually observably in this chart hence the need for another Chart 8 to show the minuscule increase in thermal energy shown by NASA in relationship to the change in CO2 Shown in the next Chart using a different scale.

This is Chart 8 which is the same as Chart 8a except for the scales. The scale on the right side had to be expanded 10 times (the range is 50 % on the left and 5% on the right) to be able to see the plot in the same chart in any detail. The red plot, starting in 1958, shows that the thermal energy in the earth’s atmosphere increased by .40%; while CO2 has increased by 32.0% which is 80 times that of the increase in temperature. So is there really a meaningful link between them that would give as a major problem?

Based to these trends, determined by excel not me, in 2028 CO2 will be 428 ppm and temperatures will be a bit over 15.0o Celsius and in 2038 CO2 will be 458 ppm and temperatures will be 15.6O Celsius.

The numbers tell us the story of the planets Atmosphere

The full 40 page report explains how these charts were developed .

The Biden Administration Deliberately Destroyed Our Capacity to Produce Energy


Armstrong Economics Blog/Energy Re-Posted May 24, 2022 by Martin Armstrong

Everyone who voted for Biden will continue to see their future utterly destroyed. The climate change people are deliberately destroying the capacity to produce energy without any alternative in place. The word from DC is that they “do not give a sh-t” about the people. They want to destroy our ability to produce fossil fuels before they are thrown out of office if that is even possible.

Alaskan Senator Sullivan explains that the Biden Administration is DELIBERATELY creating an energy crisis and then wants to blame oil companies and Putin. Senator Sullivan explains what Biden has done in just the last three weeks.

Then at the same time, they want farmers to grow only green crops and terminate beef production. The Neocons want to wage war against Russian and China. And nobody stands up and asks – “WHAT THE HELL IS GOING ON?”

Biden Admits U.S. Gas Prices Driven by Incredible Transition Away from Fossil Fuels


Posted originally on the conservative tree house on May 23, 2022 | sundance

During a joint press conference held in Tokyo, Japan, held by Joe Biden and Prime Minister Fumio Kishida, Biden was asked about the financial pain Americans are feeling with massive increases in gasoline prices.

Outlining how his energy policy is directly related to the gasoline price, Joe Biden said: “Here’s the situation. And when it comes to the gas prices, we’re going through an incredible transition that is taking place that, God willing, when it’s over, we’ll be stronger and the world will be stronger and less reliant on fossil fuels when this is over.” Yet again proving the intent of the administration is to implement the ‘Green New Deal’ through executive action.  WATCH:

.

This admission is akin to former President Obama saying, “energy prices would necessarily skyrocket” in order to achieve the goals of the administration.

A Realist Analysis of Global Temperature


And Carbon Dioxide, CO2 Levels

Way too much effort has been put into a non-issue in regards to extreme climate change; because the planet’s climate has never been constant since the planet was formed. In general, the temperatures have run from 12 degree C to 22 degrees C with the average around 17 degrees C. Since we are now around 15 degrees C, which is on the cold side of the average, it’s hard for me to see where the problem is. Especially, since more people die from the cold weather then the hot weather and current temperatures are below normal and therefore not a threat.

Then we have CO2 which has run from a high of around 7,000 ppm around 500 million years ago to 420 ppm today, again historically very, very low. And there does not seem to be any correlation between the two. In fact, if you look at the last 65 million years the CO2 dropped from around 800 ppm to below 200 ppm and temperature dropped form 22 degrees C to around 12 degree C around 1650.  But then CO2 had been dropping for over 100 million year so where is the correlation?

So now, let’s look at the more current climate. But before we can do that, we must look at where all our information comes from. CO2 started to be actually tracked by NOAA in 1958. Their website is https://gml.noaa.gov/ccgg/trends/ and the CO2 levels are published monthly. There is an annual cycle to the CO2 levels, as in the summer, in the northern hemisphere the CO2 levels go down as the vegetation uses the CO2 as food. Then in the winter, we burn lots of carbon based fuels for heating and the levels go back up. Local temperatures have been recorded since the time of the U. S. civil war but they have only been turned into a global temperature going back to 1880 recently with modern computers by NASA. The estimated global temperatures can be found at https://data.giss.nasa.gov/gistemp/  in their table Land Ocean Temperature Index (LOTI) in text or CSV format. However, they are not published as a temperature but as an anomaly from the average temperature from 1950 to 1980 estimated to be 14 Degrees C. which is odd since it’s in the middle of the range that we are looking at which is not a good practice statistically. The reason I say this is that the calculated global temperatures are re-calculated every month as adjustments are made to the software. The process used in called Homogenization by NASA. 

To get the anomaly, you would take the current temperature, say 14.8 degrees C and subtract 14 degrees C leaving .8 degrees C and then multiple that by 100 to give you an anomaly of 80. The NASA LOTI table shows that value for every month from the current back to January 1880. I don’t understand why this is done like that nor why they don’t use kelvin like everyone else would use doing research on the quantity of heat in a subject material. I guess it’s because the temperature changes are so small that it’s hard to show a change relevant to the subject as 80 looks a lot bigger than .8 but we have to work with what we are given. For example, 14.8 degrees C divided by 14.0 degrees C equals 5.7% and 287.95 degrees K divided by 286.15 degrees K = 1.0%. A Note, Kelvin or K is used when making these kinds of calculation is science and engineering.

I have all these values in an Excel spreadsheet in column format by month from the current year back to September 2012, Sadly I didn’t keep the ones back to when I started in 2007 since I didn’t realize, back then, that the values in the table were not fixed and there were changes in them as NASA modified the process used to calculated all the values. There are presently 1,707 values in the LOTI table.

We use the NOAA Co2 value starting in 1958, as is, then use the NASA anomalies from 1958 with an adjustment to determine if there is a reasonable correlation between the two over time. The method used was to create a monthly percent increase for each since 1958 the NOAA data is useable as published. The NASA anomalies need to be adjusted as they don’t represent the actual heat in the atmosphere. The base has to be absolute zero 273.15 K (Kelvin) so we can determine the actual increase in thermal energy in the atmosphere. That is a straight forward calculation which needs no description. Once we have the monthly temperature in degree kelvin, we then calculate the increase in thermal energy from 1958 to the present.

The comparison is then very simple. The first plot shown below as the black plot is the monthly CO2 level in the atmosphere as a percentage increase from 1958. The annual cycle is clearly shown in the Chart. The blue plot is the trend line with a excellent fit with a geometric increase that shows there has been no slowdown in the increase. The equation for the trend is shown in red. The second plot shown below in red (hard to see here) is the monthly heat value of the atmosphere in Kelvin and as percentage increase from 1958 just like CO2. The yellow heat content plot is the trend line with a reasonable fit and the equation for it is shown red at the bottom of the chart. The scales on the chart axes are the same for both plots 95%5 to 150%, so the relationships are correct.

Now since it’s kind of hard to see the temperature changes on Chart 8a as they are so small let’s change the scale on the chart and make a new chart. The new Chart is Chart 8 and the scale on the right side is from 95% 105% the scale on the left side is the same at 95% to 150%. With that change, we can see some movement as shown in Chart 8 on the next page. When you compare the two Charts, you can also see how easy it is to make something look like it is something else.

 This chart shows that if nothing changes from what it is now, by 2038 CO2 will have gone up by 145% and the heat in the atmosphere only .5% and that’s both from the base of 1958. Since we are told that the base is 14 degrees C which is actually 387.15 degrees Kelvin, 100.5% will only be 288.6 degrees Kelvin or around 15.5 degrees C. That is still nowhere near the historic average of 17.0 degree s C.

There is however, scientific evidence that this is probably relatively close to what the physics is predicting as what is shown in a paper written by W. A. Wijngaarden and W. Happer and published on June 8 2020 titled Dependence id Earth’s Thermal Radiation on Five Most Abundant Greenhouse Gases. It’s a 38 page work with significant ramifications to the validity of the IPCC climate change narrative. The bottom line to this scientific study is that there is NO DANGER to additional CO2 in the earth’s atmosphere. Any warming that might be caused by CO2 has for the most part already been accounted for.  Page 13 from that paper, shown on the next page, clearly shows that the sun’s radiation absorption bands for CO2 are now saturated and there will be no additional effect. The green line is no CO2, the black line is the correct level of CO2, and the red line is double the current level of CO2. As can be clearly seen the black and red lines are virtually identical. In other words, the absorption bands of water in the atmosphere are saturated by the CO2 level around 400 ppm so that even if CO2 goes to 800 ppm it will have little to no effect on global temperature.

In summary, we have shown using two methods that CO2 is not a danger but we will be in great danger if we really try to get rid of Fossil fuels. There are three reasons for this assessment that a realistic engineering assessment of switching from fossil fuels to Solar PV and Wind power is just not realistic.

First, the Green power generation required to replace the existing fossil fuel power generating capacity exceeds the “scarce” raw materials available on the planet to make and maintain them. As shown in the next, three reasons.

Second, the life spans of solar PV and wind power devices are “significantly” less than conventional power plants. So they will need to be replaced constantly.  

Third, Solar PV and Wind are both intermittent sources and are not suitable for base load power at the levels required for an advanced technology based economy. The amount of batteries required to smooth the load are also of a relatively short life and would be to be replaced constantly.

Four, The locations for solar PV and Wind generation are generally not were the needs are and they are all in different time zones the Transmission grid will need to be significantly  increased to allow for the high voltage flows over long distances.

Then there is the fact that CO2 levels are now below optimum for plant life to use photosynthesis efficiently; the chemical process of converting sun light and CO2 into sugars to make the food they need to grow. CO2 levels above 1,000 ppm would be desirable and anything below 300 ppm CO2 is risky as planets need a minimum of 180/200 ppm CO2 or they die. 

Plastic Bag Ban


Armstrong Economics Blog/Climate Re-Posted May 4, 2022 by Martin Armstrong

COMMENT: The grocers near me have banned plastic bags. Off timing. Grocery bills are more than I’ve ever seen ..ever. I wont buy as much if theres a few bags per trip. We are lucky to own our homes. Climate change or the food crisis? I see it as a new distraction since they talked of banning them for a long time .. so why now?

REPLY: It is not a far-fetched theory to wonder whether the push to eliminate plastics goes beyond the climate change agenda. Grocery stores have begun banning plastic bags at a time when food inflation is in the double-digits, and the supply chain stalemate has dampened availability. Think about it – the typical American will fill up their grocery cart with food. In other nations, they purchase the ingredients they need for a few days instead of going on major grocery hauls. Limiting American consumers to the bags in their possession could lead to fewer items purchased. This would lower the visibility of inflation and overall consumption.

Over the pandemic, Americans became more self-reliant and began cooking at home 49% more, according to the US Grocery Shopper Trends report. The powers that be, such as Bill Gates, have been pushing for a major change in grocery trends by requesting that first-world nations refrain from eating meat. Gates also cites climate change and not his massive investments in farmland and meat alternatives.

The Environment Agency of the UK released a report in 2011 that found reusable cotton and paper bags have a higher carbon footprint than single-use plastics. A cotton bag, for example, would need to be used 131 times to lower its impact on the environment. While no one is saying plastic bags are ideal for the environment, the rush to ban them is not entirely due to climate change concerns. I believe they are also aiming to change consumer habits at the grocery store.

Sunday Talks, Samantha Power Notes Scarce Food Presents Opportunity to Enhance Larger Goals of Climate Change and Other Weird Stuff


Posted originally on the conservative tree house on May 1, 2022 | sundance 

If you are not familiar with Cass Sunstein’s wife, Samantha Power, I would suggest spending some time on any search feature of the internet.  Power is the archetype ideological traveler within the academic peer group of the Obama team.  Former U.N. Ambassador Power is the person who takes the ideological theory [example Responsibility to Protect (R2P)], and then constructs the mechanisms and network to turn theory into applicable policy.

Samantha put down the filtered Brazilian rainwater coffee this morning and gave a few interviews, that are rather telling of what is going on in the background of the Biden administration.  Discussing Ukraine {Direct Rumble Link} Power let it slip that the absence of industrial fertilizer is a good thing because in the spirit of “never letting a crisis go to waste,” the transition of food growing to more “sustainable farming” through organic fertilizer is a key transition for the bigger picture issue of Climate Change.  WATCH:

Samantha is the prototype backpack, academic, Birkenstock traveler who all model U.N. types view as the person to emulate.  She’s a sustainable algae  cake eater, who bridges the space between the Kennedy Center ballroom crowd and the cross-legged, sitting on the grass, NYU commons activists.

A very dangerous mind, with no practical skills beyond very dangerous ideological theory.

The 2011/2012 crisis in Libya represents an outcome of Power’s R2P theory applied.  Create equitable freedom for the animals by killing the Zookeeper and removing the cages.  The tree dwelling primates are fine, at first, until the big cats run out of deer to eat.  The only way to prevent primate slaughter is to supplement and satiate the cats with alternative meat.  The primates are now forever dependent on foreign intervention for survival…. and yet the free range believing ideologues take no responsibility for the natural mess and absence of ruminants.

Samantha Power, now in charge of USAID (U.S. Aid and International Development) and a host of Non-Governmental Agencies (NGO’s) who rely on USAID, turns her meddling focus from the middle-east toward the crisis in Ukraine.

Notice how she says weird shit like, [02:53] “what we do Margaret, is to work though our implementing partners. So, er, we have, um, folks who are indirectly on the ground, but who are receiving U.S. taxpayer resources in order to provide everything from flak jackets and helmets, again to those safehouses etc.”

How does a person become “indirectly on the ground” in Ukraine, in order to receive funds?

Oh wait, that’s what we need the U.S. government information, disinformation and language approval bureau to figure out before we can start to talk about it…. or something.  Seriously, watch this interview carefully and spot the bureaucratic globbledyspeech.  WATCH:

.