
This is a well thought out post and right one! I have a degree in economics received prior to the shift that embraced John Maynard Keynes’s view on economics as presented in his Book “The General Theory.” In general this view which every school now teaches is that Government can control the economy though monetary policy and regulation. This shift to service from manufacturing which Sundance talks about was just starting to be taught in the early 60’s when I was in school and since it had not been fully adopted and since I had the pleasure of reading to works of Milton Friedman who back then had already broken from the Keynesian view I was not corrupted by the government centric view. My military career and business career after college allowed me to experience the real world and also experience the full effect of the policy’s that moved so much of American might out of the country. Being retired now I write on how insane this view is and so I instantly became a Trump fan within days of his announcement. This is no place for a full debate on the merits or demerits of a service based economy but I can tell you with a high degree of certainty that this concept is fundamentally flawed and is at the very core of the problems that we now have. There is no doubt that Trump has it right my only fear is that we elected him too late to stop the train wreck.
Tag Archives: David Pristash
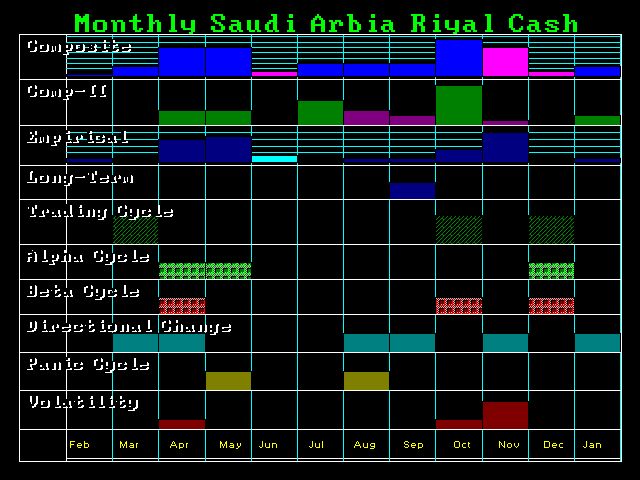
Is Saudi Arabia on the Ropes?
Armstrong Economics Blog
Re-Posted May 1, 2016 by Martin Armstrong

There is serious trouble brewing in Saudi Arabia. They have been dumping oil increasing their output by 3.5%. However, the cash is being kept offshore. Rumors have been flight that members of the Royal family may be creating a stash just in case there is major civil unrest which forces them to flee into exile. Obama on his recent trip told the Saudis they should adopt democratic reform. Make no mistake about it. There is trouble brewing in the Middle East. There is no way Obama would have made such a statement publicly if the situation were not grave.
May – August – October are being highlighted as key periods ahead.

Confused Confidence
Armstrong Economics Blog
Re-Posted May 1, 2016 by Martin Armstrong

QUESTION:
Hi Marty!
I am reading and studying your blogs and Socrates for quite some time and I would really like to thank you for all the insights!
Some days I listen to bloomberg radio for knowing what ‘they’ are saying about the market developments. As I am not an experienced trader as you are, I must admit I don’t understand the ‘collective market behaviours’ e.g. besides all the traps the central banks got themselves into, my normal logical mind tells me that whenever interest rates rise, money gets more expensive, so consequently the only true reason for doing so would be that underlying economic data shows the economy is doing well and can do without ‘help’.
A simple mind like I am tells me that a stock index should rise in case of a well doing economy. Instead I only hear markets fear a interest rate hike. Seems to me that the collective wants interest rates remain low, so stockindex growth driven higher by debt.
The same for example in the case of oil. With my simple mind global economies aren’t as healthy as the financial markets might imply. So in short lower demand and risk of even demand lowering. Instead of a lower price eg. crude oil futures, the futures contract keeps on rising. I am wondering what the fundamentals are that drive up these prices?
Could you give some insights on the real fundamentals that drive markets as from a real- economic perspective I can’t figure it out!
Thnx Marty!
R

ANSWER: The fundamentals flipped after the shift from a private to public wave following 1929. Under the pre-1929 economics of laissez-faire, the government did not attempt to manipulate society with monetary policy. They attempted to lower U.S. interest rates to deflect capital inflows back to Europe, but they did not practice manipulating interest rates domestically to try to manage the economy. Therefore, raising interest rates before 1929 was often seen as bullish because it showed there was a demand for borrowing money due to economic expansion.
Today, the fundamentals are interpreted through the eyes of Marxism. Raising interest rates is now considered a punishment to society intended to deter them from borrowing. Yet, deflation involves declining interest rates due to the lack of interest to borrow. Some say that higher rates are bad for stocks, but they are solely looking at it as a punitive measure that will cost people more to borrow. You even have people cheering gold with lower interest rates.
None of this makes any sense economically. Nonetheless, we are looking at a sharp rise in stocks and gold along with rising interest rates, which will confuse everyone. Interest rates are the manifestation of expected inflation. If you think inflation will be 10%, you will lose money if you lend it at 5%. Interest rates are the price of expected inflation alongside the perceived risk.
Therefore, everything will take off to the upside and the majority, whom will be following the Marxist version of fundamentals, will feed the rally because they will be short. This view of fundamentals will eventually flip back, but only when the public at large sees this flip and goes with it. That is the point of no return where confidence in government collapses.

 I should point out that these fundamentals tend to apply only to the investing class. I remember 1981 when interest rates reached their peak. My mother and her sister went out and bought bank CDs at 20% for 10 years. They did not ask me. They made the decision on their own and said they would never see that much interest again. They are countless others changes the trend and made that peak in the Public Wave 1981.35. This class of people act out of common sense and do not listen to the fundamentals applied in the investing class. This is the real group of people who are the movers & shakers. The rest of us are trying to figure out what they are doing. Keep in mind that within the investing class, they always try to assign some fundamental to explain something. Everyone wants to know WHY. I named by debut report on the ECM back in 1979 – “WHY”.

 Take gold for example. How long have they been saying the dollar is fiat yet gold has not advanced to the same degree as the Dow since 1970. It is one of those fundamentals they always throw at you which become sophistry. Sounds logical and they mix in Germany with wheelbarrows of money, but omit the fact it was a Communist Revolution in 1918 where Germany invited Russia to come take their country wanting to join the Russian Revolution of 1917. Who would keep money in a bank under such conditions? There was a collapse in confidence.
Analysis of Global Temperature Trends, MARCH, 2016 What’s really going on with the Climate?
The analysis and plots shown here are based on the following: first NASA-GISS temperature anomalies (converted to degrees Celsius so non-scientists will understand the plots) as shown in their table LOTI, second James E. Hansen’s Scenario B data, which is the very core of the IPCC Global Climate models (GCM’s) and which was based on a CO2 sensitivity value of 3.0O Celsius, lastly, a plot based on an alternative climate model designated ‘PCM’ based on a sensitively value of 0.79O Celsius.
An explanation of the alternative model designated, PCM, is in order since many have interpreted this PCM model as a statistical least squares projection of some kind. Nothing could be further from the truth. A decade ago when I started this work the first thing I did was look at geological temperature changes since it is well known that the climate is not a constant; I learned that 52 years ago in my undergrad geology and climatology courses in 1964. The next paragraph explains observed patterns in climate.
The following observations give a starting point to any serious study. First, there is a clear movement in global temperatures with a 1,000 some year cycle going back at least 3,000 to 4,000 years; probably because of the apsidal precession of about 21,000 years for a complete cycle. However about every 10,000 years the seasons are reversed making the winter colder and the summer warmer in the northern hemisphere. 10,000 years from now the seasons will be reversed. Secondly, there are also 60 to 70 year cycles in the Pacific and the Atlantic oceans that are well documented. Lastly we also know that there are greenhouse gases such as carbon dioxide. The National Academy of Sciences (NAS) estimated that carbon dioxide had a doubling rate of 3.0O Celsius plus or minus 1.5O Celsius in 1979.
The core problem with the current climate change theory is that the IPCC still uses the NAS 3.0O Celsius as the sensitivity value of carbon dioxide and a number in that range is, in fact, required to make the IPCC GCM’s work. The problem with using this value is it leaves no room for other factors and hence the need of the infamous hockey stick plots of the IPCC from Mann, Bradley & Hughes in 1999. The PCM model is based on a much lower value for carbon dioxide which is consistent with current research that places the value between 0.65O and 1.5O Celsius per doubling of carbon dioxide. If the long and short movement in temperatures and a lower value for carbon dioxide are properly analyzed and combined a plot that matched historical and current (non manipulated) NASA temperature estimates very well can be constructed. This is not curve fitting.
The PCM model is such a construct and it is not based on statistical analyses of raw data. It is based on creating curves that match observations (which is real science) and those observations appear to be related to the movement of water in the world’s oceans. The movements of ocean currents are well documented in the literature. All that was done here was properly combine the separate variables into one curve which had not been previously done, to my knowledge. Since this combined curve is an excellent predictor of global temperatures unlike the IPCC GCM’s, it appears to reflect reality a bit better than the convoluted IPCC GCM’s, which after the past 19 years of no statistical warming have been shown to be in error. That is I should say until NASA gave up real science for political science.
Now, to smooth out highly erratic monthly variations, in itself a problem, a 12 month running average is used in all the plots. This information will be shown in four tables and updated each month as the new data comes in about the middle of the month. Since no model or simulation that cannot reasonably predict that which it was design to do is worth anything the information presented here definitively proves that NASA, NOAA and the IPCC just don’t have a clue, that is until last year when political science took over.
Note, starting in late 20014 and continuing to the present NASA has made major changes to the way they calculate the values used in their table LOTI. These changes have significantly increased the apparent global temperatures (political reasons) and these changes are not supported by satellite data; so they are probably not real. For example in the report issued in April 2010 the following temperatures were reported March 2002 102, January 2007 108. The January 2016 report shows March 2002 90, January 2007 95 and January 2016 as 111 but was it and will it say there? This paper uses the questionable NASA data since it is all that is available at this time. Prior to this “change” the PCM plot showed almost no error for NASA data as can be seen in the plots posted here last year.

The first plot, UL is a plot of the NASA temperature anomaly converted to degrees Celsius and shown in red with a black trend line added. There has been a very clear reversal in the upward movement of global temperatures since about 2001 and neither the UN IPCC nor anyone else has an explanation for this “pause” 13 years later. Since CO2 has continued to increase at what could be argued an increasing rate, this raises serious doubts about the logic programmed into all the IPCC global climate models.
The next plot UR, also in red, shows the IPCC estimates of what the Global temperature should be, based on Hansen’s Scenario B, with the NASA actual temperatures’ subtracted from them. Therefore this plot represents a deviation from what the Climate “believers” KNOW what the temperature should be; with a positive value indicating the IPCC values are higher than actual and a negative value indicating the IPCC values are lower than actual, as measured by NASA. A black trend line is added and we can clearly see that the deviation from expected is increasing at an increasing rate. This makes sense since the IPCC models project increased temperatures based primarily on the increasing level of CO2 in the earth’s atmosphere. Unfortunately, for them, the actual temperatures from NASA are trending down (even as they try to hide the down ward movement with data manipulation) since other factors are in play, therefore each year the gap between them widens. Since we have 13 years of observations’ showing this pattern it becomes hard to justify a continuing belief in the IPCC climate models, there is obviously something very wrong here.
The next plot LL shown in blue is based on the equations in the PCM climate model described in previous papers and posts here and since it is generated by “equations” a trend line is not needed. As can be seen the PCM, LL, there is a 69.1 year cycle that moves the trend line up and then down a total of 0.29O Celsius and we are now in the downward portion of that trend (-.01491O C per year) which will continue until around 2035. This short cycle is clearly observed in the raw NASA data in the LOTI table going back to 1868. Then there is a long trend, 1036.7 years with an up and down of 1.65O Celsius (.00396O C per year) also observed in the NASA data. Lastly, there is CO2 adding about .007O Celsius per year so they basically wash out at -.0039 O C per year, which matches the current holding pattern we are experiencing. After about 2035 the short cycle will have bottomed and turn up and all three will be on the upswing again. These are all round numbers shown here as representative values.
The last plot LR in blue uses the same logic as used in the UR plot, here we use the PCM estimates of what the Global temperature should be with the NASA actual temperatures’ subtracted from them. A positive value indicates the PCM values are higher than actual and a negative value indicates the PCM values are lower than expected. A black trend line was added and it clearly shows that the PCM model is tracking the NASA actual values very closely. In, fact since 1970 the PCM model has rarely been off by more than +/- 0.1 degrees Celsius until the last few months where the manipulation showed up and has an average trend of almost zero error, while the IPCC models are erratic and are were approaching an error rate of over +0.4O C above expected until the last few months.
Note: Since I first started posting this monthly analysis a year and a half ago NOAA and NASA were directed make the global temperatures fit the political narrative that the planet was over heating and something drastic need to be done right now. The problem was as shown in this analysis the “real” world temperatures were not at the level that the IPCC GCM’s said they should be. Major adjustments to the data have been made that give the illusion that temperatures are going up even though they are not. However, as this analysis shows even with the manipulation that has destroyed all credibility from NOAA and NASA they cannot get the global temperatures even close to what their false theory claims they should be.
The next Chart shows the PCM model and all the various government plots related to climate change from 1875 through 2075. Clearly within the next dozen years we will know one way or the other which kind of climate model works. One based on observations and the other based on questionable science. There is no disrespect meant against the real climate scientists that have been marginalized this disrespect is meant for the political scientists who are the worst kind as they work for money not for the truth. Unfortunately, over the past year NASA has been directed by the current administration to make the global temperature match what the IPCC climate models predict it should be; therefore we see the very odd plot in the oval in the following Chart.

In summary, the IPCC models were designed before a true picture of the world’s climate was understood. During the 1980’s and 1990’s CO2 levels were going up and the world temperature was also going up so there appeared to be correlation and causation. The mistake that was made was looking at only a ~20 year period when the real variations in climate move in much longer cycles. Those other cycles can be observed in the NASA data but they were ignored for some reason. By ignoring those trends and focusing only on CO2 the models will be unable to correctly plot global temperatures until they are fixed.
Lastly, the next chart shows what a plot of the PCM model, in yellow, would look like from the year 1400 to the year 2900. The plot matches reasonably well with history and fits the current NASA-GISS table LOTI data, in red, very closely, despite homogenization. I understand that this model is not based on physics but it is also not curve fitting. It’s based on observed reoccurring patterns in the climate. These patterns can be modeled and when they are, you get a plot that works better than any of the IPCC’s GCM’s. If the conditions that create these patterns do not change and CO2 continues to increase to 800 ppm or even 1000 ppm than this model will work into the foreseeable future. 150 years from now global temperatures will peak at around 15.75 to 16.00 degrees C and then will be on the downside of the long cycle for the next 500 years. The overall effect of CO2 reaching levels of 1000 ppm or even higher will be about 1.5 degrees C which is about the same as that of the long cycle. The Green plot shows the pattern with no change in CO2 from the pre-industrial era of ~280 ppm.
Carbon Dioxide is not capable of doing what Hansen and Gore claim!

The purpose of this post is to make people aware of the errors inherent in the IPCC models so that they can be corrected.
The Obama administration’s “need” for a binding UN climate treaty with mandated CO2 reductions in Europe and America was achieved as predicted at the COP12 conference in Paris in December 2015. To support this endeavor NASA was forced to show ever increasing global temperatures that will make less and less sense based on observations and satellite data which will all be dismissed or ignored. Within a few years the manipulation will be obvious even to those without knowledge in the subject.
Sir Karl Raimund Popper (28 July 1902 – 17 September 1994) was an Austrian and British philosopher and a professor at the London School of Economics. He is considered one of the most influential philosophers for science of the 20th century, and he also wrote extensively on social and political philosophy. The following quotes of his apply to this subject.
If we are uncritical we shall always find what we want: we shall look for, and find, confirmations, and we shall look away from, and not see, whatever might be dangerous to our pet theories.
Whenever a theory appears to you as the only possible one, take this as a sign that you have neither understood the theory nor the problem which it was intended to solve.
… (S)cience is one of the very few human activities — perhaps the only one — in which errors are systematically criticized and fairly often, in time, corrected.
Asset Recycling – Robbing Pensions to Cover Government Costs
Armstrong Economics Blog
Re-Posted Apr 25, 2016 by Martin Armstrong

Part of the Pension Crisis we face thanks to negative interest rates destroying pension funds, then we have a temping pot of money government just cannot keep its hands out of. Governments are turning to “asset recycling” which includes even Canada. The federal government of Canada, for example, is looking at a potential source of cash they can rob to reduce the cost of government by shifting Canada’s mounting infrastructure costs to the private sector. They want to sell or lease stakes in major public assets such as highways, rail lines, and ports. In Canada, they sneaked in a line hidden in last month’s federal budget which reveals the Liberals are considering making public assets available to non-government investors, like public pension funds. They will sell the national infrastructure to pension funds robbing them of the cash they have to fund themselves. This latest trick is being called “asset recycling,” which is a system designed to raise money for governments. This idea is surfacing in Europe as well as the United States especially among strapped cash States.

 This is the other side of 2015.75 which was the peak in government (socialism). Everything from that point forward is a confirmation that these people are in crisis mode. They are rapidly destroying Western Culture because they are simply crazy and they people who vote for them blindly are out of their minds. They are destroying the very fabric of society for they cannot see what they are doing nor where this all leads. Once the wipe out the security of the future, this is how government crumble to dust to be swept away by history. We deserve what we blindly vote for.
Historical Evidence of Climate Change Links to Political Change
Armstrong Economic Blog
Re-Posted Apr 25, 2016 by Martin Armstrong

QUESTION: Mr. Armstrong; I have read your thesis on global warming and that this is only part of a natural cycle. I admit that you have persuaded me whereas the claims are false especially that New York City should have been under water by now according Al Gore. You mentioned that there was global warming which enabled the Vikings to reach America because the ice melted. My question is rather blunt. If we are headed now into a global cooling period, what is the historical evidence that society also declines?
Thank you in advance
PD
ANSWER: I have reported that the peat fires in Borneo and Sumatra have now exceeded all the emissions from the entire U.S. economy. This whole movement is simply to raise taxes on the bogus theory of global warming. We are not so powerful to alter the course of cyclical movement of the planet. Bouts of global cooling (ice ages) as well as warming periods predate the combustion engine and mankind. It is rather questionable analysis to claim we have altered the climate. We are capable of polluting things, true. But actually altering the climate is something beyond our power.
Volcanoes are a major issue in climate change. Yes, studies show that the Hawaiian Kilauea show that the eruption discharges between 8,000 and 30,000 metric tonnes of CO2 into the atmosphere each day, which has been going on for more than 20 years. However, gas studies worldwide by volcanologists have calculated that global volcanic CO2 production on land and under the sea release a total of about 200 million tonnes of CO2 annually. But this is really in the absence of any really catastrophic eruptions. Volcanoes emit also Sulfur dioxide SO2 which automobiles emit very little. When Mount St. Helens erupted on May 18th, 1980, it produced 1.5 million metric tons of sulfur dioxide on that one day and about 2 million metric tons for the entire event far more than automobiles.
 Moreover, volcanic production of CO2 is by far not really the issue in climate change. Instead of global warming from CO2, it is the plume of ash in the sky which actually blocks the sun and reverses the climate from warm to cold like sitting under an umbrella at the beach. I have discussed Mount Tambora which erupted in 1816 and threw into the air so much ash that it snowed during the summer in New York City. It became known as 18-hundred-and-froze-to-death. I have shown the correlation of that eruption to wheat prices.
 I have also written about the Maunder Minimum which sent the Earth into a cold period 300 years ago from the perspective of the cycle energy output from the Sun. I have also gone into the evolution of science which has been set in motion by the very discovery of a frozen woolly rhinoceros which altered science in many fields. I have explain how the temperature at the time of the American Revolution was at its lowest point in the cycle.

All of that said, the ice core samples have revealed that there were two major volcanic eruptions in two major volcanic eruptions in 536 and 540 AD which sent Europe into an ice age and wiped out the Roman civilization. Flavius Odoacer (433–493) was a soldier who in 476 became the first King of Italy (476–493) after deposing Romulus Augustus, the last official Roman emperor in the West.

Odoacer was overthrown by Theodoric the Great (454-526), the Ostrogoth. He was followed by Athalaric (526-534), and a few others then finally Baduila (541-552). So while Rome officially ends in the West with Romulus Augustus, the Ostrogoths fade out after 552 due to the climate changes. In the East, the change in climate appears to have also possibly been linked to the Plague of Justinian (541–542) which was a pandemic that afflicted the Eastern Roman (Byzantine) Empire, especially its capital Constantinople, the Sassanid Empire, and port cities around the entire Mediterranean Sea. I have written about the political turmoil there in Byzantium which preceeded the plague during the Nika Revolt of 532AD. I have also written about how empires die. It does seem that when temperatures decline, civil unrest rises and this increases the risk of revolutions.
When Thera erupted around 1645-1650BC, this created a climate change and marked the end of the Minoan civilization. They were conquered by the Mycenae who also captured Troy. As the weather turned cold, Greece goes into a Dark Age. The Greeks migrated and other places called them the “sea people” since they did not know where they came from as the invaded Northern Africa. Homer wrote about the period before the Dark Age known as the Heroic Period. Scholars thought this was fiction about Troy and Mycenae until Heinrich Schliemann (1822 – 1890) set out and discovered that what Homer wrote about was history.
The historical evidence is rather extensive. It does appear that as we enter into a global cooling period, governments will fall, disease will increase, and the risk of Western Civilization declining sharply all become historically possible.
Failure of Abenomics
Armstrong Economics Blog
Re-Posted Apr 23, 2016 by Martin Armstrong

Abenomics (アベノミクス Abenomikusu ?) in Japan are the economic policies advocated by Shinzō Abe since the December 2012 general election, which elected Abe to his second term as Prime Minister of Japan. Abenomics is based upon “three arrows” of fiscal stimulus, monetary easing and structural reforms. This has been a complete failure as the economy continue to implode. The Bank of Japan hinted possible proposals to take rates even further negative and the likelihood banks passing these levels on to the general public.

The dollar rallied against the yen right on target for 43 months (8.6 / 2), and has declined about 8.6 months from the high in June of 2015. It appears to be on target and the latest suggestion of further negative rates being passed on by the banks will most likely cause a flight from the yen besides admitting Abenomics has failed. This has also contributed to the Dow Jones Industrial Average rising and holding last year’s low distinct from the S&P500 and NASDAQ.
What Are Tangible Assets
Armstrong Economics Blog
RE-Posted Apr 20, 2016 by Martin Armstrong

QUESTION: Hi Martin,
In your April 20 blog post, you stated “You are better off with tangible assets for the transition when it comes.”
Please explain what “tangible” assets are, and what “non-tangible” assets are, assuming these also exist.
Thanks for the wonderful education,
M.
ANSWER: Tangible Assets are non debt related – fixed assets in general. This includes commodities, equities, and real estate. The commodities include non-perishable such as gold, silver, platinum, copper, etc.. The agricultural commodities are not really sustainable on a long-term basis. The primary advantage to silver and gold is that they are the same commodity in different nations where as you have even difference between Texas and Brent crude oil. Real estate varies depending upon location. You definitely have two problems. First, there is the risk of tax increases, and Second, there is the geopolitical risk in some areas. Equities (shares in public corporations), serve well and blue chips have never defaulted. Even if a company goes bust, you get something back. When government debt goes bust, you get nothing.
Illinois is Brooke and Cannot Pay the Politicians
Armstrong Economics Blog
d Posted Apr 20, 2016 by Martin Armstrong

I have warned that Illinois is on the brink of bankruptcy. Now, Illinois Comptroller Leslie Geissler Munger says she will delay monthly paychecks for lawmakers and statewide officials since there isn’t enough money to pay the state’s bills and other services should come first. This is really interesting. What will happen next when the politicians cannot get paid?
Negative Interest Rates Destroying the World Economy
Armstrong Economics Blog
Re-Posted Apr 17, 2016 by Martin Armstrong

QUESTION: Mr. Armstrong, I think I am starting to see the light you have been shining. Negative interest rates really are “completely insane”. I also now see that months after you wrote about central banks were trapped, others are now just starting to entertain the idea. Is this distinct difference in your views that eventually become adopted with time because you were a hedge fund manager?
Just curious;
Bob
 ANSWER: I believe the answer is rather simple. How can anyone pretend to be analysts if they have never traded? It would be like a man writing a book explaining how it feels to give birth. You cannot analyze what you have never done. It is just impossible. Those who cannot teach and those who can just do. Negative interest rates are fueling deflation. People have less income to spend so how is this beneficial? The Fed always needed 2% inflation. The father of negative interest rates is Larry Summers. He teaches or has been in government. He is not a trader and is clueless about how markets function. I warned that this idea of negative interest rates was very dangerous.
Yes, I have warned that the central banks are trapped. Their QE policies have totally failed. There were numerous “analysts” without experience calling for hyperinflation, collapse of the dollar, yelling the Fed is increasing the money supply so buy gold. The inflation never appeared and gold declined. Their reasoning was so far off the mark exactly as people like Larry Summers. These people become trapped in their own logic it becomes irrational gibberish. They only see one side of the coin and ignore the rest.
Central banks have lost all ability to manage the economy even in theory thanks to this failed reasoning. They have bought-in the bonds and are unable to ever resell them again. If they reverse their policy of QE and negative interest rates, government debt explodes with insufficient buyers. If the central banks refuse to reverse this crazy policy of QE and negative interest rates they will see a massive capital flight from government to the private sector once the MAJORITY realize the central banks are incapable of any control.

 The central banks have played a very dangerous game and lost. It appears we are facing the collapse of Social Security which began August 14th, 1935 (1935.619) because they stuffed with government debt and robbed the money for other things. Anyone else would go to prison for what politicians have done and prosecutors would never defend the people because they want to become famous politicians. We will probably see the end of this Social Security program by 2021.772 (October 9th, 2021), or about 89 weeks into the next business cycle. These people are completely incompetent to manage the economy and we are delusional to think people with no experience as a trader can run things. If you have never traded, you have no busy trying to “manipulate” society with you half-baked theories. So yes. The central banks are trapped. They have lost ALL power. It becomes just a matter of time as the clock ticks and everyone wakes up and say: OMG!

We have government addicted to borrowing and if rates rise, then everything will explode in their face. Western Civilization is finished as we know it just as Communism collapsed because we too subscribe to the theory of Marx that government is capable of managing the economy. Just listen to the candidates running for President. They are all preaching Marx. Vote for me and I will force the economy to do this. IMPOSSIBLE! We have debt which is unsustainable the further you move away from the United States which is the core economy such as emerging markets. Unfunded pensions destroyed the Roman Empire. We are collapsing in the very same manner and for the very same reason. We are finishing a very very very important report on the whole pension crisis issue worldwide.
