Over 37,000 Head of Cattle Die from Global Warming in Montana?


COMMENT: Marty, the winter of 2018 has been the coldest ever. We lost so many heads of cattle here in Montana, I have never seen it this bad in my lifetime. These people preaching global warming belog in prison.

JH

REPLY: The federal Livestock Indemnity Program paid out $11.1 million for the loss of 37,352 cattle in Montana in 2018. Ranchers and the Farm Service Agency (FSA) say there were more weather-related cattle deaths that did not qualify for compensation. These people will send the European economy down even further wiping out economy growth by eliminating the combustion engine. The damage they are causing around the world is really insane.


European Car Manufacturers Heading into a Crisis?


The Global Warming conspiracy is going to seriously harm the European economy. The political intolerance for the combustion engine has German engine suppliers in a crisis. It appears that there is certainly no more money being invested in any technology to do with the combustion engine. That also means that the unemployment in that industry will rise to the worst levels witnessed during the Great Depression. Normally, you have a transition from one technology to another which always leaves people behind who cannot adapt. However, this particular transition is not being carried out by the free market or the natural trend of evolution in technology. This time, the transition is being compelled by government and the end result is not likely to be very beneficial to the European economy.

Additionally, German car manufacturers will have no choice but to move production of combustion engines offshore for other markets. The prospect of being able to manufacture combustion engine cars in Europe for export will diminish greatly. Back in 2010, Ferrari S.p.A. was looking to idle production and eliminate 9% of its work force after sister brand Maserati reduced orders for engines.  While Maserati sells an average of 3,000-3,500 vehicles annually in North America, all Maseratis are built in Italy.

Beyond 2021, the EU is finalizing plans that, once agreed later this year, would cut automaker CO2 targets by 15 percent from the 2021 averages by 2025 onward and to 37.5 percent after 2030 That means the average CO2 emissions of less than 60g/km on an NEDC basis (almost 110 miles per gallon), or 66g/km under WLTP. The costs of adding the required tech will not be cost-effective in smaller cars. That means prices on the preferred smaller smart cars in Europe could rise by an additional 10% due to regulation.

Debunking the Climate Consensus


Published on Jul 6, 2018

SUBSCRIBE 14K
You’re often told 97% of scientists believe global warming is happening and it’s our fault. Well, this statement is a lie and Christopher Monckton will show you why.

Climate Change Narrative is Driven by Agenda of Political Control—Myron Ebell


Is climate change actually causing a crisis, as many are saying? In the global warming debate, what is the actual “settled science” that most scientists agree on, and what exactly is being contested? And how will climate change factor into 2020? This is American Thought Leaders, and I’m Jan Jekielek. Today we sit down with Myron Ebell, the Director of Global Warming and International Environmental Policy at the Competitive Enterprise Institute, a non-profit think tank that promotes limited government, free enterprise, and individual liberty. We explore the climate change debate through his eyes, including the stark differences between climate change projection models and actual measurement data, the role of China in global greenhouse gas emissions, the Green New Deal, the political interests behind the push for wind and solar energy, and how this overall debate will impact 2020.

Digital Exclusive: Dr. Patrick Moore TEARS APART The Green New Deal | Huckabee


Published on May 11, 2019

Watch Huckabee Saturdays and again Sundays 8/7c exclusively on TBN Connect with Mike Huckabee: https://www.facebook.com/mikehuckabee/ https://twitter.com/GovMikeHuckabee Stay updated with Huckabee On TBN: https://www.facebook.com/HuckabeeOnTBN/ https://twitter.com/HuckabeeOnTBN https://www.instagram.com/huckabeeontbn/


A Technical Study in the Relationships of Solar Flux, Water, Carbon Dioxide and Global Temperatures, May 2019 Data


From the attached report on climate change for May 2019 Data we have the two charts showing how much the global temperature has actually gone up since we started to measure CO2 in the atmosphere? To show this graphically Chart 8 was constructed by plotting CO2 as a percent increase from when it was first measured in 1958, the Black plot, the scale is on the left and it shows CO2 going up a bit over 30.0% from 1958 to May of 2019. That is a very large change as anyone would have to agree.  Now how about temperature, well when we look at the percentage change in temperature from 1958, using Kelvin (which does measure the change in heat), we find that the changes in global temperature (heat) are almost un-measurable. The scale on the right side had to be expanded 10 times (the range is 40 % on the left and 4% on the right) to be able to see the plot in the same chart in any detail. The red plot, starting in 1958, shows that the thermal energy in the earth’s atmosphere increased by .30%; while CO2 has increased by 30.0% which is 100 times that of the increase in temperature. So is there really a meaningful link between them that would give as a major problem? The numbers tell us no there isn’t.

The next chart is Chart 8a which is the same as Chart 8 except for the scales which are the same for both CO2 and Temperature. As you see the increase in energy, heat, is not visually observably in this chart hence the need for the previous chart 8 to show the minuscule increase in thermal energy shown by NASA in relationship to the change in CO2. Based to these trends, determined by excel not me, in 2028 CO2 will be 428 ppm and temperatures will be 15.0o Celsius and in 2038 CO2 will be 458 ppm and temperatures will be 15.6O Celsius. This is what the data shows no matter what the reasons are, so I have no idea how the IPCC gets to predict that the world will end in ten or even twenty years.

The full 37 page report explains how these charts were developed and why using NASA and NOAA data are used with out change to prove that The New Green Deal is not required and any attempt to compliment that plan will be a world wide disaster.

Click on the link below for the full report that you can download.

BLACKBODY TEMPERATURE 2019-05

The Forecast of 1997 Calling for the Inverse Relationship between Bonds & Shares Remains on Target


QUESTION: Mr. Armstrong; I attended your WEC in London back in 1997 when the Euro Commission took the entire back row. I remember your forecast that we would begin a period of a dramatic shift in the bond-equity correlation I believe you said would last for at least 23 years. That is nearly due. You were obviously correct and that did begin with the introduction of the euro in 1998. You were dead center between Barton Biggs and Steve Roach. Do you still see this inverse relationship flipping in 2021 as you forecast back then?

JK

PS I left the bank….. and am now retired.

ANSWER: A lot of people I knew in the various banks back in the 1990s have left before the cards start to fall. I remember well. They were at Morgan Stanley back then and the two were polar opposites on their forecasts if I remember correctly. Barton Biggs argued that the world would be flooded by a glut of cheap Asian labor and Steve Roach was pointing to the Philips Curve warning that public deficits in the west would lead to a massive inflationary bonfire.

The Stock-Bond Correlation was the real debate. Our model was warning that stocks and bonds would indeed behave very differently which has materialized. Since 1998, stock prices and bond prices have been negatively correlated. In other words, when stock prices go up, bond prices go down and vice versa. Overall, stocks and bonds are indeed currently acting in opposition to each other on the macro-trend level. There has been a negative correction which some call the “flight to quality” when confidence collapses in the private sector, capital fled to the public sector. The broader 250-year relationship would argue that this is highly unusual. It is true that stocks and bonds moved up and down together throughout the 250 years prior to the 21st century.

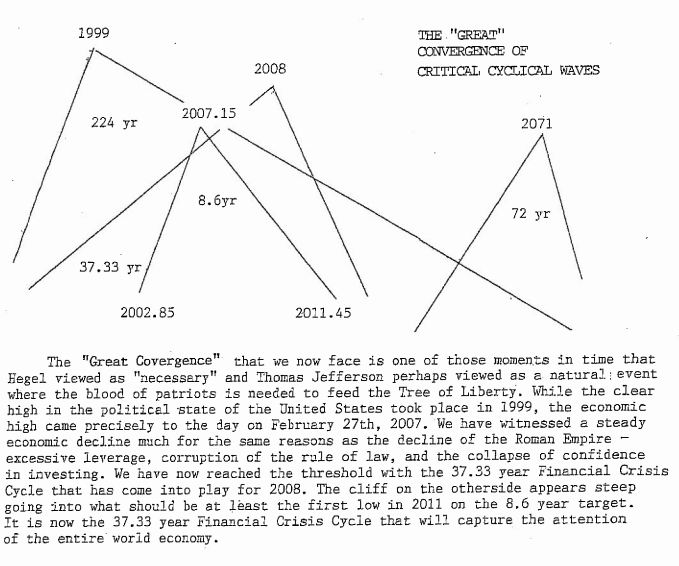
The reason I delivered that forecast back then was the realization that government debt had entered a perpetual borrowing cycle ever since World War II. Moreover, the 224-year cycle of political change was due in 1999. That meant the political peak in government would take place at that time. The economic peak would by 2007. Both of those forecasts have been absolutely correct. Politics has declined steadily and ever since the 2007-2009 crash, interest rates have dropped sharply and there has been a contraction in inflation with a decline in economic growth.

In Its Just Time, I wrote: “While the clear high in the political state of the United States took place in 1999, the economic high came precisely to the day on February 27th, 2007. “

The flip in this relationship is still on target. Nothing requires any change to that forecast I delivered back in 1997. This is all being driven by the Sovereign Debt Crisis.

The Next 8.6-Year Wave will be Inflationary


All the real science is warning that there is a reasonable chance that we are headed into a much colder period ahead. This will have an impact on food prices and out computer models have been warning that the next wave of the Economic Confidence Model should be an inflationary wave. Even a new study from  nature.com said: “The recent prolonged solar minimum and subsequent weak solar cycle 24 have led to suggestions that the grand solar maximum may be at an end.”

The next 8.6-year wave beginning in January should produce a collapse in confidence in governments which will result in a shift from Public to Private assets, but then on top of this, we see a shortage in agricultural markets adding to the inflationary wave coming. Then add the Monetary Crisis and Sovereign Debt Crisis cycles and we end up with some very interesting impacts during the next wave.

Socrates & Gold


COMMENT: Mr. Armstrong; I want to salute you on creating Socrates. Its forecast on gold was remarkable. When gold was starting to breakout on May 31, Socrates wrote concerning your breakout points:

We did close below the previous session’s Intraday Projected Breakout Resistance indicator which was 129370 settling at 129240 gesturing that the market is not in a breakout mode at that precise moment. The current Projected Breakout Resistance for this session was 129740 which we have now closed above suggesting the market is starting to possibly breakout to the upside if it can be maintain in the next trading session. The Projected Breakout Resistance indicator for the next session will be 132023.

The next day closed at 1327 and off it ran. It is amazing how the computer explains these moves in advance.

See you in Orlando

HP

REPLY: This is my objective. To have a computer write the analysis and you know there is no human bias involved one way or another. Just call it by the numbers without all the nonsense. Socrates now covers more than 1,000 instruments around the world every day. There are not enough analysis in the world to write so many reports every day. This is the way to the future. Objective analysis without the human bias.


Swedish Scientist Debunks Rising Sea Levels